The XRP price has broken out from a two-year-long resistance line. If the price manages to hold on to the current support area, it is likely to continue moving upwards.
Breakout From Two-Year Resistance
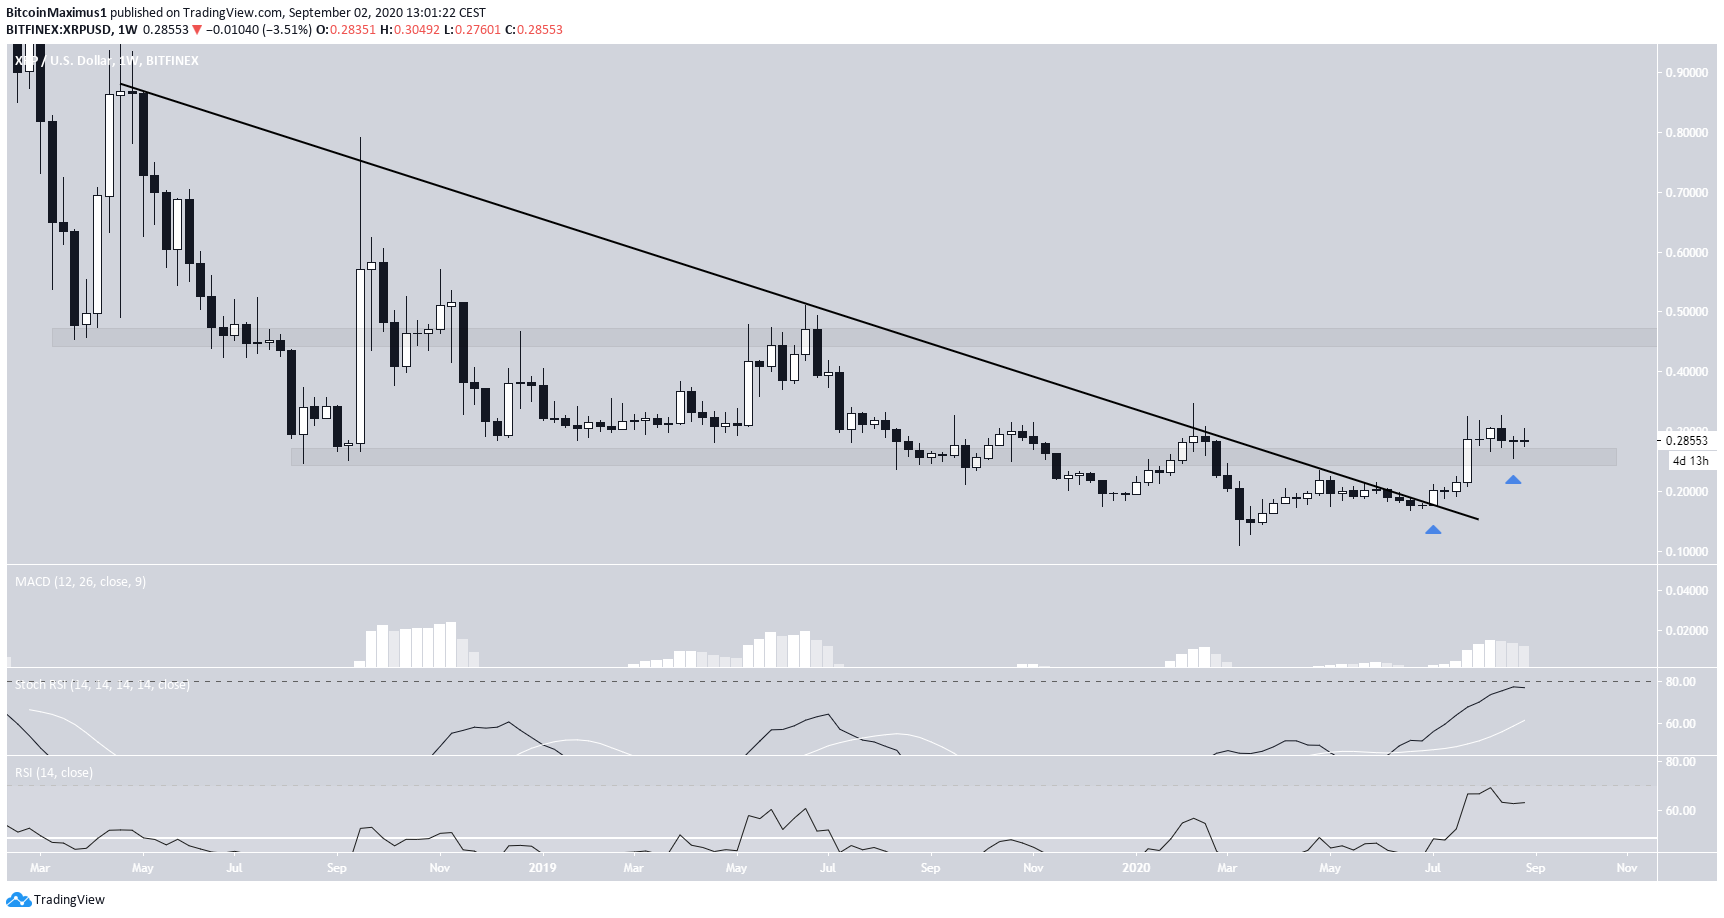
At the beginning of July, the XRP price broke out from a resistance line that had previously been in place since April 2018. After validating the line as support, the XRP price continued to move upwards and broke out above the $0.26 area, flipping it to support.
The next resistance area is found all the way up at $0.46.
Technical indicators are bullish. Both the RSI and stochastic RSI are increasing, and so is the MACD. There is no bearish divergence in place. Therefore, there is nothing to suggest that XRP will not continue moving upwards towards the next resistance area.
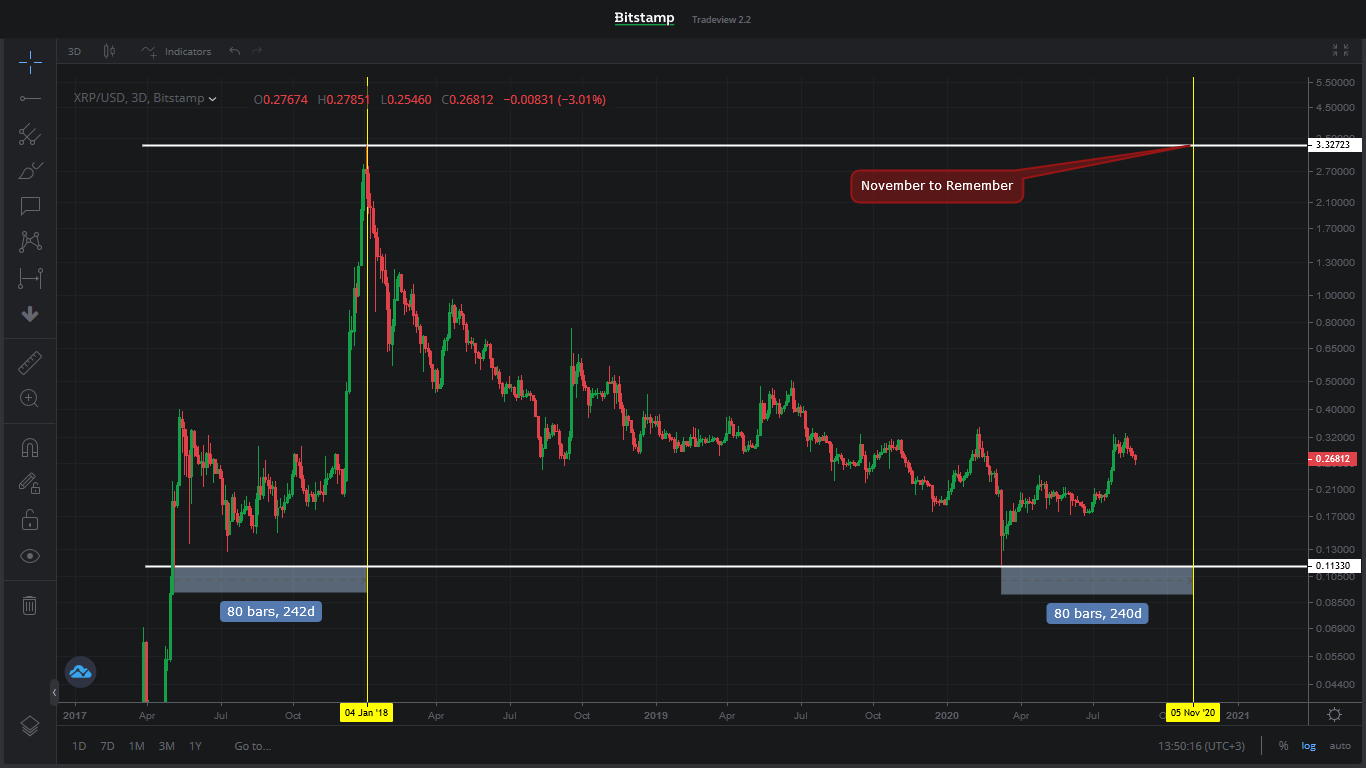
Cryptocurrency trader @saifalzrahrani20 stated that the XRP price could increase all the way to $3.20, comparing the possible rally to the January 2018 one.
While this is technically possible, it’s extremely unlikely that the price will rally by 1000% in just two months, and other than the vague similarities between the two moves, there is nothing else to suggest that the rally will occur.
XRP’s Daily Time-Frame
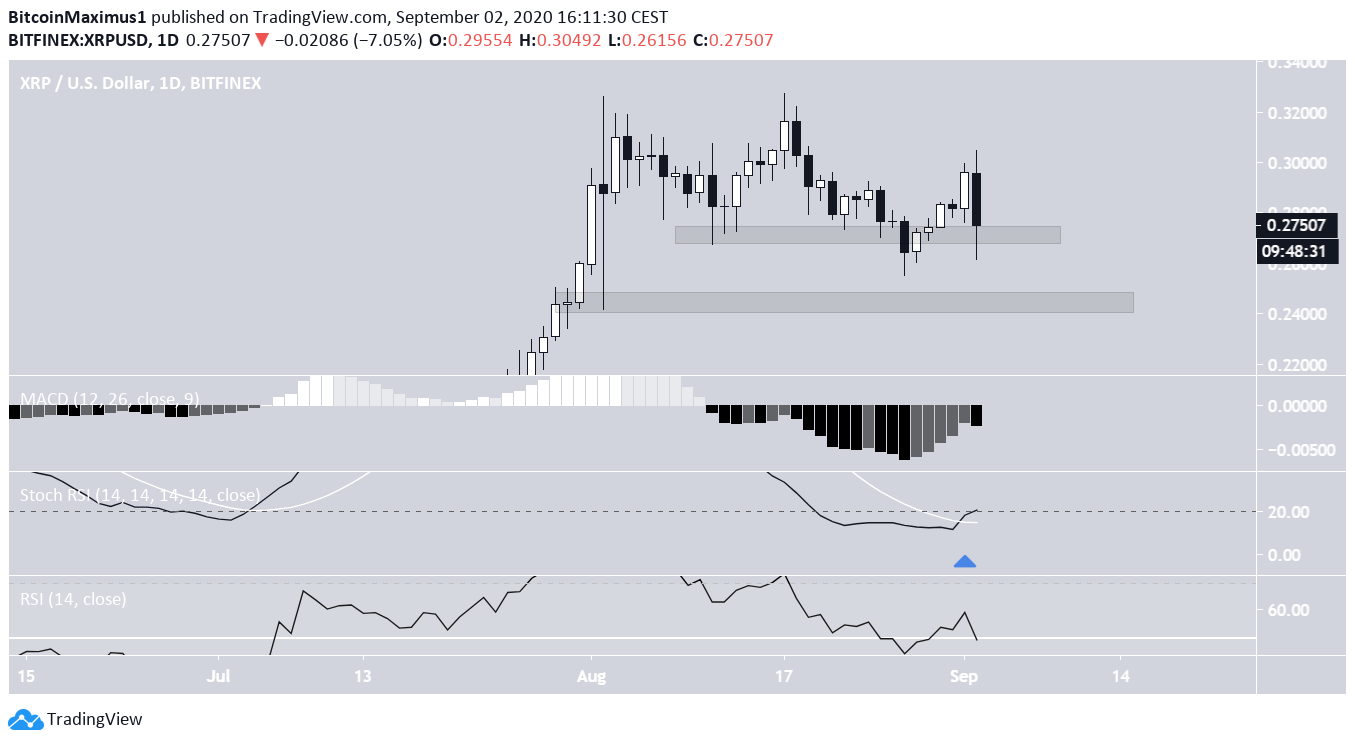
The daily chart shows that the price is resting inside the $0.275 support area.
Technical indicators are bullish. The stochastic RSI has made a bullish cross inside oversold territory and has begun to move upwards. The MACD has given a bullish reversal sign and is also moving upwards. The RSI has bounced at the 50 line.
However, there is a massive bearish engulfing candlestick in progress today, which could cause a breakdown from the current support area and invalidate the bullish signs.
If a breakdown occurs, the price could fall to the next support area at $0.24.
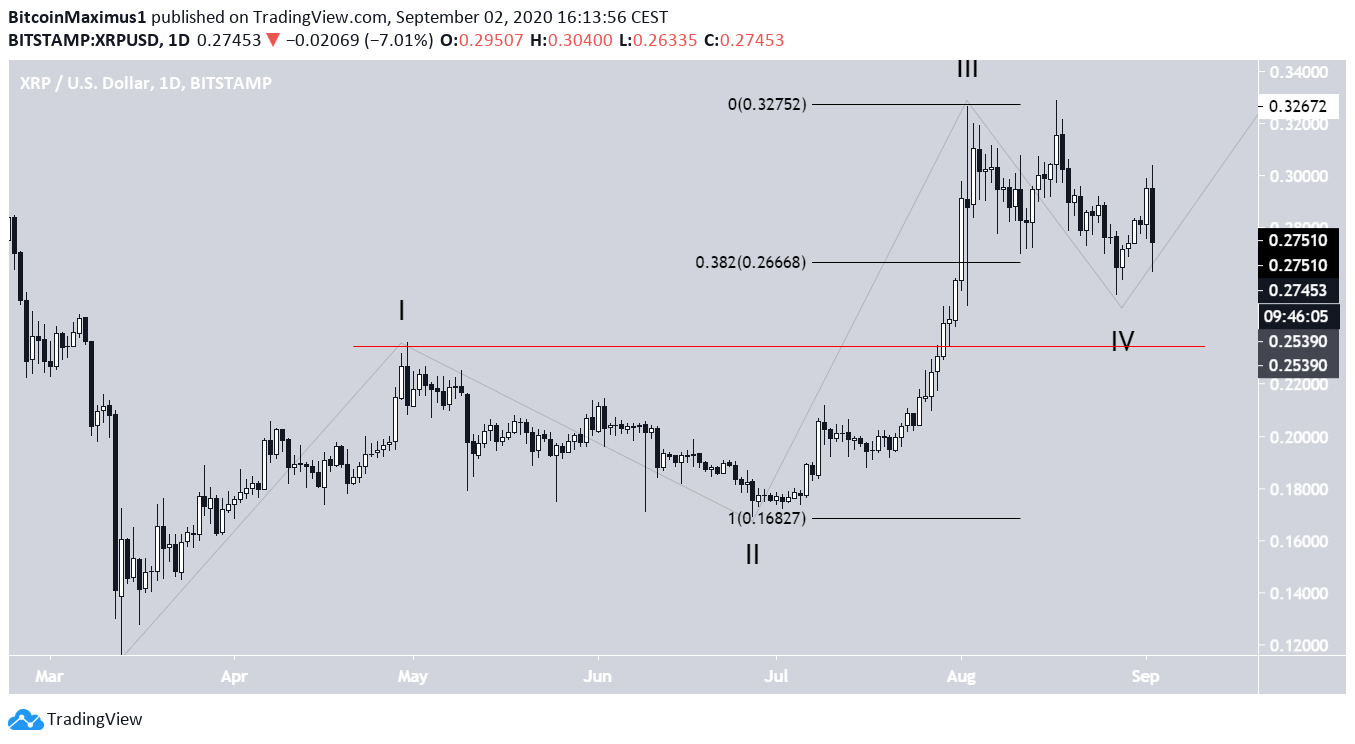
Wave Count
The XRP price began an impulsive five-wave upward move at the beginning of March. Currently, it seems that the price has just finished, or is in the process of finishing the fourth wave, after which the fifth one should resume, taking the price towards the previous $0.46 resistance area.
A decline below the wave 1 high at $0.235 would invalidate this wave count.
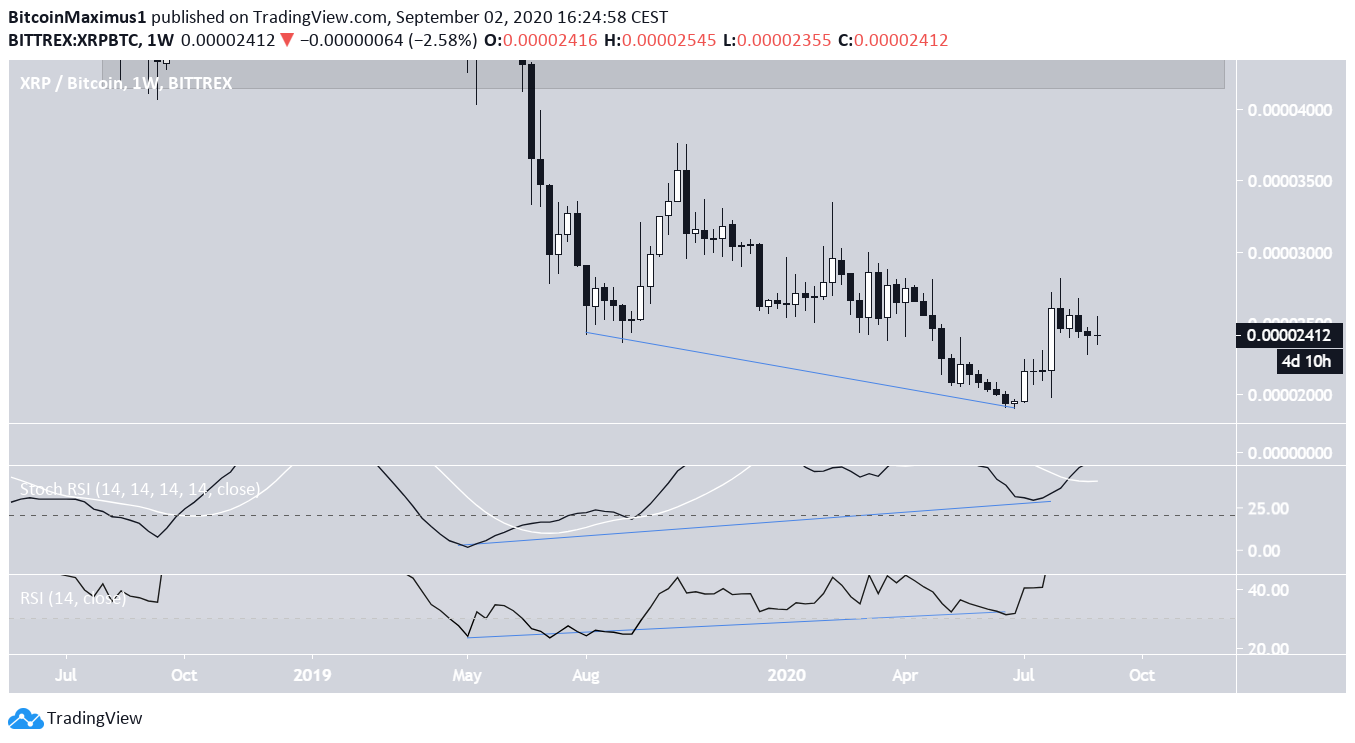
XRP/BTC
The XRP/BTC price shows a pronounced bullish divergence in both the weekly RSI and stochastic RSI. The former has already made a bullish cross. This is a sign that the price is likely to continue moving upwards, possibly towards the 4300 satoshi resistance area.