
XRP (XRP) is trading at $1.40, down 1.71% on the day, as a concentrated supply wall between $1.57 and $1.59 limits the recovery of February’s losses.
Three on-chain metrics now point in the same direction — network overvaluation is rising, transaction activity is fading, and a billion-dollar cost basis cluster sits directly overhead.
XRP Seems Overvalued Right Now
The Network Value to Transactions Ratio (NVT) for XRP has spiked on a 7-day moving average basis as of March 24. That reading is the third time this indicator has reached the 200 level since December 2025.
Each of the prior two spikes to 200+ coincided with price corrections. The December spike near 220 preceded a sharp decline. The January spike to 220 similarly preceded the February low. The current surge to 202 is unfolding as price consolidates around $1.41, well below the $1.54 peak seen on March 16.
Want more token insights like this? Sign up for Editor Harsh Notariya’s Daily Crypto Newsletter here.
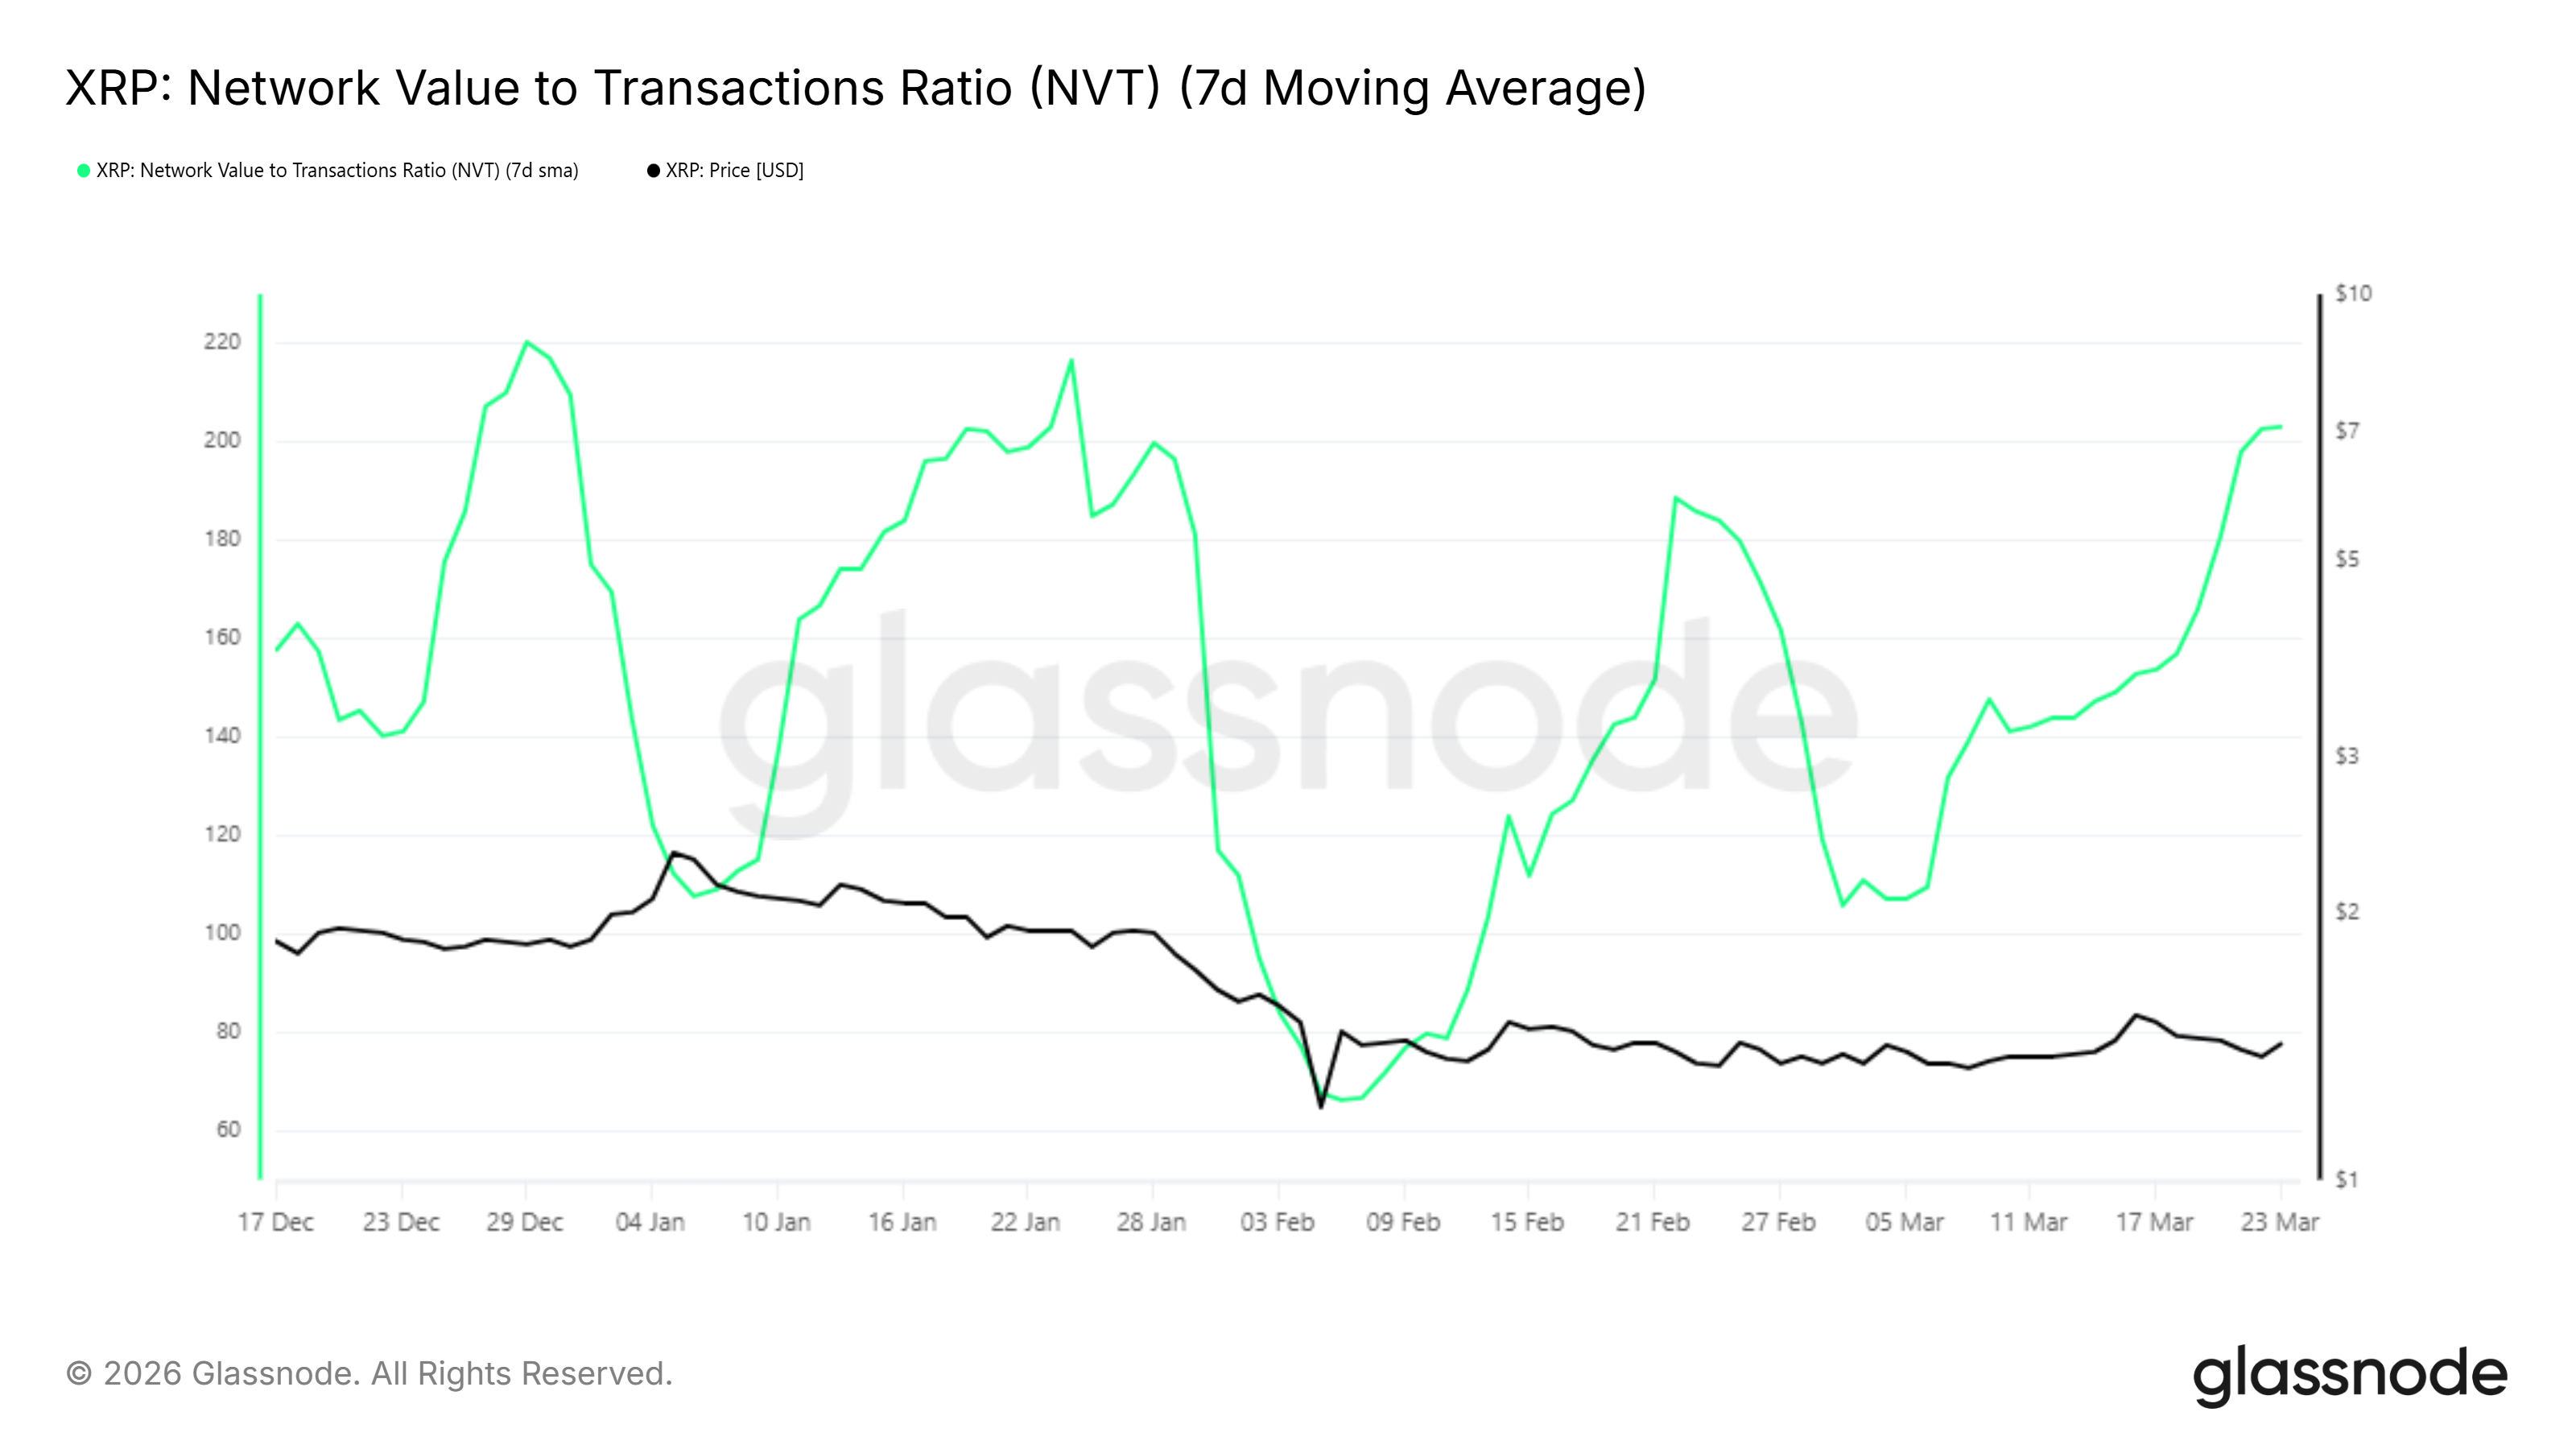
A high NVT means the network’s market cap has grown faster than its on-chain transaction volume. In plain terms, the token is being priced above what its actual network usage justifies. For the signal to turn neutral, either price must pull back, or transaction volumes must rise meaningfully.
Volume Collapses as XRP Activity Fades
Despite the elevated NVT, on-chain transaction data from Santiment shows a sharp decline in daily activity since the March 15–16 peak. Total daily on-chain volume — combining profit and loss-side transactions — reached above 390 million XRP on March 15. By March 24, that figure had collapsed to approximately 70 million.
The profit-side component on March 24 sits at roughly 54.8 million XRP, with the loss-side at 15.58 million XRP. While the profit-to-loss ratio remains tilted toward profit, the absolute volume is too low to signal genuine accumulation. High on-chain volume with profit-side dominance would be a bullish sign.
The current reading reflects disengagement, not conviction.
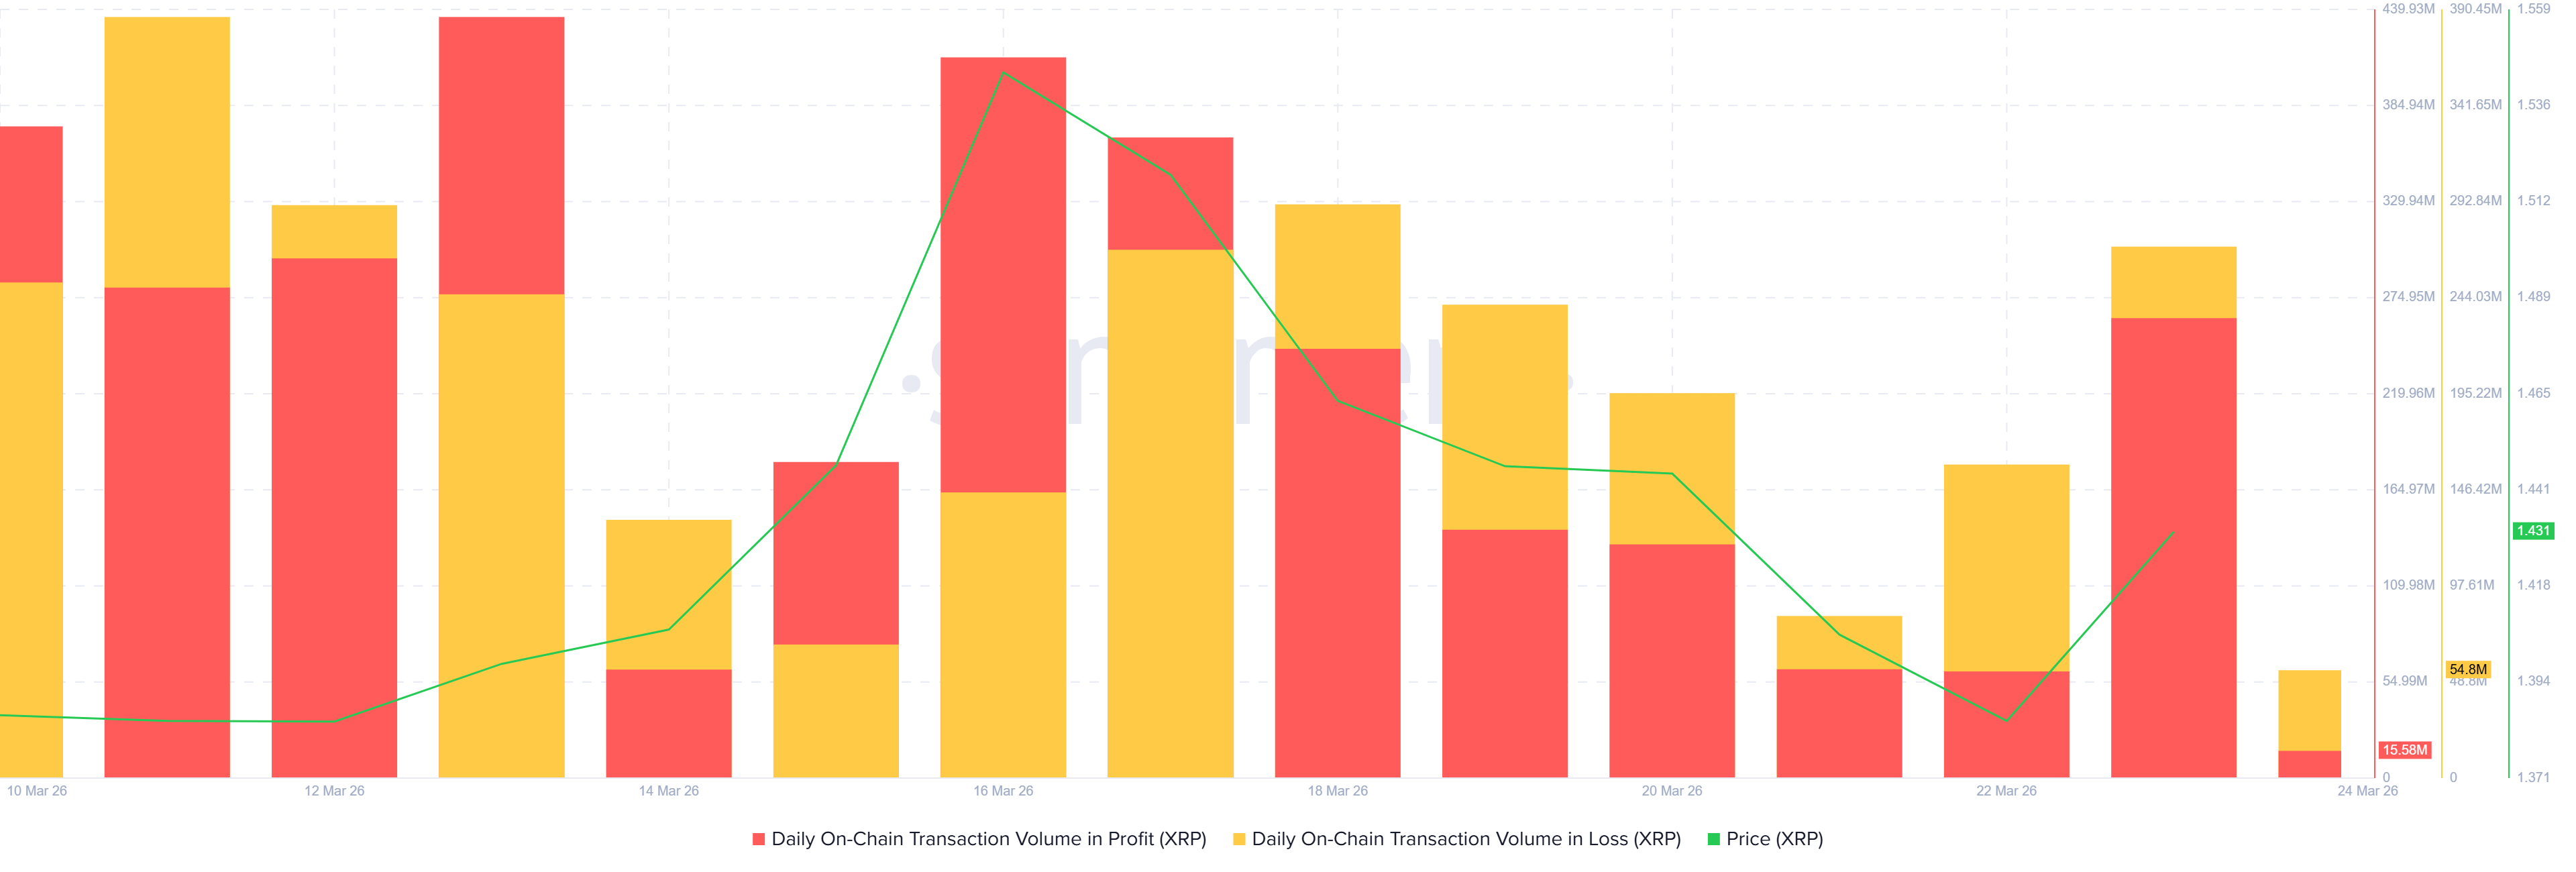
This fading activity, combined with the rising NVT, reinforces the picture of a market where price is holding up but network participation is retreating.
XRP Price Faces a Barrier
The daily chart shows XRP sitting between the Fibonacci 0.382 level at $1.33 and the 0.618 level at $1.46. The EMA at $1.42 sits just above the current price and is curling lower, acting as dynamic resistance.
The cost basis distribution heatmap from Glassnode reveals the most critical obstacle. Dense warm-colored supply bands — representing 1 billion XRP — are concentrated between $1.57 and $1.59. These holders acquired their tokens at those prices and are currently sitting at a loss. As the price recovers toward that zone, break-even selling pressure intensifies.
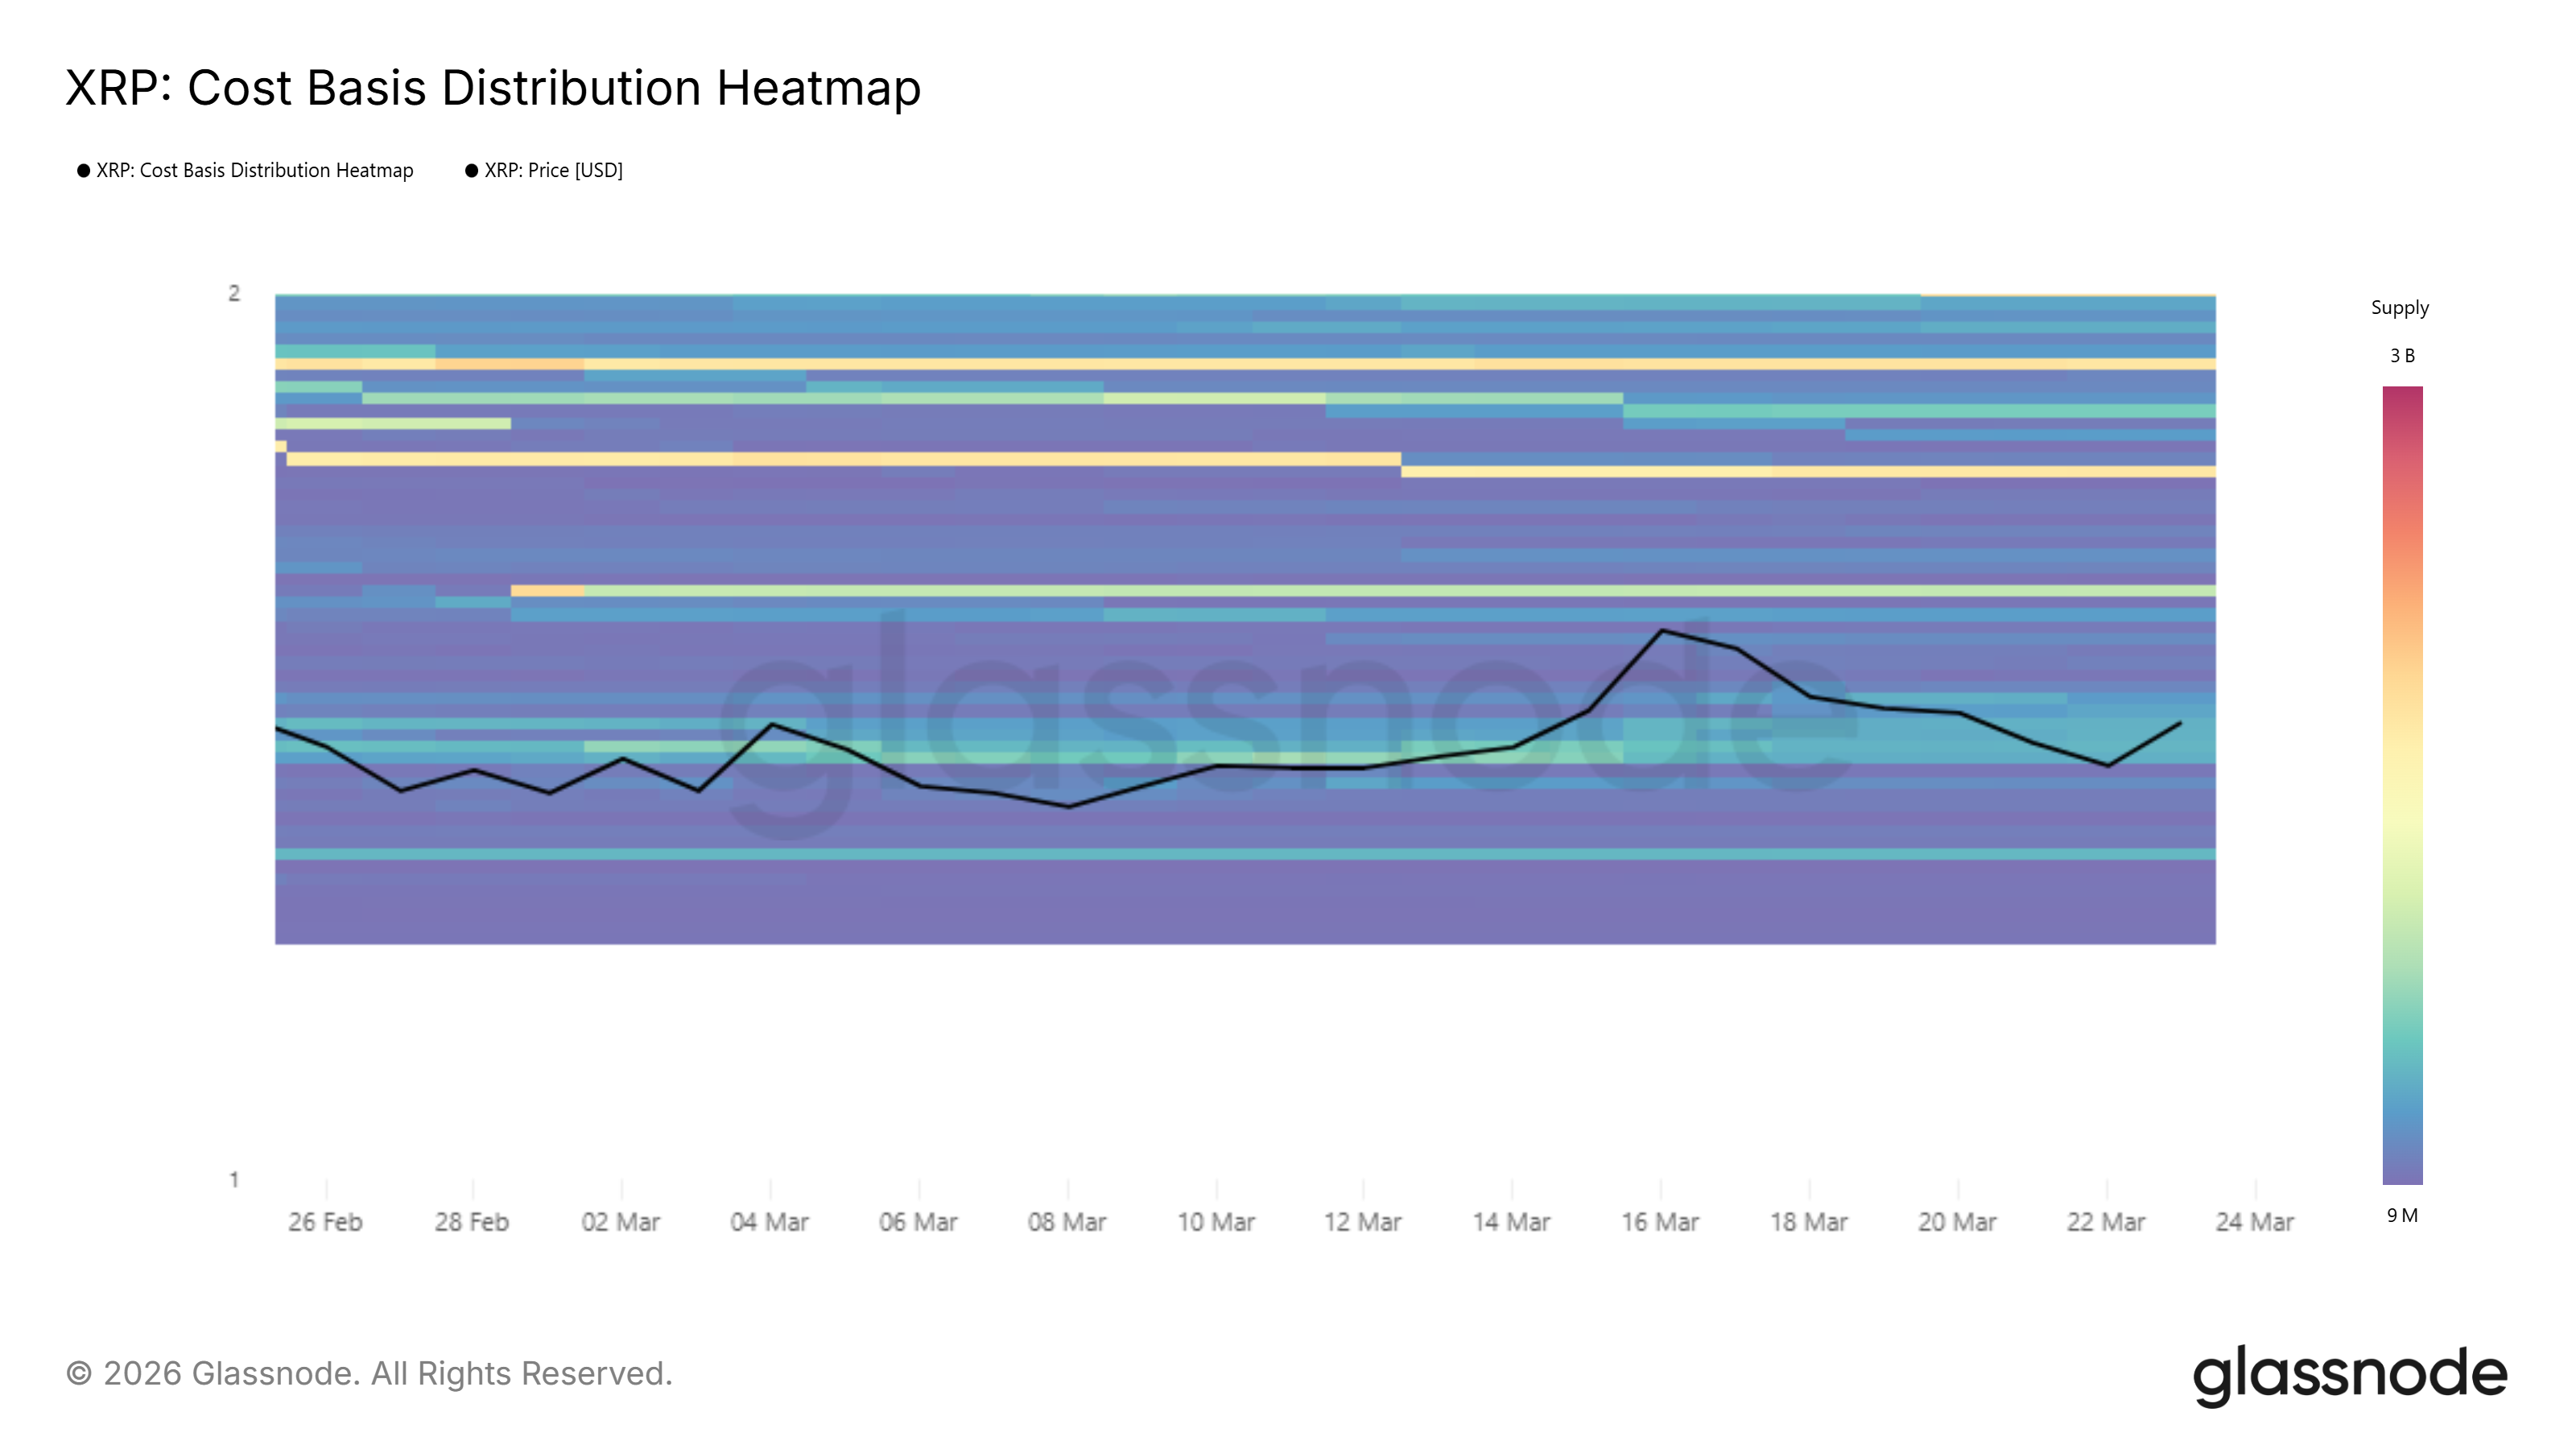
The 0.786 Fibonacci level at $1.55 aligns directly with the bottom edge of this supply cluster. A daily close above this level, through the EMA, would begin testing that wall. Without high volume to absorb the overhead supply, the recovery is likely to stall there.
At the same time, the $1.33 Fibonacci 0.382 level is the floor to hold on to any further decline. If this support is broken through, the XRP price could face a drop to $1.25 support.
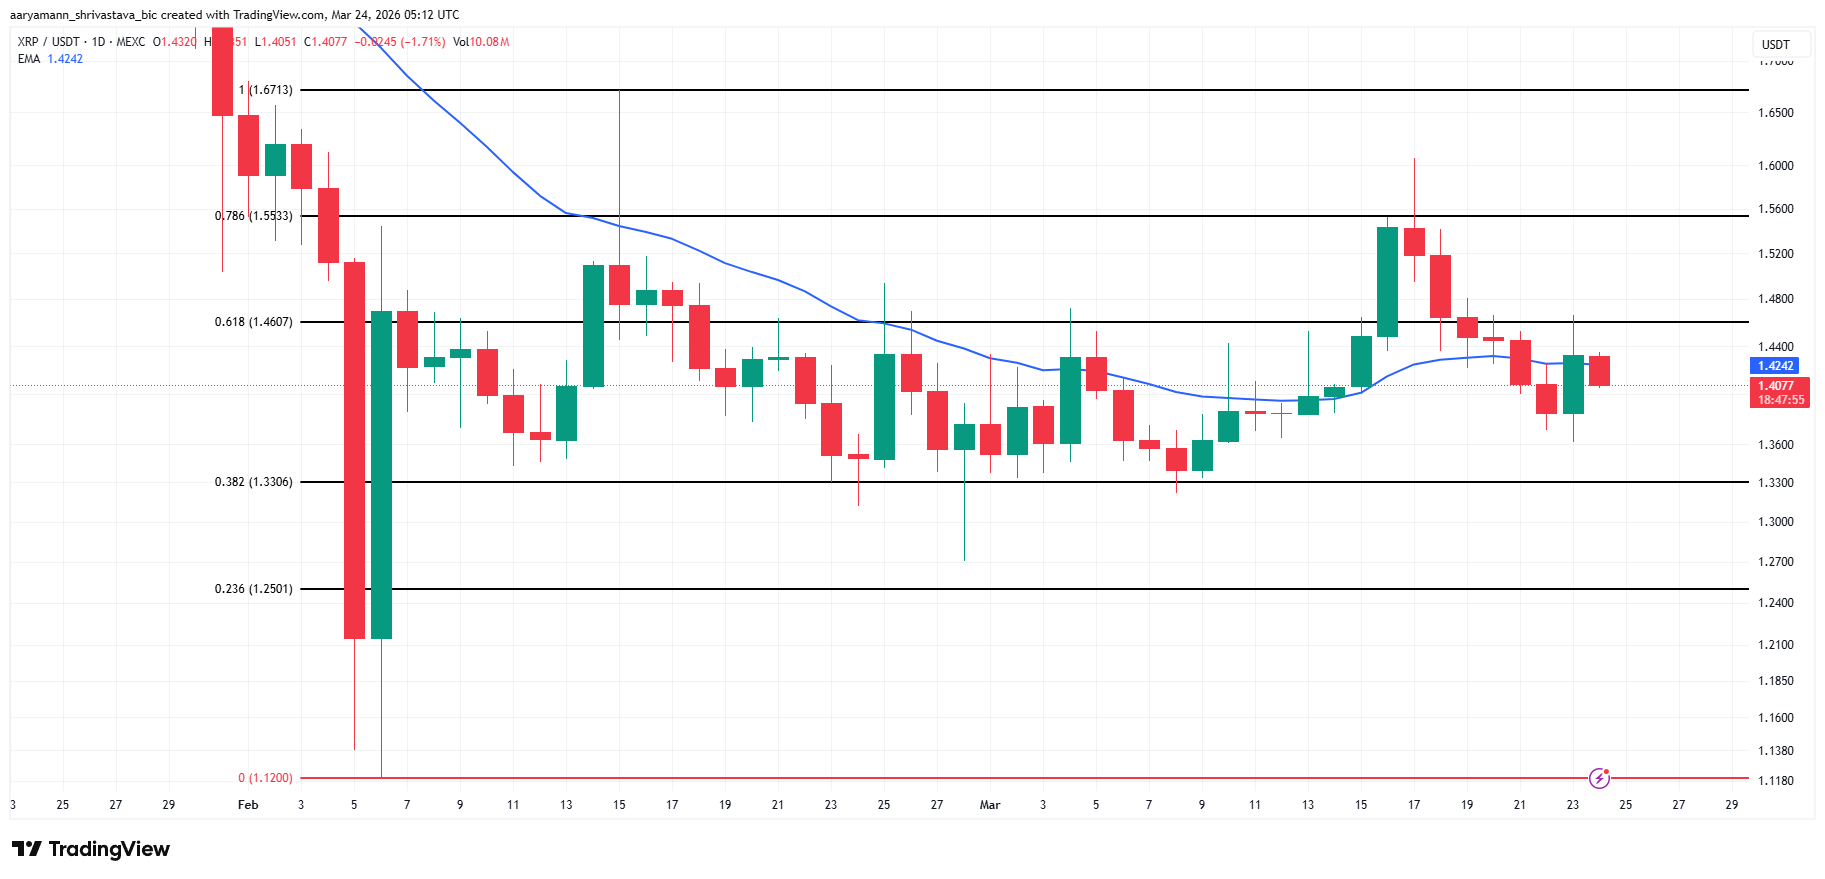
However, if the supply is absorbed, XRP price could secure $1.55 as support and move towards $1.67 resistance, which marks the February high. Reaching it would invalidate the bearish thesis and recover February losses.
