


On Apr 24, 2019, XRP reached a high close to $0.329 and €0.288. A sharp drop ensued. The price made lows of $0.276 and €0.252 on Apr 26.
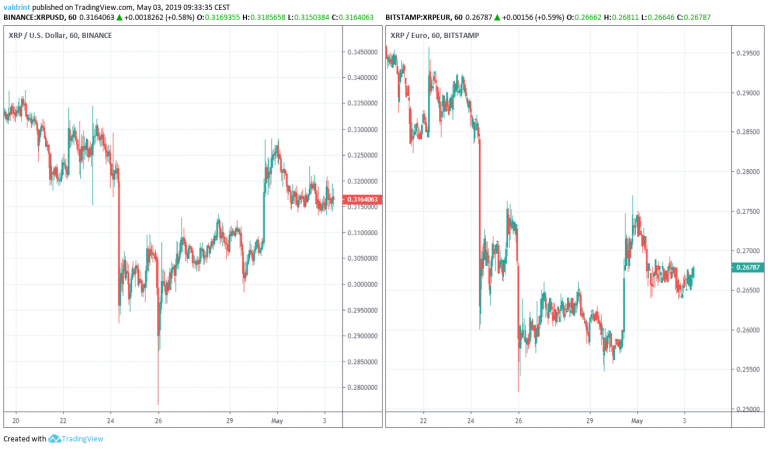
An increase ensued and the price reached highs close to $0.33 and €0.28 on Apr 30. It has been decreasing since.
Will a rebound lead to a successful recovery or will XRP drop further?
Let’s find out!
XRP (XRP): Highlights and Trends For May 3, 2019
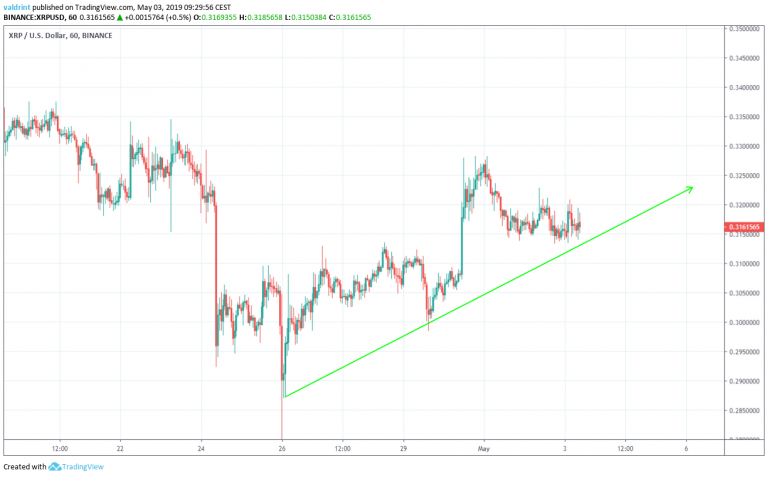
- The price of XRP has been on an uptrend since Apr 26.
- It is trading inside a symmetrical triangle.
- Bullish divergence is developing in the RSI and the MACD.
- There is resistance near $0.335 and €0.285.
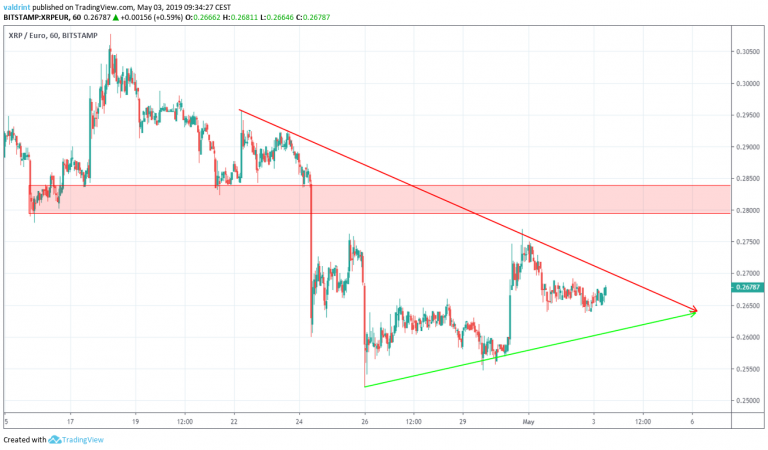
Symmetrical Triangle
On Apr 26, the price reached a low of $0.276. Several market cycles were subsequently completed. The price has created higher lows each time.
Tracing these lows gives us an ascending support line:
On Apr 20, the price made a high of $0.337. It has been gradually decreasing since, creating several lower highs.
Tracing these highs gives us a descending resistance line.
The resistance and support lines combine to create a symmetrical triangle:
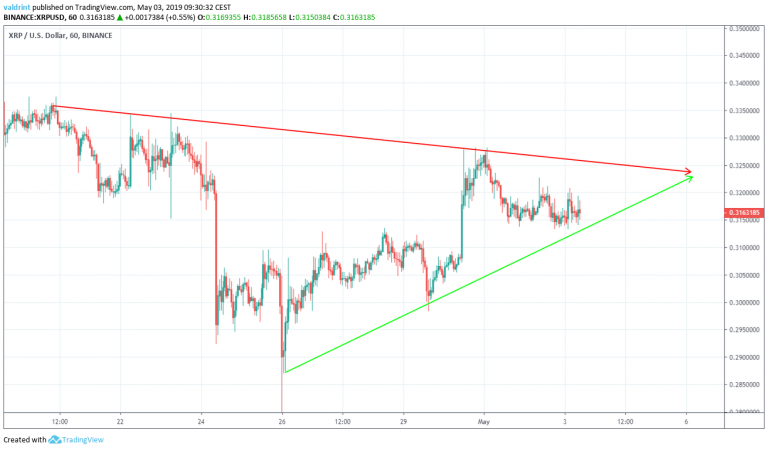
It is likely that the price will continue to trade inside the confines of the triangle until a decisive move occurs. In order to predict the direction of the move, a look at technical indicators is required.
Technical Indicators
In this section, the price of XRP/USD is analyzed alongside the RSI and the MACD.
The relative strength index (RSI) is an indicator which calculates the size of the changes in price in order to determine oversold or overbought conditions in the market.
These are traced in the graph below:
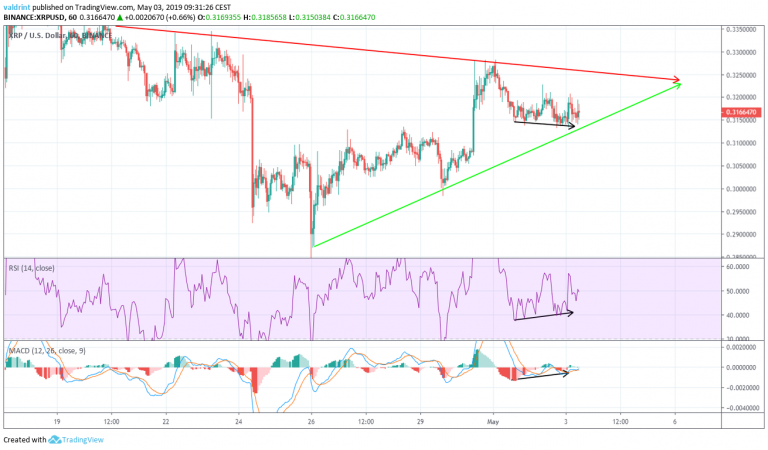
On May 1, the price made a low of $0.314. It continued to make a lower low of $0.312 on May 3.
Similarly, the RSI and the MACD made the first low on May 1. However, they have continued to generate higher values since. This is known as bullish divergence and often precedes price increases.
These indicators suggest that the price will increase towards the resistance line. A breakout is possible.
We now incorporate resistance areas into our analysis to better determine future price fluctuations following a breakout.
Future Movement
One resistance area is traced below for Ripple in both dollars and euros in the graphs below:

The closest resistance area is found near $0.335 and €0.285. If the price breaks out from the triangle, it is likely to land here.
Summary of Analysis
Based on this analysis, XRP is likely to increase towards the resistance line of the triangle and eventually break out.
For price 2019, 2020, and five-year Ripple price predictions click on the blue button below:
Disclaimer: This article is not trading advice and should not be construed as such. Always consult a trained financial professional before investing in cryptocurrencies, as the market is particularly volatile.


