
On Mar 6, 2019, the price of XRP (XRP) reached a high around $0.325. A gradual downtrend followed. Currently, prices continue to decrease at a steady rate with the possibility of a reversal in store.
In our Mar 12, XRP analysis, we predicted that the price would continue to decrease and possibly breakdown below its support. While the price has not yet broken down, it continues to decrease at the same rate as we predicted.
At the time of writing, XRP’s price is very close to the resistance line—signifying that a breakout remains possible and may be forthcoming in the near future. In such a case, we predict a reversal which will lead to price increases in the near future. Until then, the price will continue to likely decline at the current rate of loss.
To understand how we made this prediction, continue reading our detailed price analysis for Mar 13, 2019, below:
Key Highlights For March 13, 2019
- The price of XRP (XRP) has been on a downtrend since Mar 9.
- The price is trading inside a parallel descending channel.
- There is bullish divergence developing in the MACD and the RSI.
- There are resistance areas near $0.345 and $0.33.
- There is support near $0.304.
Descending Resistance
The price of XRP on Binance is analyzed at 30-minute intervals from Mar 9 to Mar 13. The price reached a high of $0.325 on Mar 9. It has made lower highs since. Tracing these highs gives us a descending resistance line.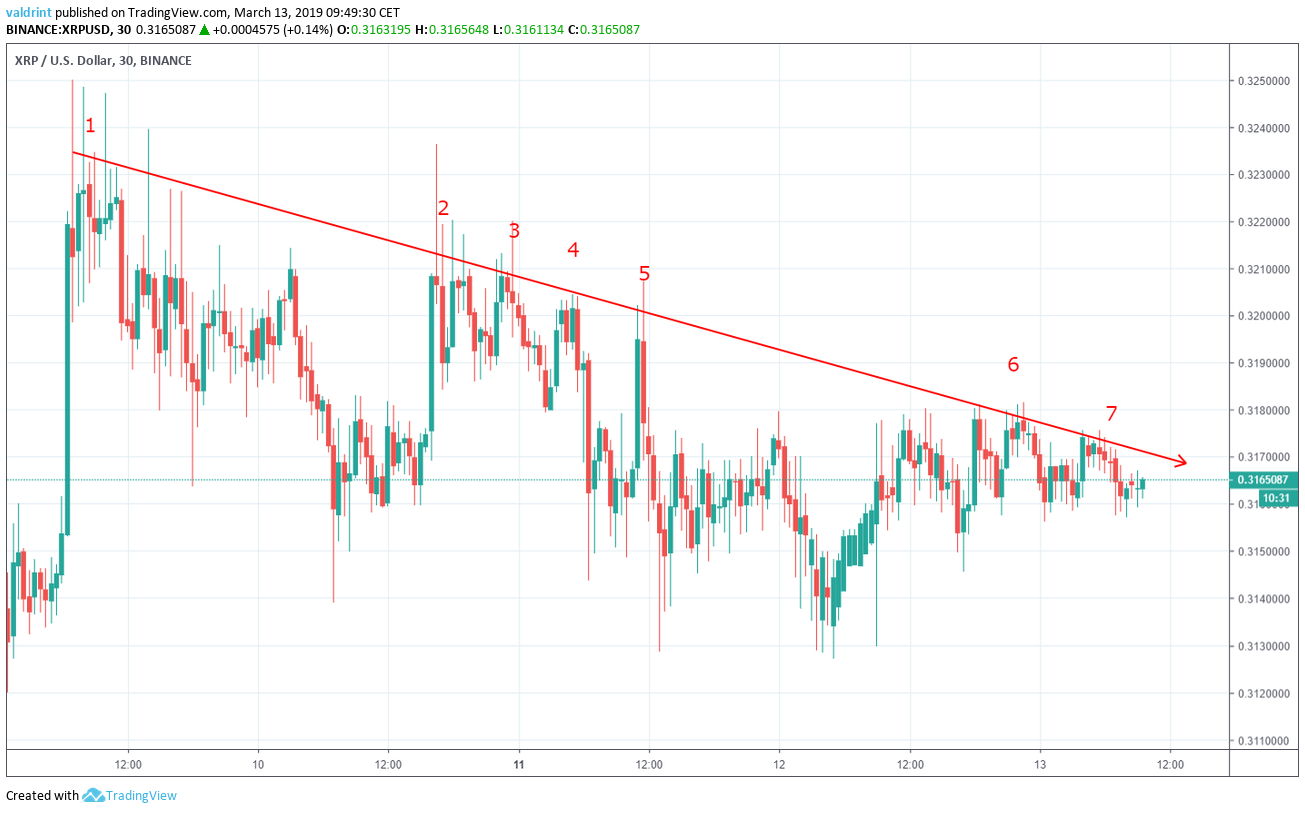 The resistance line effectively acts as a ceiling to price—theoritically preventing further upward movement. It also helps project future trends.
Highs above the resistance can be considered insignificant unless they are succeeded by sustained movement above the line. Thus, the highs above the resistance on Mar 9, 10, and 11 can be considered insignificant. After the highs were reached, the price immediately dropped below the line.
The current downtrend may be a market response to the rapid price increase on Mar 9. The resistance alone is not sufficient in predicting how long the downtrend will last or when it will end.
The resistance line effectively acts as a ceiling to price—theoritically preventing further upward movement. It also helps project future trends.
Highs above the resistance can be considered insignificant unless they are succeeded by sustained movement above the line. Thus, the highs above the resistance on Mar 9, 10, and 11 can be considered insignificant. After the highs were reached, the price immediately dropped below the line.
The current downtrend may be a market response to the rapid price increase on Mar 9. The resistance alone is not sufficient in predicting how long the downtrend will last or when it will end.
Parallel Channel
The price reached a low of $0.316 on Mar 9. It has made lower lows since. Tracing these lows gives us a descending support line.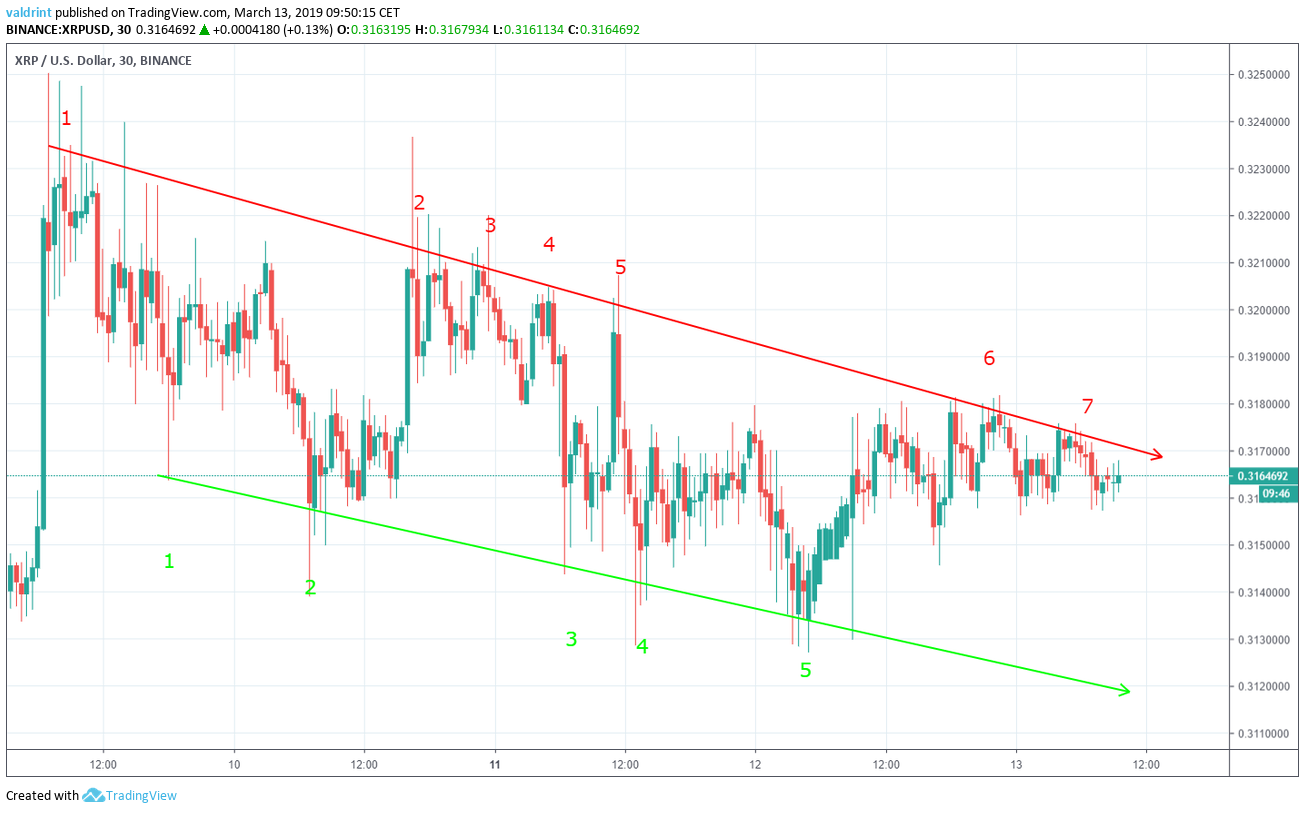 The resistance and support lines create a descending channel. Using this channel better predicts price fluctuations than resistance or support alone. Because the channel is moving downward, price decreases will likely continue into the future.
Furthermore, a rise occurred on Mar 10 which brought price near the resistance. On Mar 11, a drop brought XRP back toward the support. A subsequent rise—similar to that which occurred on Mar 10—occurred on Mar 12 bringing the price to its current levels.
If this pattern proves to be a reliable predictor of price, the overall downward trend should continue as the price fluctuates between the resistance and support on one to two-day cycles. As this occurs, movement between the resistance and support lines should continue.
To confirm this pattern, a drop should follow on Mar 13 or 14 with a rise occurring one or two days later without significant fluctuations outside of the channel.
The resistance and support lines create a descending channel. Using this channel better predicts price fluctuations than resistance or support alone. Because the channel is moving downward, price decreases will likely continue into the future.
Furthermore, a rise occurred on Mar 10 which brought price near the resistance. On Mar 11, a drop brought XRP back toward the support. A subsequent rise—similar to that which occurred on Mar 10—occurred on Mar 12 bringing the price to its current levels.
If this pattern proves to be a reliable predictor of price, the overall downward trend should continue as the price fluctuates between the resistance and support on one to two-day cycles. As this occurs, movement between the resistance and support lines should continue.
To confirm this pattern, a drop should follow on Mar 13 or 14 with a rise occurring one or two days later without significant fluctuations outside of the channel.
Looking Out For a Reversal
Combining moving average convergence divergence (MACD) and relative strength index (RSI) bullish/bearish divergence with support/resistance essentially predicts price fluctuations. MACD is a trend indicator that shows the relationship between two moving averages (long and short-term) and the price. It is used to measure the strength of a move. RSI is an indicator which calculates the size of the changes in price in order to determine oversold or overbought conditions in the market.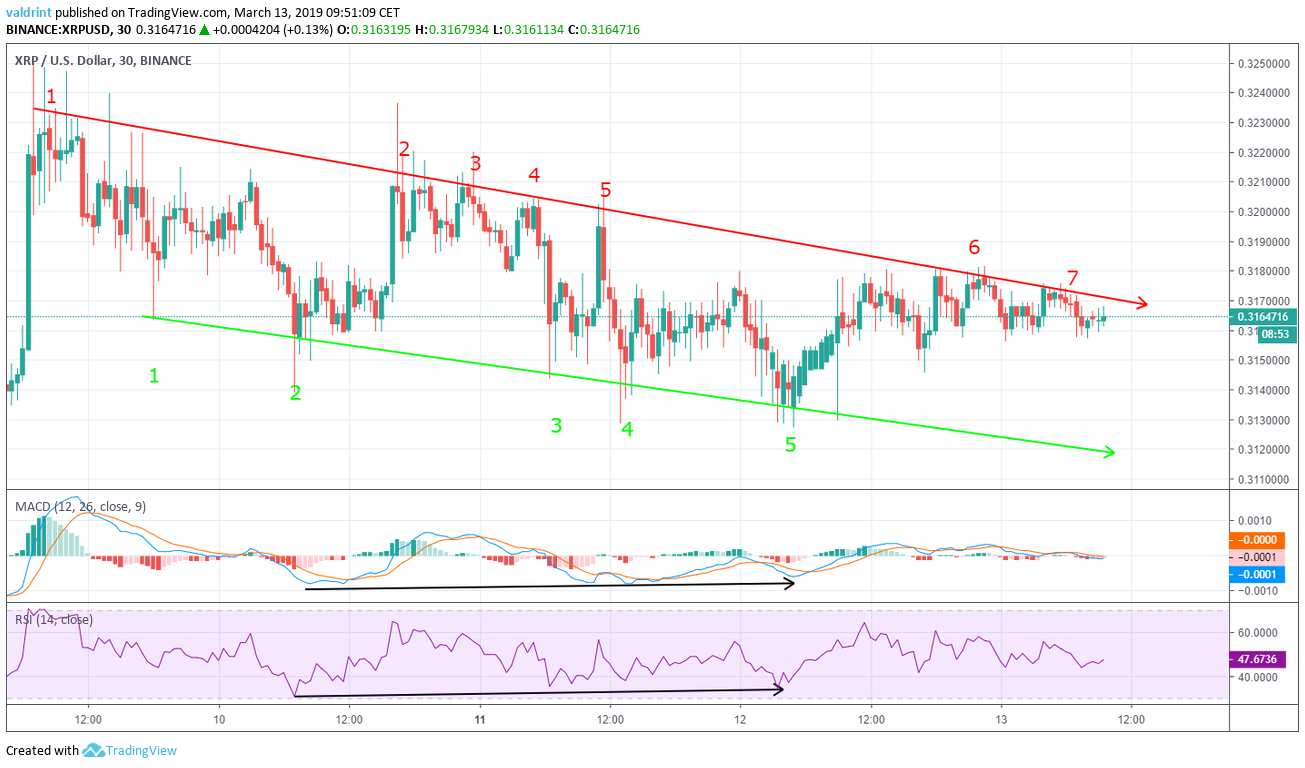 On Mar 10, the price made a low of $0.314. Lower lows followed until Mar 12.
Similarly, the MACD and RSI made the first low on Mar 10. However, during the same period, they proceeded to make higher lows. This is called bullish divergence and often succeeds increases in price. In the case of XRP, the level of divergence is not very significant and a partial recovery has already ensued.
Using these indicators, it is unlikely that the price of XRP breaks out of the support. On the contrary, a drop in price within the channel is likely as part of the pattern discussed in the previous section.
On Mar 10, the price made a low of $0.314. Lower lows followed until Mar 12.
Similarly, the MACD and RSI made the first low on Mar 10. However, during the same period, they proceeded to make higher lows. This is called bullish divergence and often succeeds increases in price. In the case of XRP, the level of divergence is not very significant and a partial recovery has already ensued.
Using these indicators, it is unlikely that the price of XRP breaks out of the support. On the contrary, a drop in price within the channel is likely as part of the pattern discussed in the previous section.
Resistance and Support
The price of XRP on Binance is analyzed at two-hour intervals from Feb 24 to Mar 11 to better visualize future possible resistance and support levels.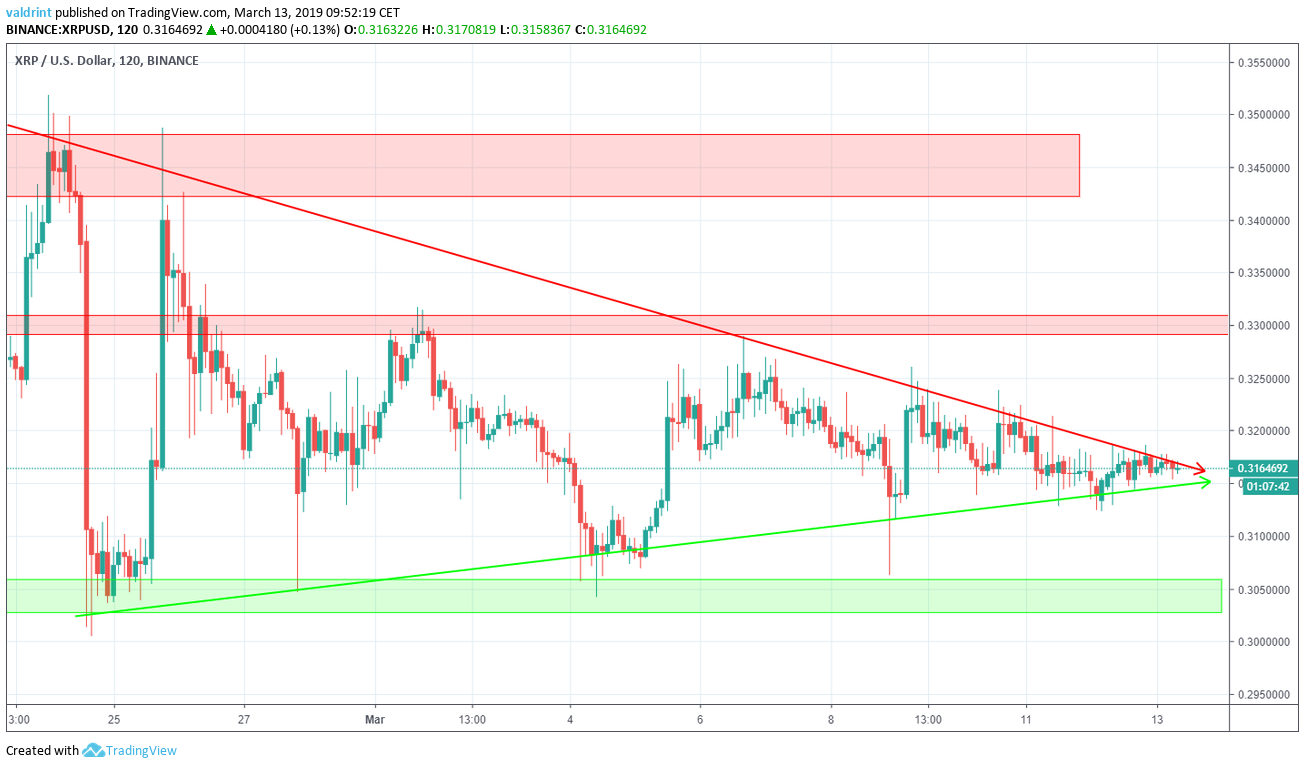 There are two visible resistance areas, near $0.33 and $0.345 respectively. This means that in the case of a breakout, they would provide likely reversal areas.
The closest support area is found near $0.304. If a breakdown occurs, this is a likely reversal area.
We can also see that the price is close to the convergence point of the resistance and support lines. Therefore, a rapid upward/downward movement is to be expected in the near future.
There are two visible resistance areas, near $0.33 and $0.345 respectively. This means that in the case of a breakout, they would provide likely reversal areas.
The closest support area is found near $0.304. If a breakdown occurs, this is a likely reversal area.
We can also see that the price is close to the convergence point of the resistance and support lines. Therefore, a rapid upward/downward movement is to be expected in the near future.
Summary of Analysis
Based on this analysis, the price of XRP is likely to keep trading inside the channel. Because the price is on a current downward trend, price decreases at the rate predicted by the channel are to be expected in the future. Breakdowns and breakouts remain possible, but neither is expected. Price increases and decreases within the channel, however, would help to confirm what appears to be a developing pattern. If price continues trading inside the channel, the prediction will be partially validated while a price decrease followed by a price increase within the channel over the next several days would fully validate the prediction. Do you think that a pattern is developing within this channel? Let us know your thoughts in the comments below. Disclaimer: This article is not trading advice and should not be construed as such. Always consult a trained financial professional before investing in cryptocurrencies, as the market is particularly volatile.Disclaimer
In line with the Trust Project guidelines, this price analysis article is for informational purposes only and should not be considered financial or investment advice. BeInCrypto is committed to accurate, unbiased reporting, but market conditions are subject to change without notice. Always conduct your own research and consult with a professional before making any financial decisions. Please note that our Terms and Conditions, Privacy Policy, and Disclaimers have been updated.

Valdrin Tahiri
Valdrin discovered cryptocurrencies while he was getting his MSc in Financial Markets from the Barcelona School of Economics. Shortly after graduating, he began writing for several different cryptocurrency related websites as a freelancer before eventually taking on the role of BeInCrypto's Senior Analyst.
(I do not have a discord and will not contact you first there. Beware of scammers)
READ FULL BIO
Sponsored
Sponsored