


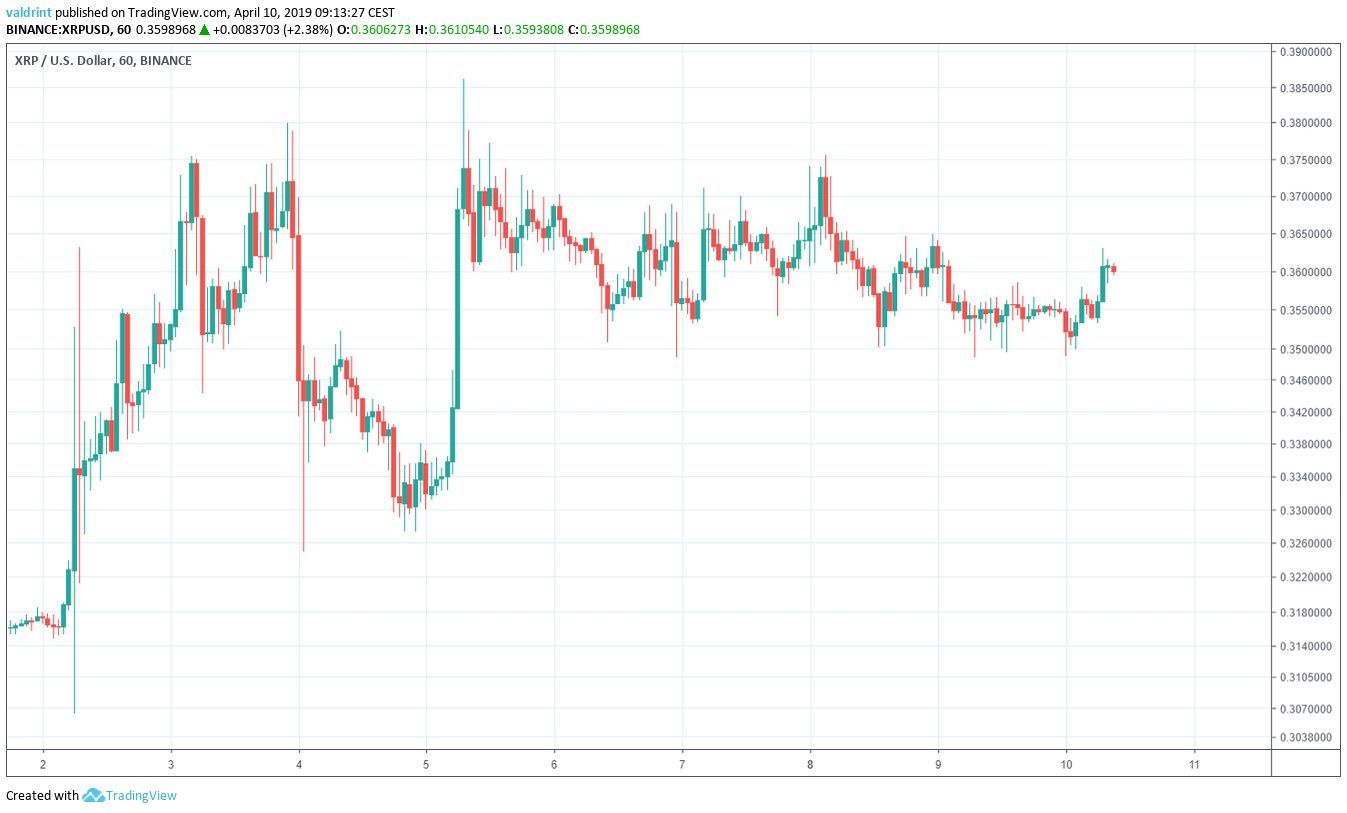
On Apr 2, XRP initiated a rapid move which took it to a high of nearly $0.38. A rapid decrease followed. Prices dropped to under $0.32 by Apr 3.
A second spike occurred on April 5. XRP breached the $0.38 mark with a high around $0.386.
Prices have gradually dropped to around $0.35 at the time this technical analysis was performed.
Will a third spike bring XRP past the psychological barrier or $0.4 or will price keep dropping?
Let’s find out:
XRP (XRP): Highlights and Trends For April 10, 2019
- The price of XRP/USD has been on an uptrend since Apr 2.
- XRP is trading inside an ascending triangle.
- Bullish divergence is developing in the RSI and the MACD.
- There is resistance near $0.4.
Ascending Triangle
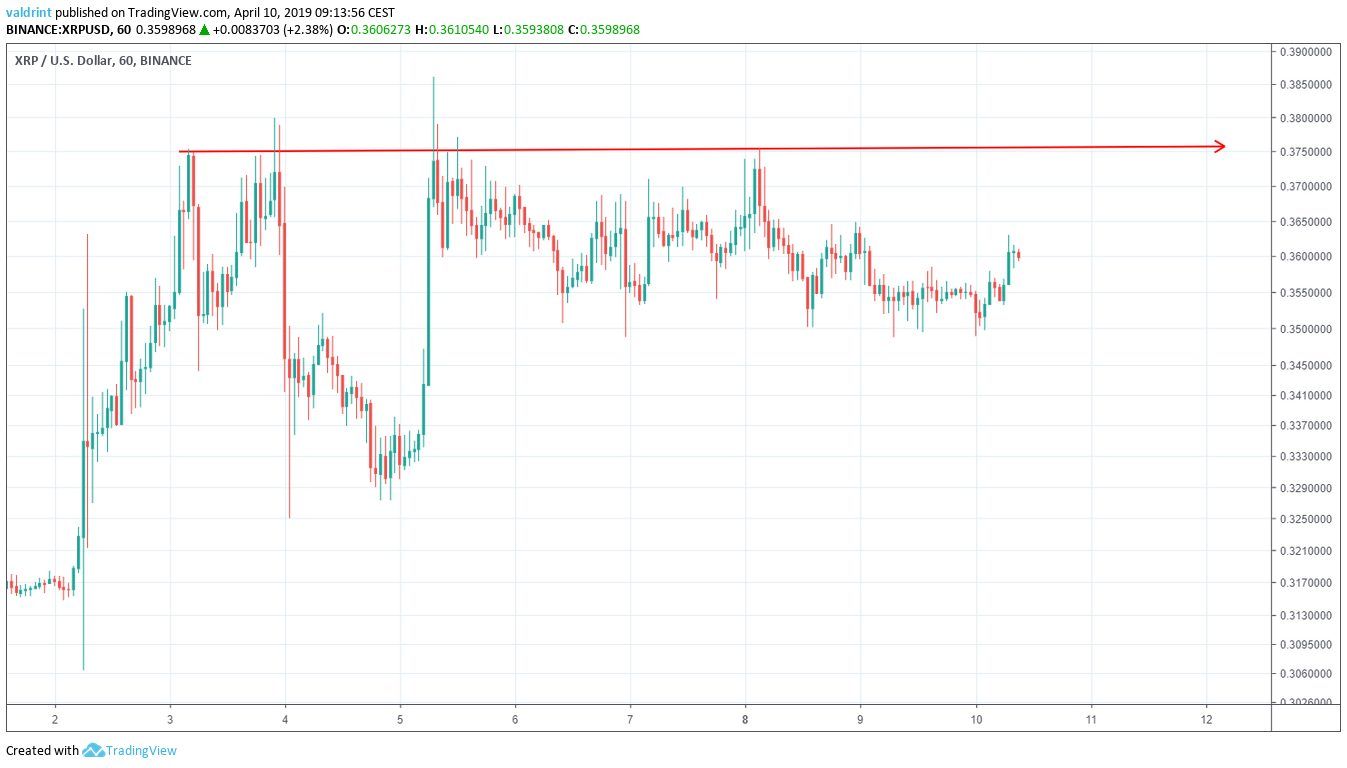
On Apr 3, the price reached a high of $0.375. Several market cycles have been completed and the price has reached the same level several times.
Tracing these highs gives us a horizontal resistance line:
On Apr 2, the price reached an hourly low of $0.327. A gradual increase ensued, followed by a rapid decrease. Several market cycles have been completed, with the price making higher lows.
Tracing these lows gives us an ascending support line.
The resistance and support lines combine to create an ascending triangle:
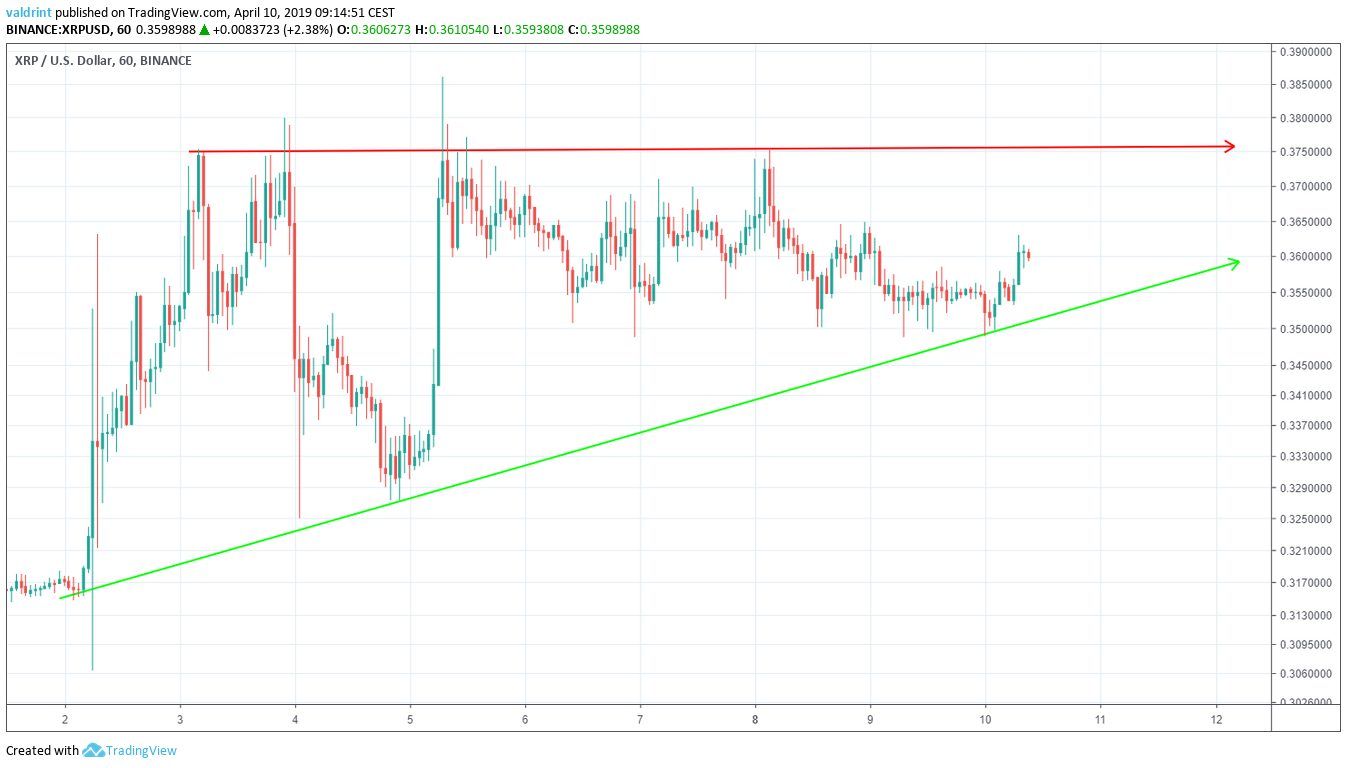
This is a bullish pattern. Price breakouts above resistance are more likely than price breakdowns below support.
The trading pattern alone cannot determine if a breakout will occur. To assess this possibility, we need to take a look at some technical indicators.
Technical Indicators
To determine possible future price fluctuations, we incorporate the MACD and the RSI into the analysis.
Combining MACD and RSI bullish/bearish divergence with support/resistance essentially predicts price fluctuations.
Both are shown in the graph below alongside XRP’s current trading pattern:
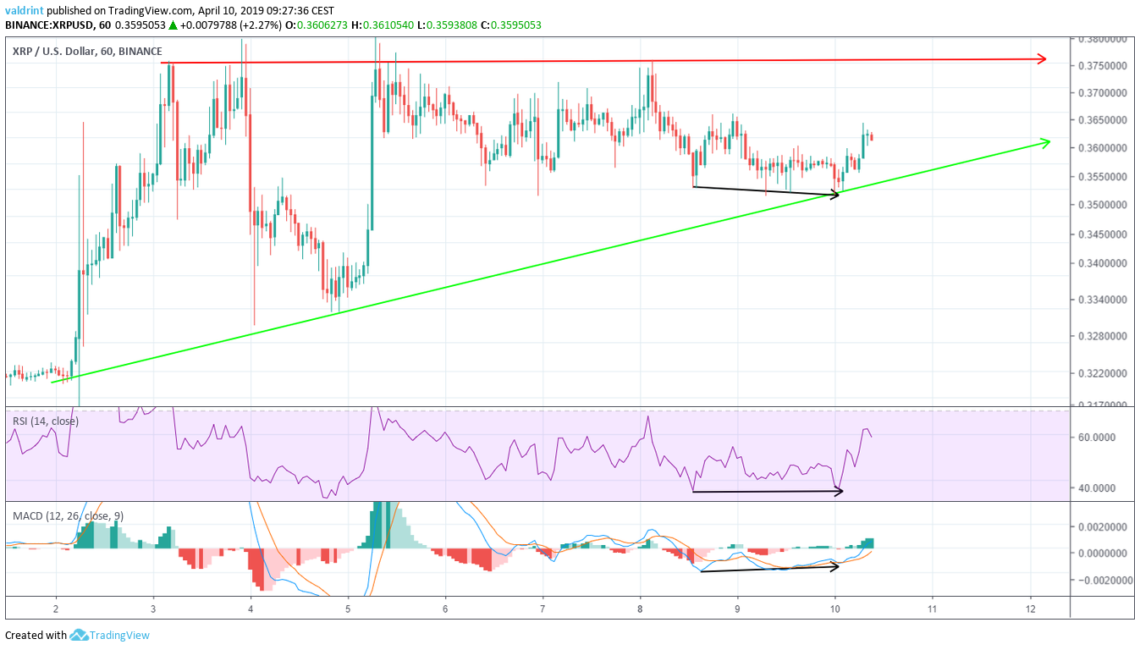
On Apr 8, the price reached a low of $0.350. It reached another low of $0.348 on Apr 10.
Similarly, the RSI and the MACD made the first low on Apr 8. However, they have proceeded to generate higher values.
This is known as bullish divergence and often precedes price increases.
The level of divergence is not very significant. However, it is occurring in both indicators at a period when XRP is nearing the support line of a bullish pattern.
Therefore, we believe that the price will move towards the resistance line of the triangle. However, we cannot confidently predict whether a breakout will occur.
Where Might XRP’s Price Land?
To determine the actual possible future price levels given an increase, we incorporate resistance areas into this analysis.
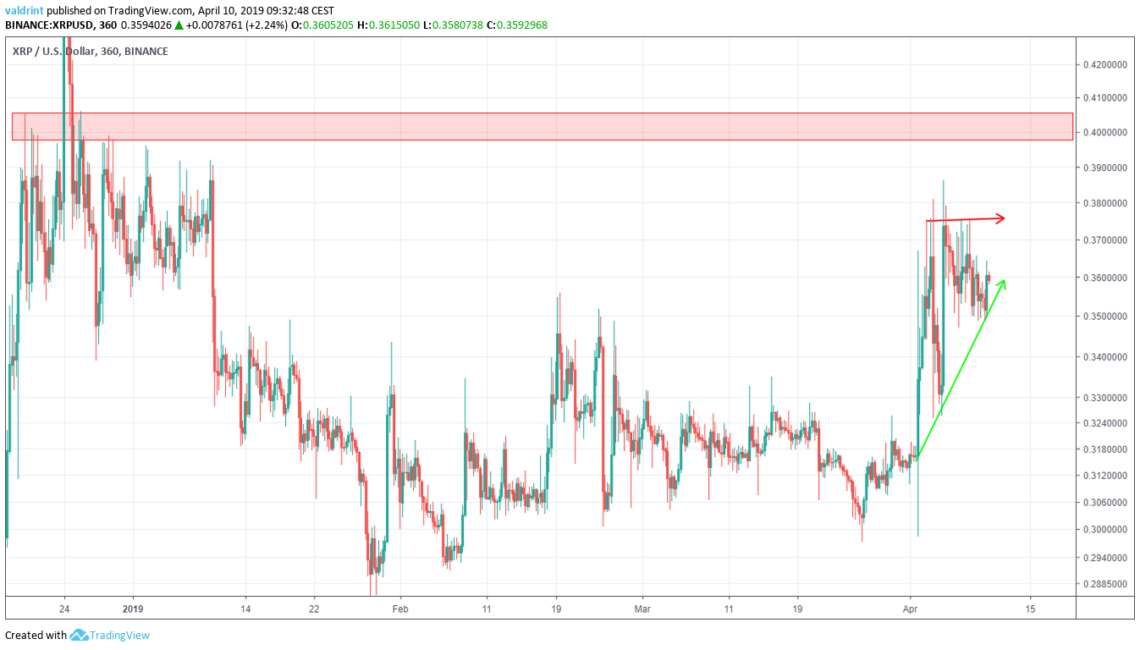
This resistance area is found near $0.4 and is formed by the highs of Dec 2018. If the price were to break out of the triangle, it is likely that it would reach this area.
Based on this analysis, the price of XRP is likely to move towards the resistance line of the triangle and possibly reach $0.4.
A breakout remains possible with prices exceeding $0.4. As stated above, we cannot confidently state if or when this will occur. Thus, we are unable to determine if XRP will rise above $0.4 or how it might go if it does.
Disclaimer: This article is not trading advice and should not be construed as such. Always consult a trained financial professional before investing in cryptocurrencies, as the market is particularly volatile.


