


While the XRP price has been decreasing since Nov. 24, it reversed its trend on Dec 16, at one point having increased by 50% in less than two days.
XRP could correct towards $0.52 and is likely to resume its upward movement afterward.
*Note – This article will mostly deal with the short-term movement that has been taking place over the past three days. For a longer-term analysis, please click here.
Reversal Leads to Breakout
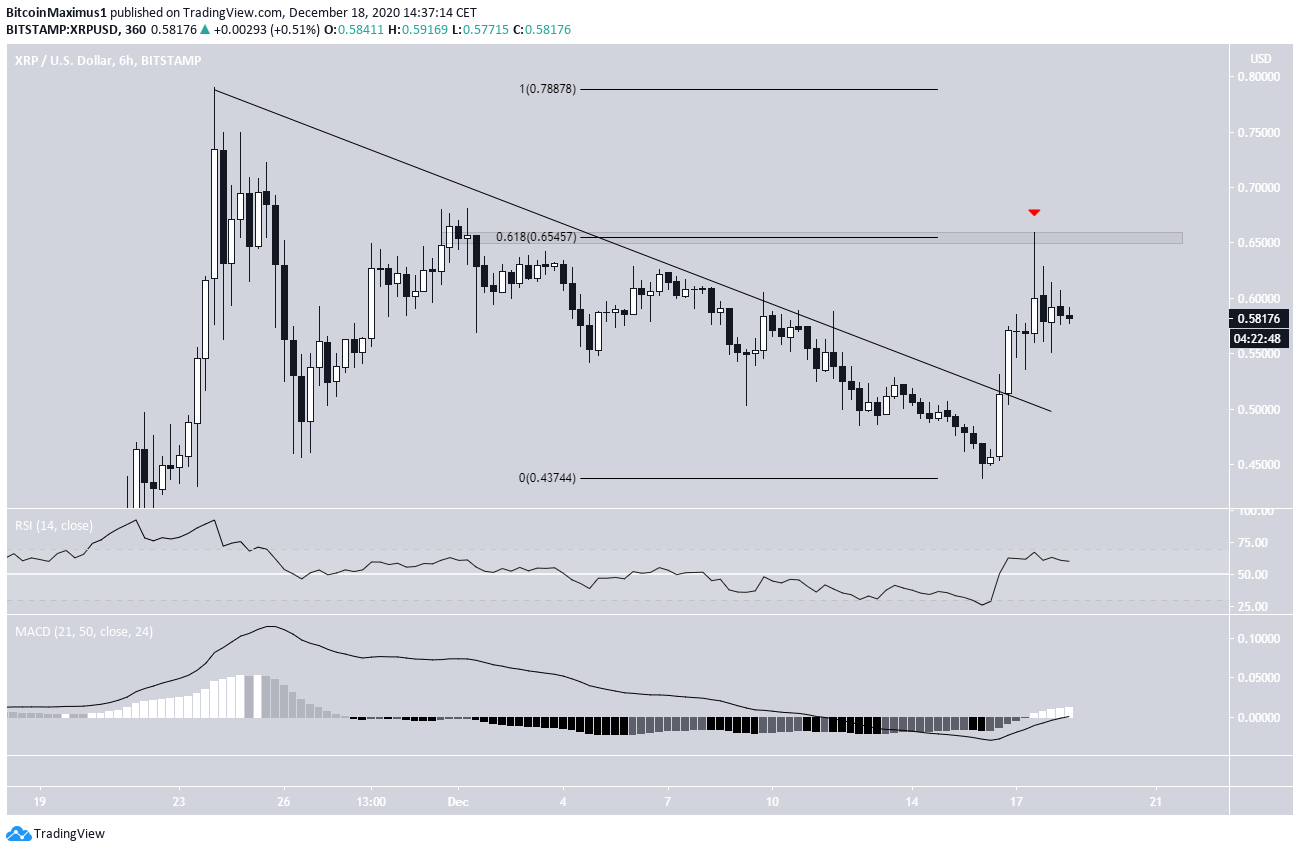
XRP has been falling since Nov. 24, when it reached a high of $0.79. The decline continued until it reached a low of $0.437 on Dec. 16. However, a rapid upward move ensued shortly afterward that took it to a high of $0.659 the following day.
This increase caused it to break out from a descending resistance line that had been in place since the previous Nov. 24 high. Nevertheless, XRP was sharply rejected by the $0.65 resistance area, the 0.618 Fib retracement level of the most recent decline.
This created a long upper wick and caused it to drop to the current price of $0.581.
Be that as it may, technical indicators are bullish, supporting the possibility that the price will eventually make another breakout attempt.
Short-Term Retracement
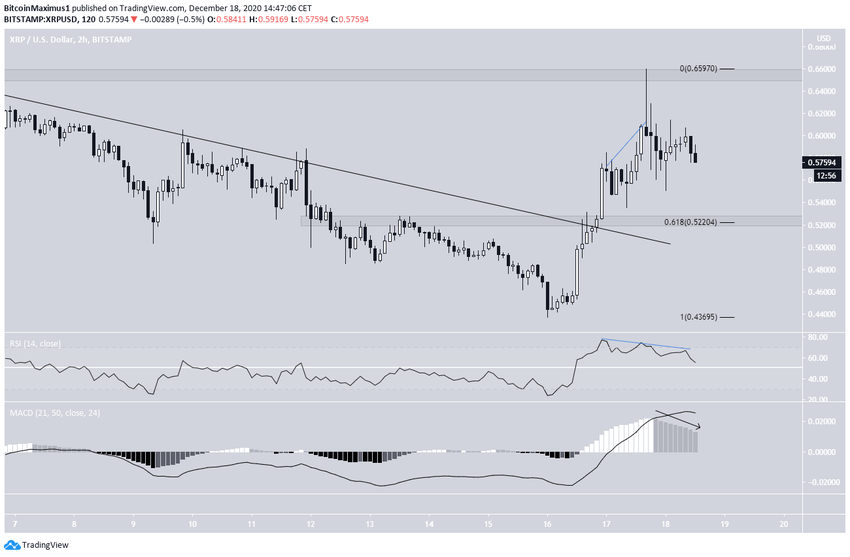
The shorter-term two-hour chart shows clear weakness in the form of bearish divergence on the RSI and a decreasing MACD. Furthermore, XRP had created a shooting star candlestick when it touched the $0.65 resistance area, a bearish reversal sign.
Therefore, it should decline towards the $0.52 minor support area, the 0.618 Fib retracement level of the entire move, before possibly resuming its upward momentum.
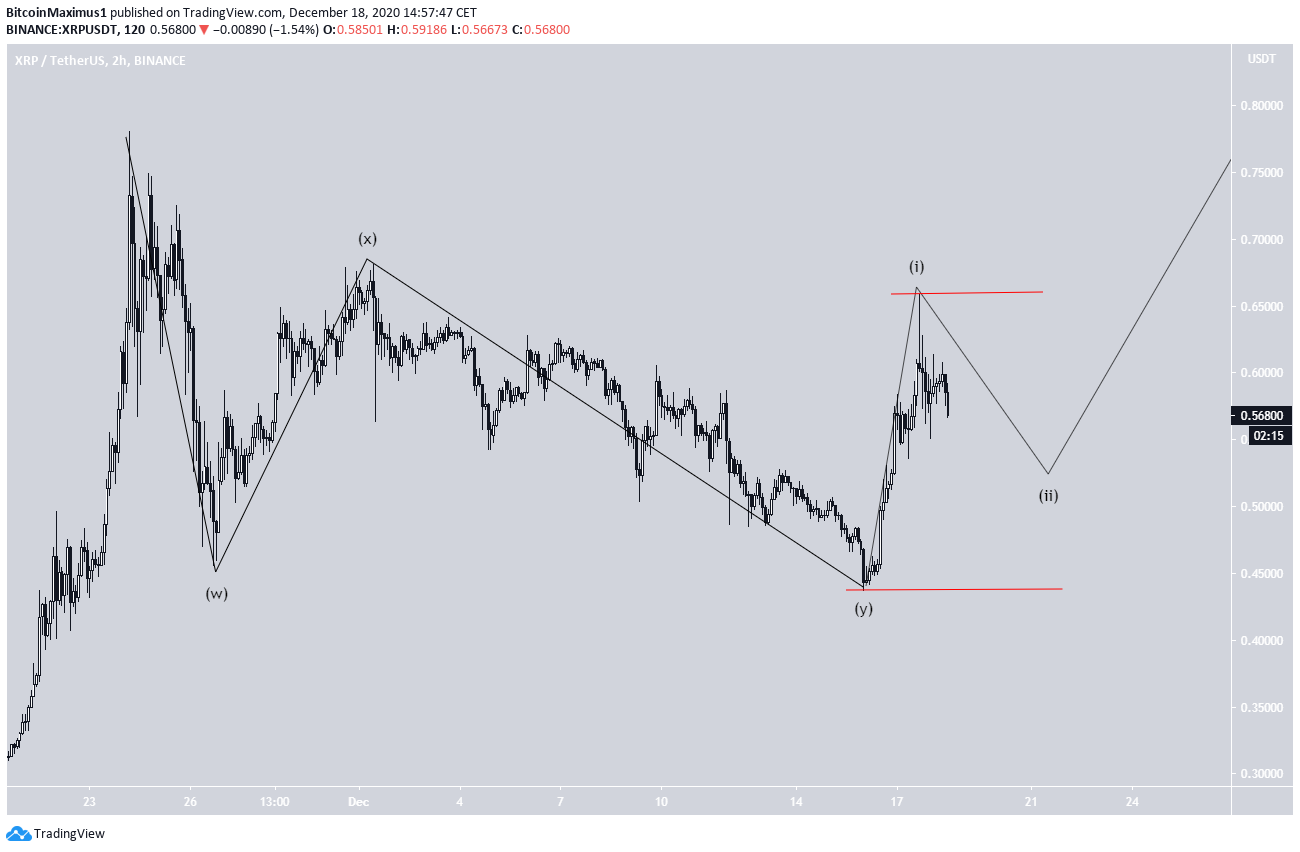
XRP’s Wave Count
Cryptocurrency trader @Thetradinghubb outlined a chart, stating that the recent movement makes him think that XRP is still correcting and will fall towards $0.35.
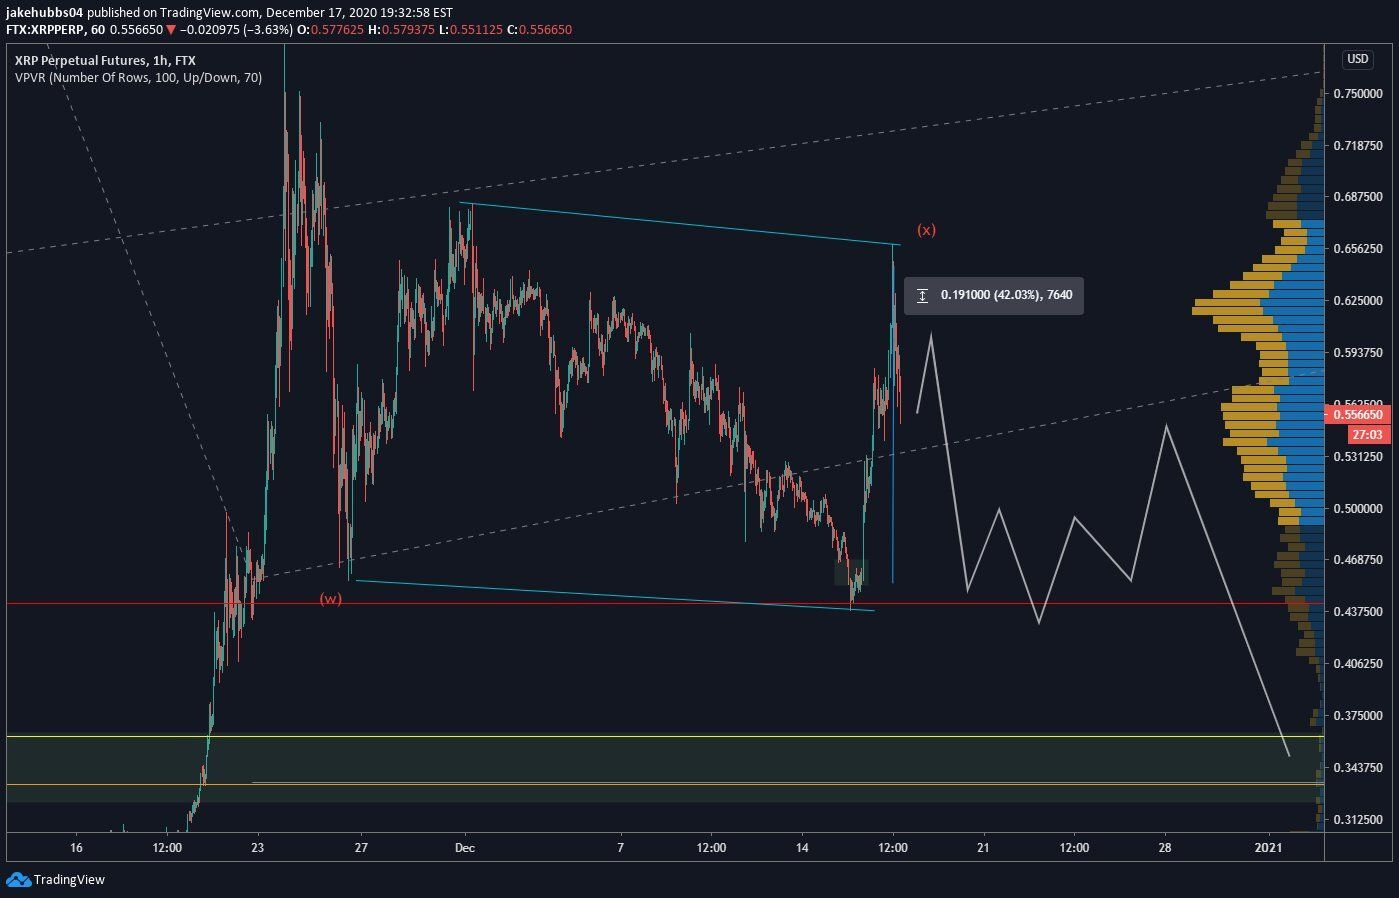
While it’s likely in a longer-term wave 4, it’s not yet certain if the correction has ended.
The possibility outlined in the tweet suggests that XRP is still correcting inside a complex W-X-Y structure, which could end at $0.33, giving the W:Y waves a 1:1 ratio.
The main reason for this count is the descending channel, which contains what is likely the X wave.
A rally above yesterday’s high at $0.659 would invalidate this possibility and suggest that XRP is going higher.
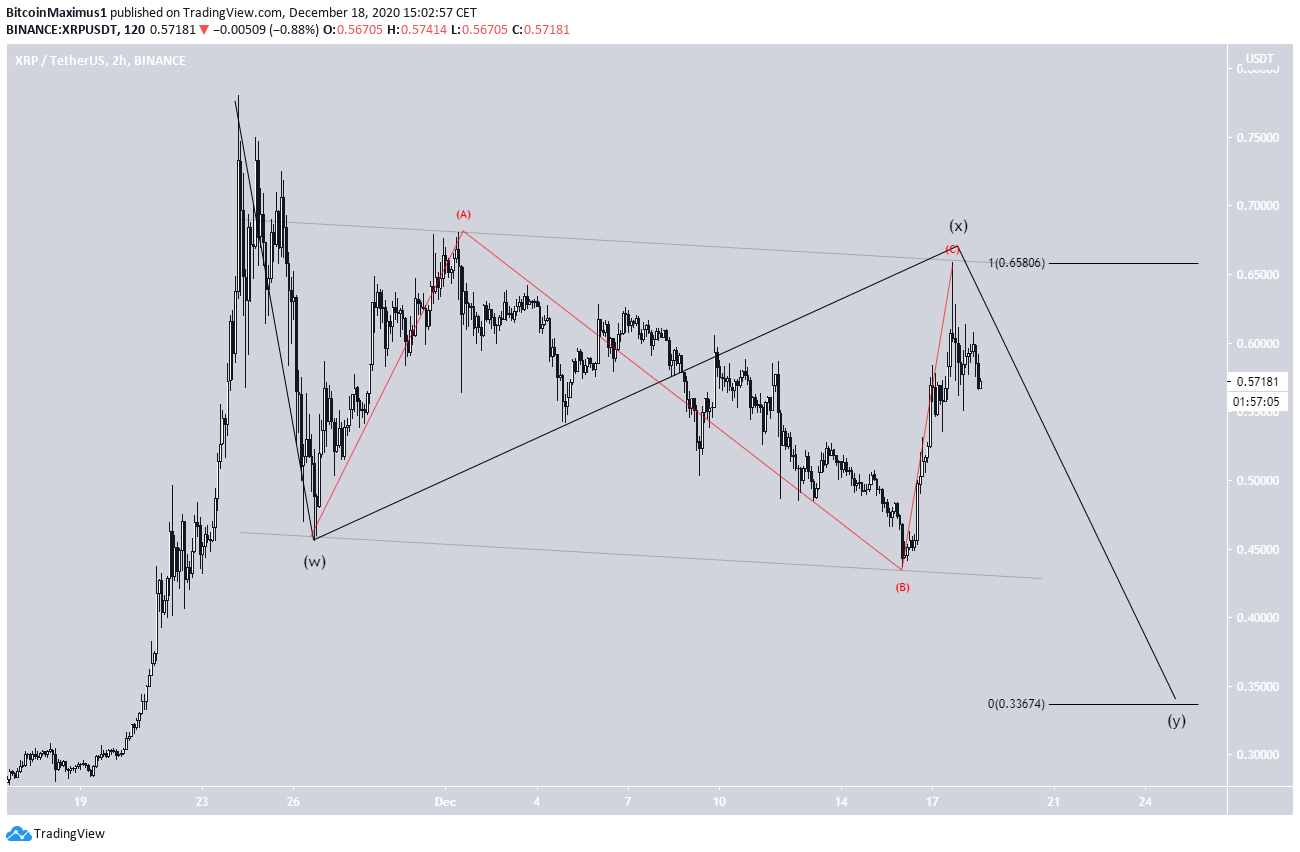
If XRP is going higher, the count would suggest that the Dec. 16 low was the end of the W-X-Y corrective structure and that it has now begun a bullish impulse.
Similarly, an increase above yesterday’s high at $0.659 would confirm this count, while a decline below the Dec. 16 low at $0.437 would invalidate it.
If this is the correct count, it would likely take XRP above $1, as outlined in our previous article.
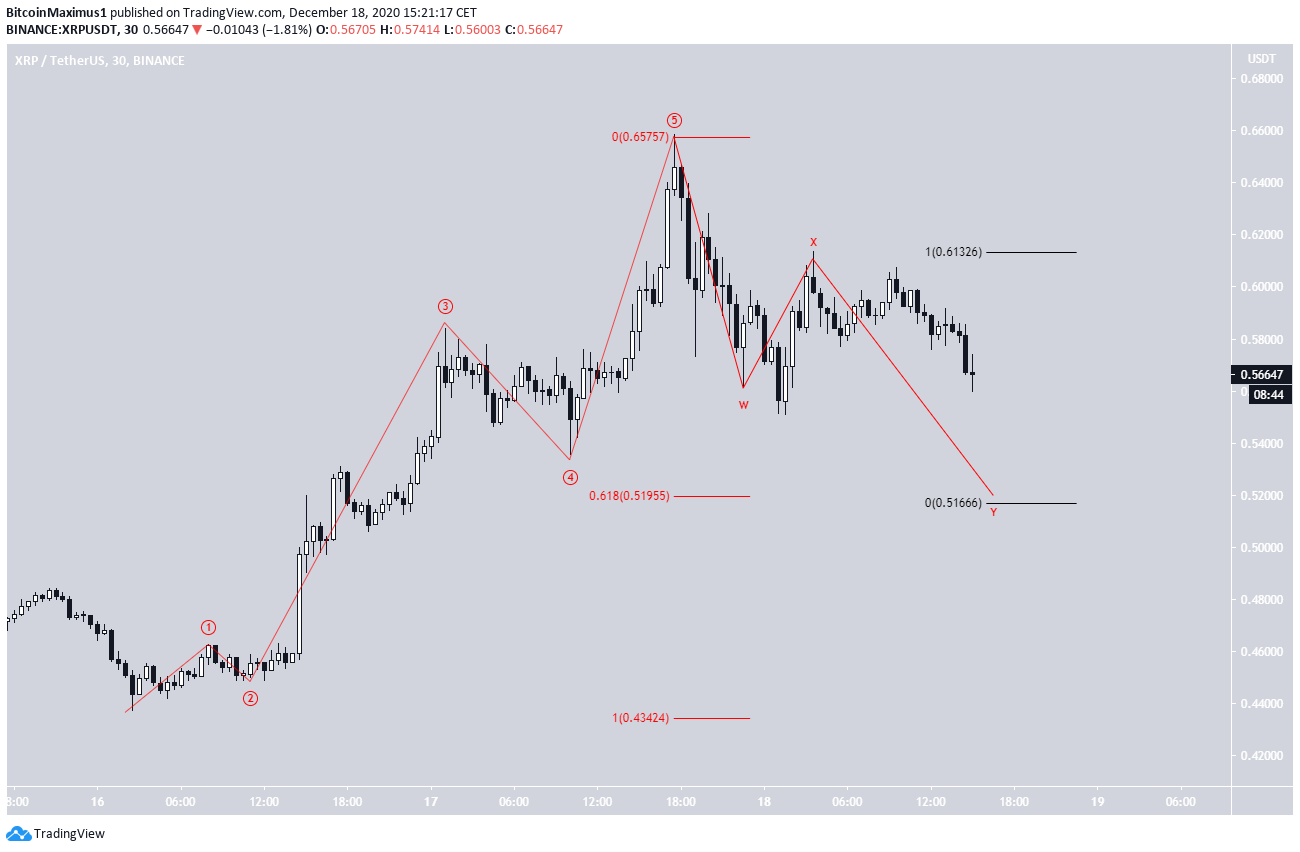
Which One Is Correct?
A look at the 30-minuet chart supports the bullish scenario since the upward move looks impulsive while the downward one looks corrective.
The most likely outcome would be a decline towards $0.52 before XRP resumes its upward movement.
If $0.52 fails to initiate a bounce, it could mean that the bearish scenario will occur, and XRP will fall towards $0.33.
Conclusion
To conclude, XRP is likely to fall towards $0.52 before resuming its upward move towards $1. If the $0.52 area fails to hold, XRP could fall all the way to $0.35.
A rally above $0.659 would confirm that XRP is heading higher.
For BeInCrypto’s latest Bitcoin (BTC) analysis, click here!
Disclaimer: Cryptocurrency trading carries a high level of risk and may not be suitable for all investors. The views expressed in this article do not reflect those of BeInCrypto.


