
XRP looked promising just a few days ago, climbing over 9% in a week. But the momentum has faded fast. The token has traded flat over the last 24 hours and remains down about 9% this month, suggesting bulls are losing grip.
On-chain data now shows rising selling pressure as one group of holders cashes out. And whales, who usually absorb the sell pressure, are moving in different directions — a setup that could leave XRP’s price vulnerable to a short-term pullback.
Hodlers and Whales Move Out of Sync
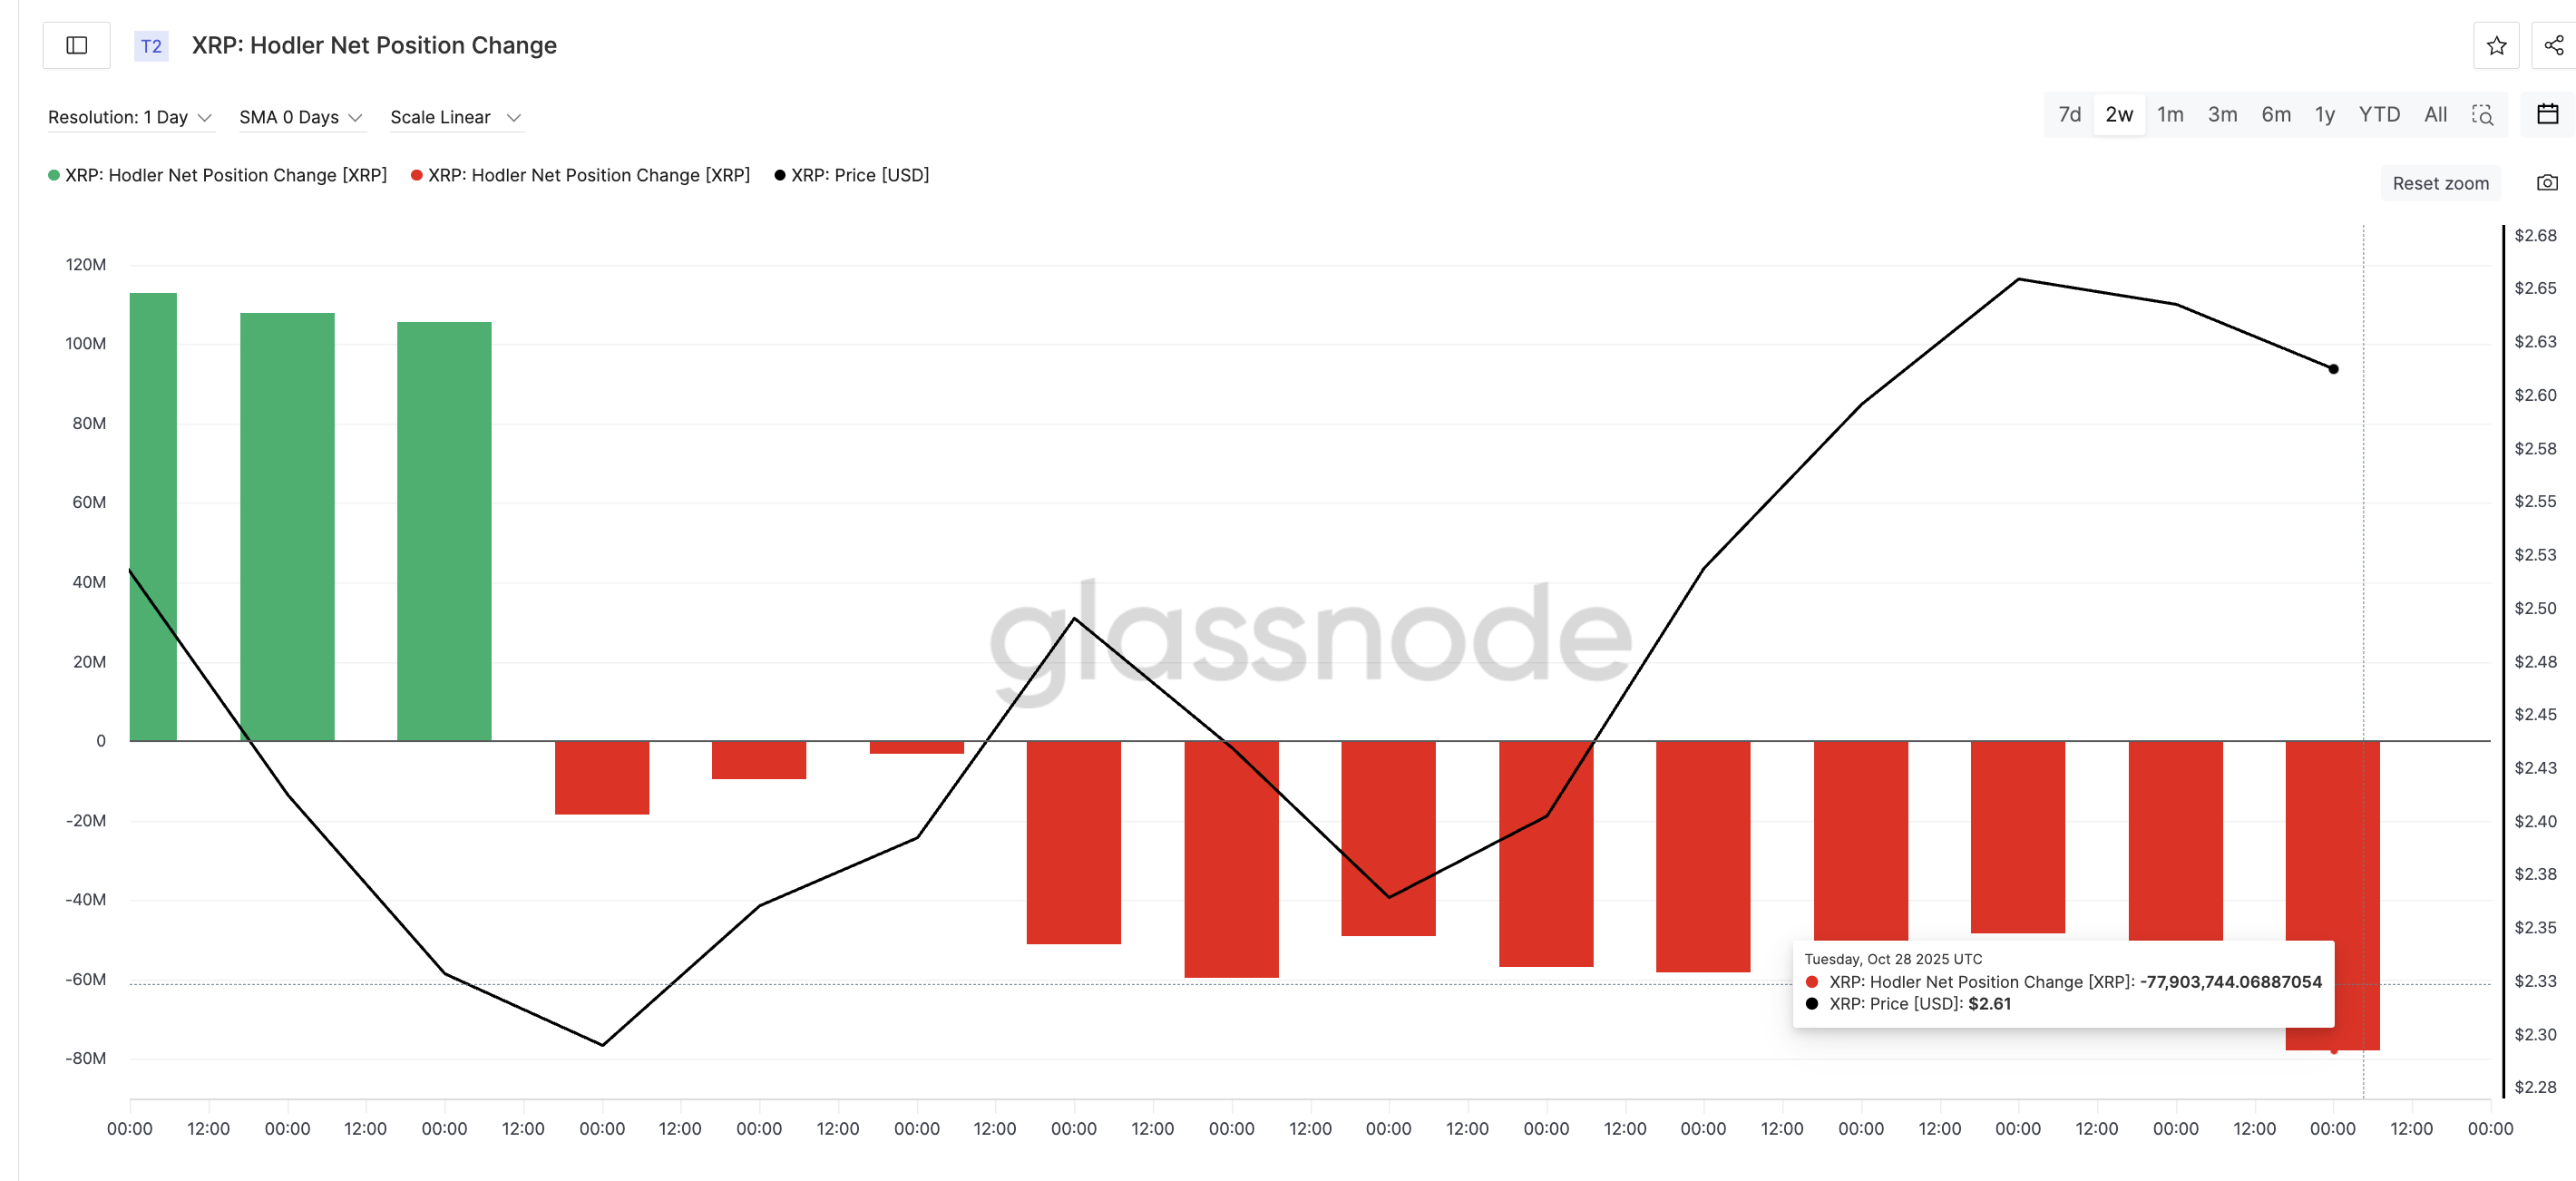
The first warning sign is coming from long-term holders. Data from Glassnode shows XRP’s hodler net position change, a metric that tracks how much long-term investors add or remove from their wallets, has turned sharply negative.
Between October 19 and 28, long-term wallets went from small outflows of 3.28 million XRP to heavy outflows of 77.9 million XRP, a rise of more than 2,200% in less than two weeks. This points to profit-taking after the recent rebound, as older holders reduce exposure rather than accumulate.
Want more token insights like this? Sign up for Editor Harsh Notariya’s Daily Crypto Newsletter here.
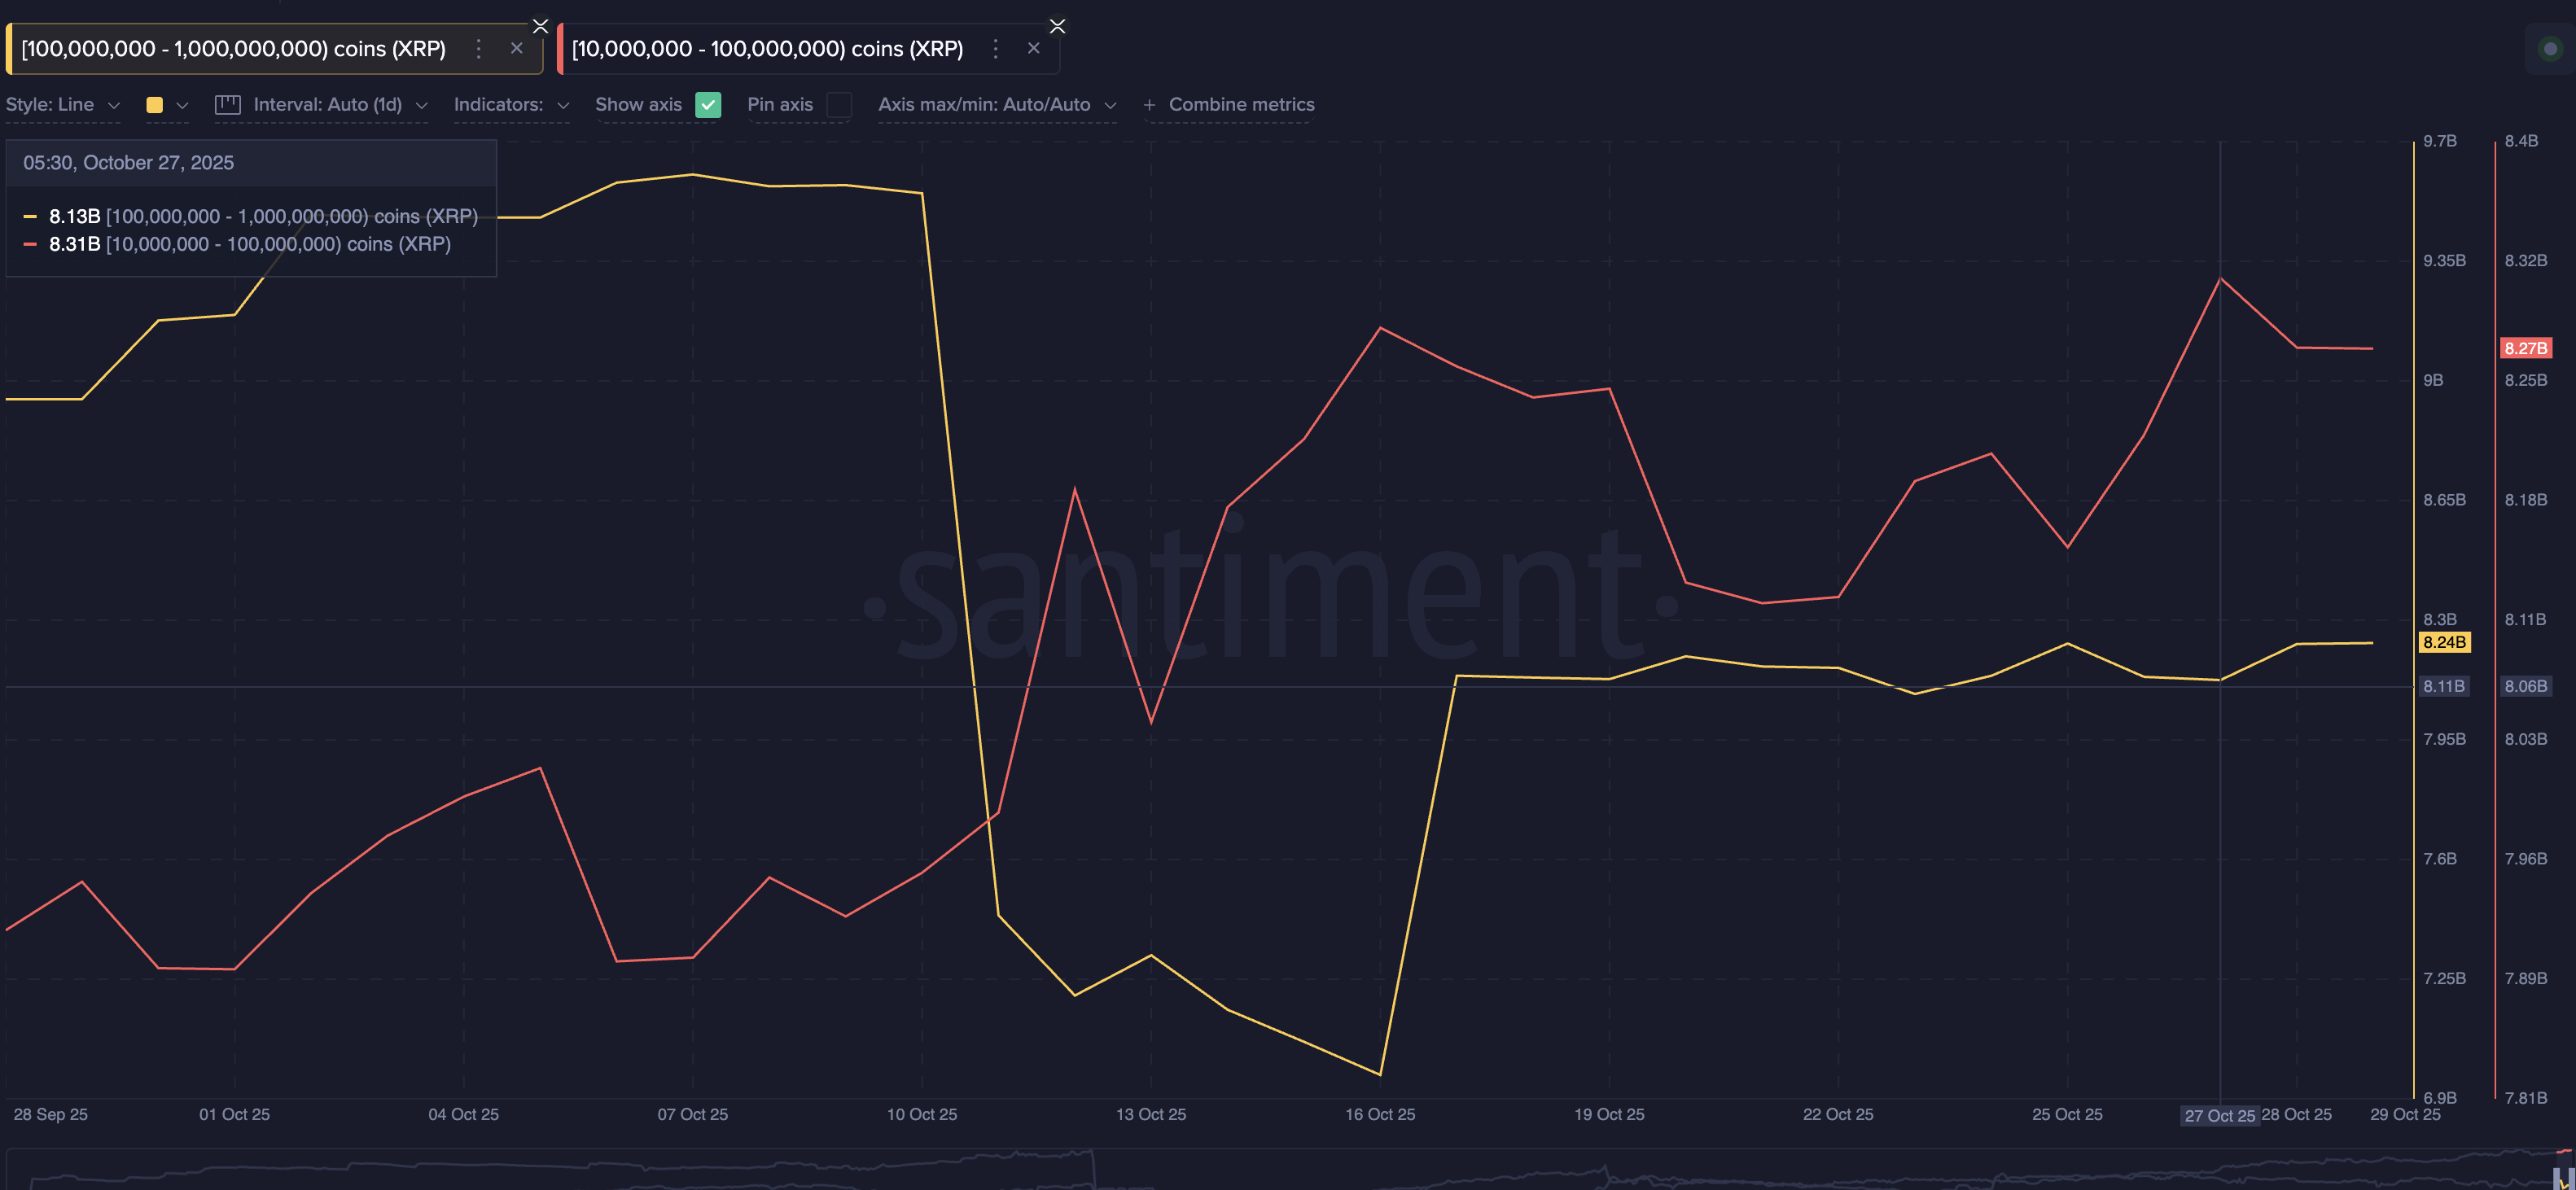
Whales, on the other hand, are sending mixed signals. Large wallets holding 100 million to 1 billion XRP, often seen as “mega whales,” have increased their holdings from 8.13 billion to 8.24 billion XRP since October 27, suggesting an accumulation of almost $289 million.
But smaller whale cohorts, holding 10 million to 100 million XRP, have been net sellers, reducing their stash from 8.31 billion to 8.27 billion XRP over the same period. They have reduced XRP exposure worth $105 million.
This disconnect among major holder groups reflects a lack of unity, with some betting on a rebound while others are exiting positions. Historically, when whale activity diverges like this, prices often weaken rather than rally.
Technical Structure Shows Signs of XRP Price Exhaustion
XRP’s 12-hour price chart highlights this growing indecision. The token is moving within a symmetrical triangle, a pattern that forms when buying and selling pressures are nearly balanced. Since October 26, the XRP price has hovered between $2.69 and $2.60, with neither side able to break through.
If the price slips below $2.60, the next supports appear near $2.55 and $2.51. That is followed by $2.46, an area that aligns with the 0.618 Fibonacci retracement level. This is where traders may expect temporary buying interest.
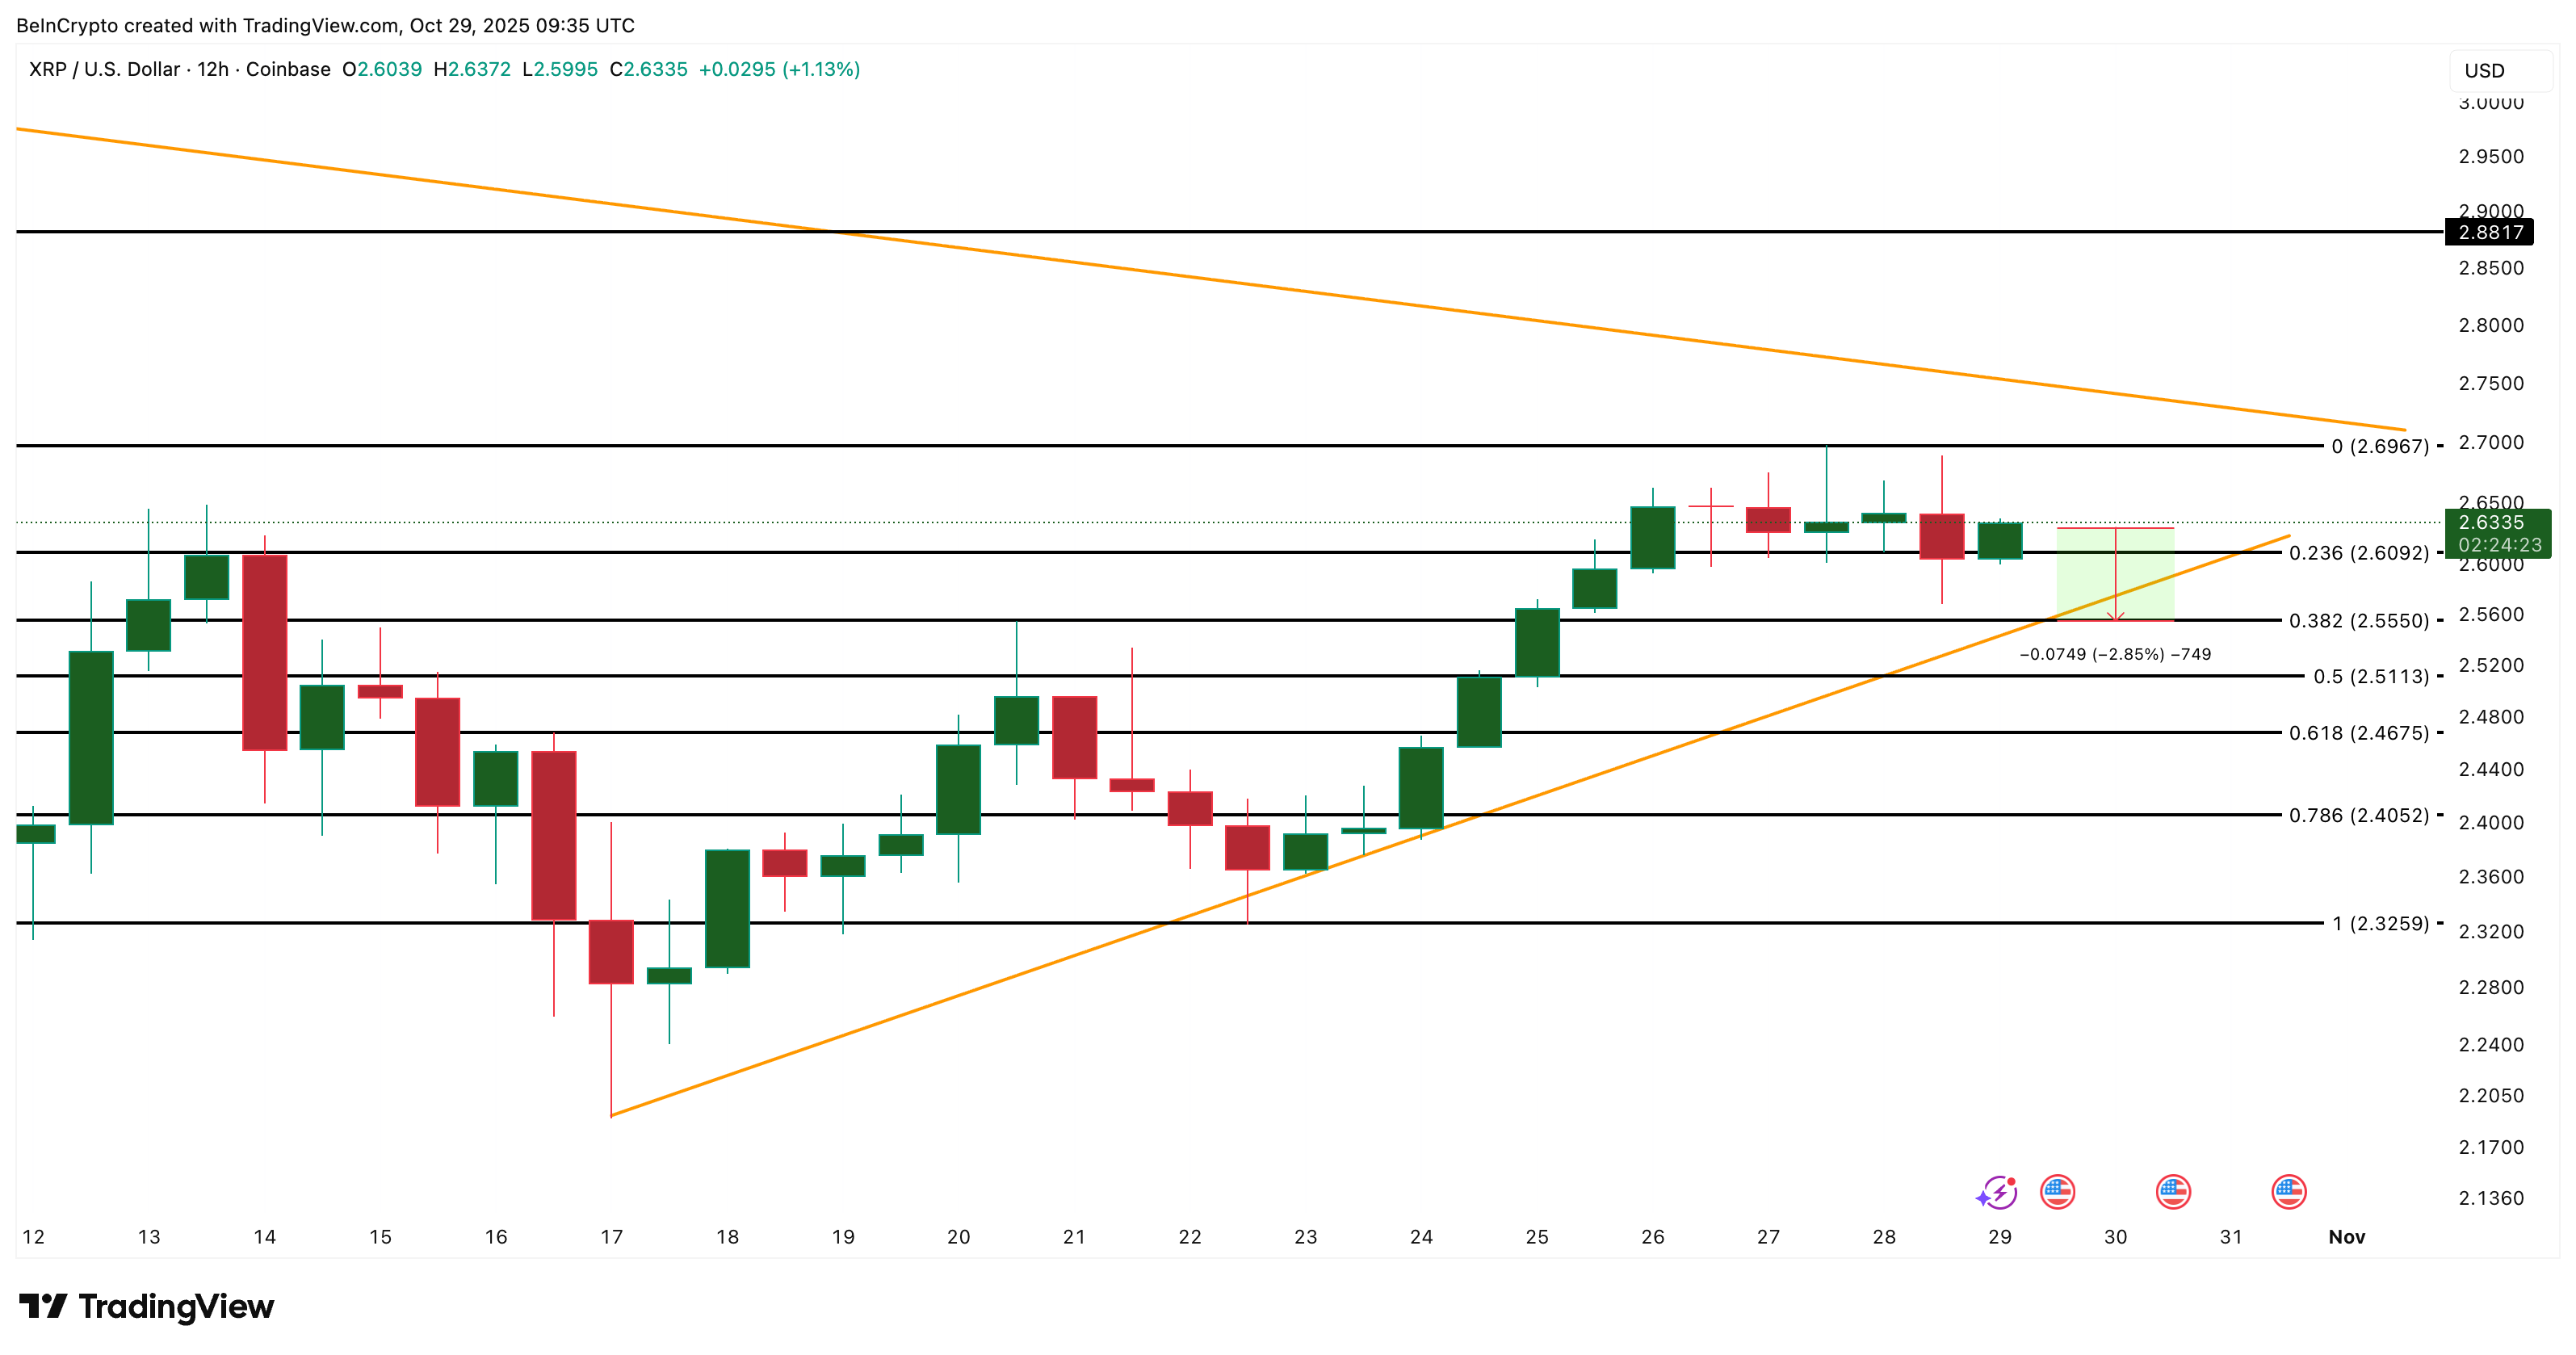
For bulls, the critical line in the sand sits at $2.69, the upper trendline of the triangle. A decisive breakout above that level could give XRP room to rally toward $2.88 and higher.
However, until that happens, the chart leans bearish. Combined with outflows from long-term holders and mixed whale behavior, the odds of a short-term XRP price pullback remain high.
