
The XRP price broke out from a descending channel on February 2. The upward movement is expected to continue.
XRP Highlights
- The XRP price movement can possibly be predicted with the Wyckoff distribution method.
- The price has broken out above a descending channel.
- There is resistance at 2950 & 3300 satoshis.
- The price has moved above its 50-day moving average (MA).
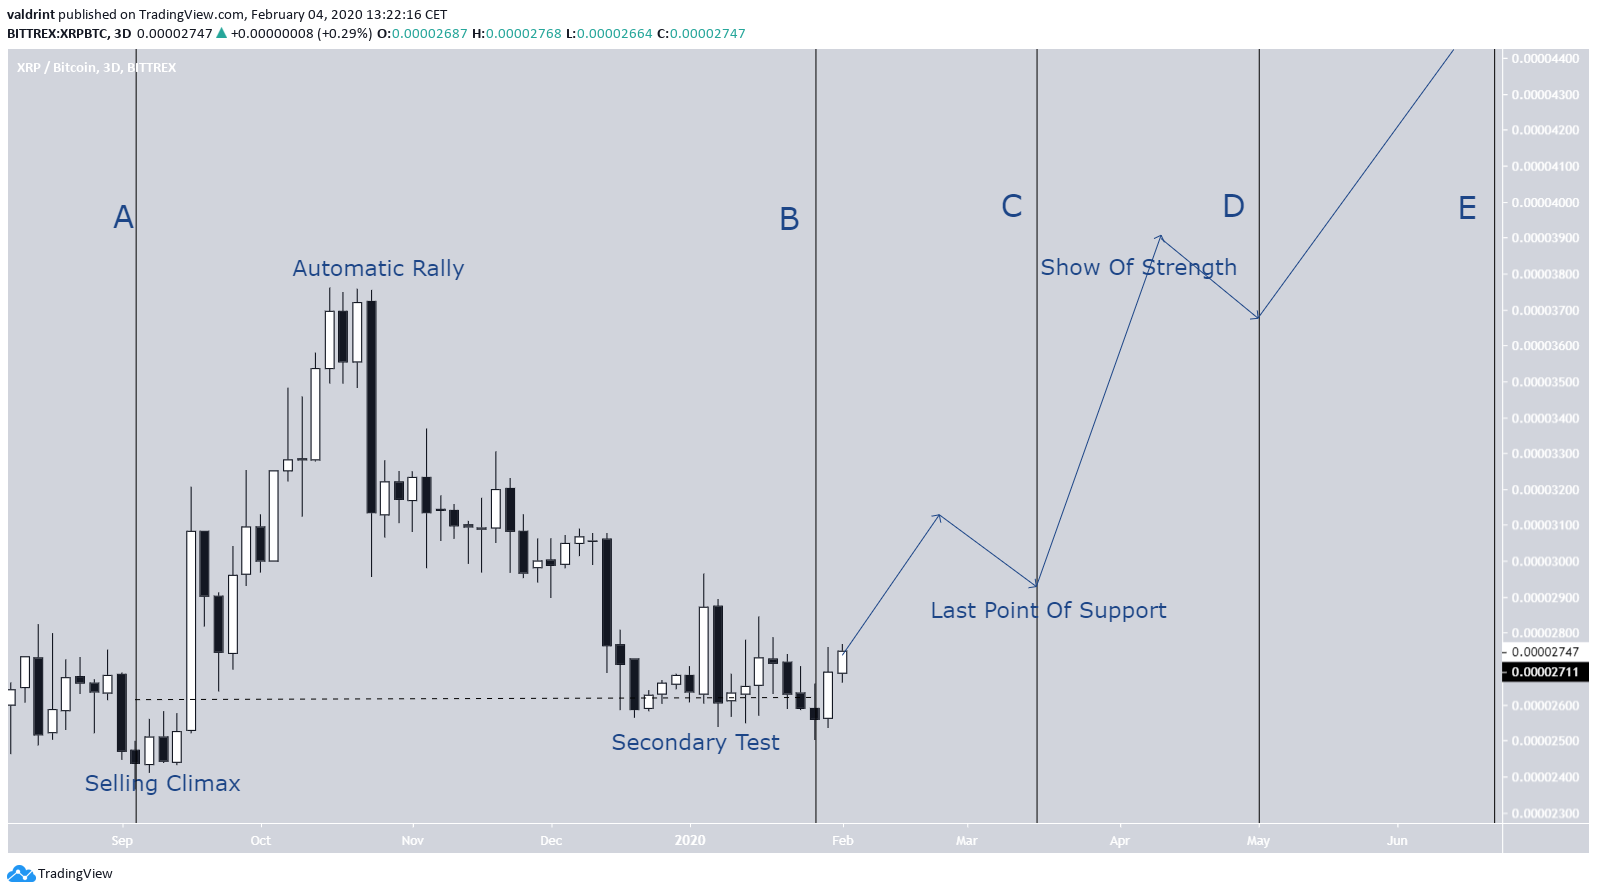
Well-known trader @TraderX0X0 tweeted an XRP price chart in which the phases of a Wyckoff distribution are outlined. The price is currently near the spring, which is the level that should offer a bounce before the price breaks out above the range high.
https://twitter.com/TraderX0X0/status/1223418859757219841
Will the XRP price follow this Wyckoff distribution? Keep reading below if you are interested in finding out.
Wyckoff Distribution
The current XRP price movement is likely the “secondary test” of the previous “selling climax,” which was reached on September 6, 2019, with a low of 2366 satoshis. Therefore, the price is at the end of the B phase. The C phase has the price moving towards the high of 3760 satoshis, which in the graph is labeled as the “automatic rally.” Afterward, the price should break out above this high in phase D before the rate of increase accelerates greatly in E.
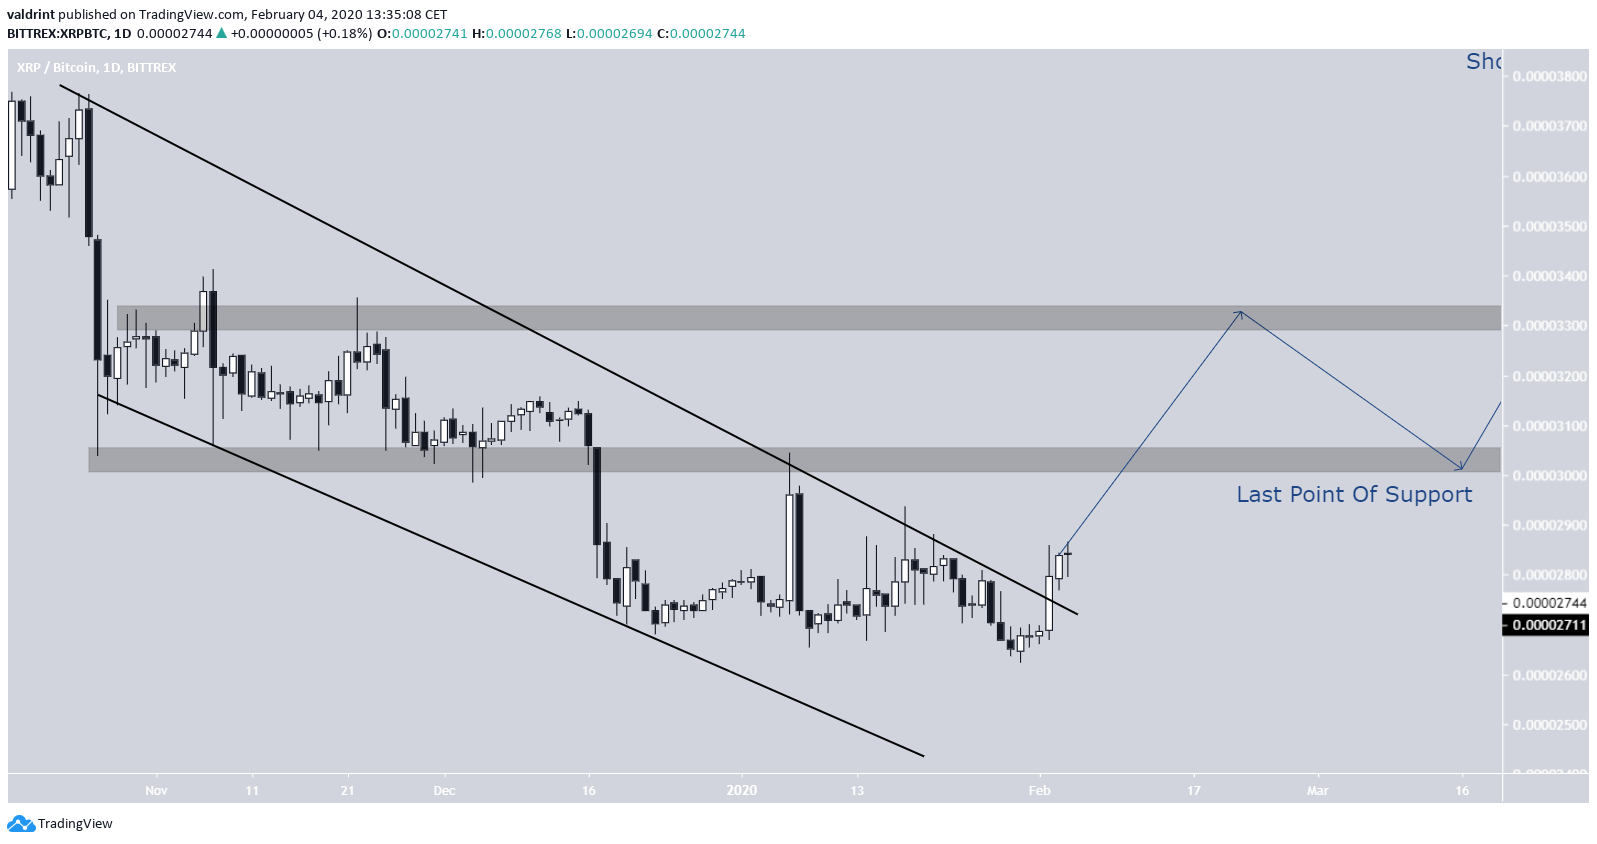
If this is to be true, the best level to enter the trade in anticipation of an upward move would be at the “last point of support” (LPS).
Based on the length of the current movement, this low is expected to be created sometime in the beginning of March. We have laid out the entire phases of the Wyckoff distribution in the graph below.
Descending Channel Breakout
A closer look at the XRP price movement reveals that the price broke out above a descending channel on February 2. The channel had been in place for the past 100 days,
The closest resistance areas are found at 2950 and 3300 satoshis. If the movement outlined in the previous section occurs, the price will reach the 3300 satoshi resistance area before returning to validate the 2950 area as support, thus creating the last point of support.
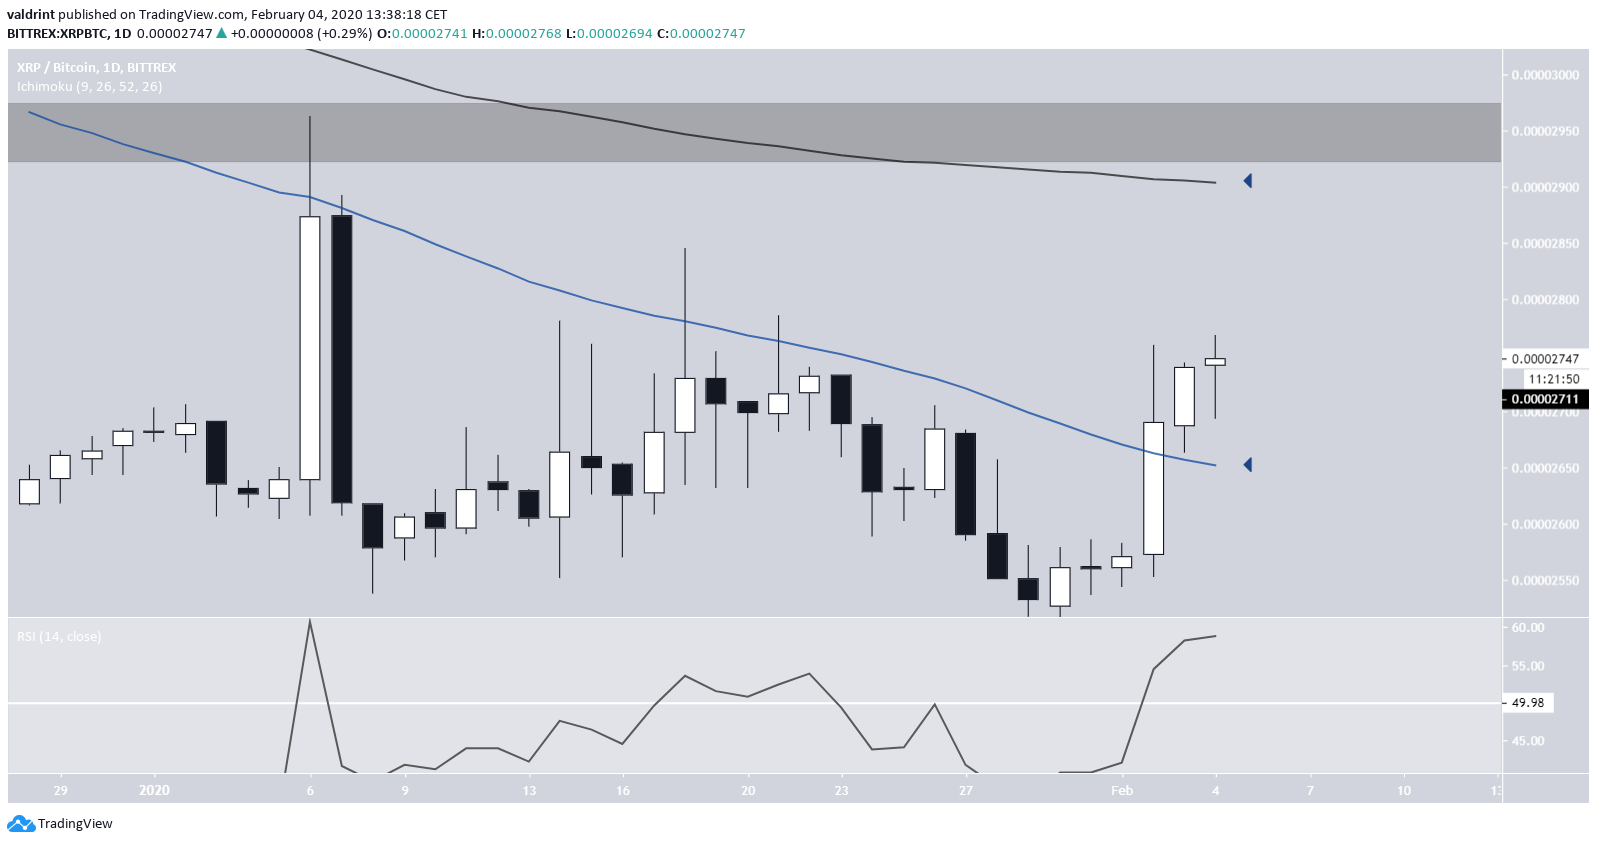
Technical indicators support this hypothetical price movement. The breakout from the channel was combined with an RSI movement above 50 and a price movement above its 50-day moving average (MA). If the price continues with the outlined movement, it will soon move above the 200-day MA and cause a golden cross to transpire between the MAs mentioned above.
To conclude, the XRP price movement can be explained using the Wyckoff distribution. If the price continues following this distribution, the current price level will be the low for the foreseeable future, as the price will move towards the range high of 3300 satoshis and possibly higher.
