
XRP price has gained roughly 3% in the past 24 hours, bouncing after reclaiming two important short-term trend indicators. The move comes even as the broader chart structure still resembles a bearish reversal pattern. That combination has created a confusing setup for traders.
While spot buying has increased and derivatives traders are turning optimistic, large holders appear less convinced. The result is a market where momentum is returning, but caution has not disappeared. The next few XRP price levels may determine which side gains control.
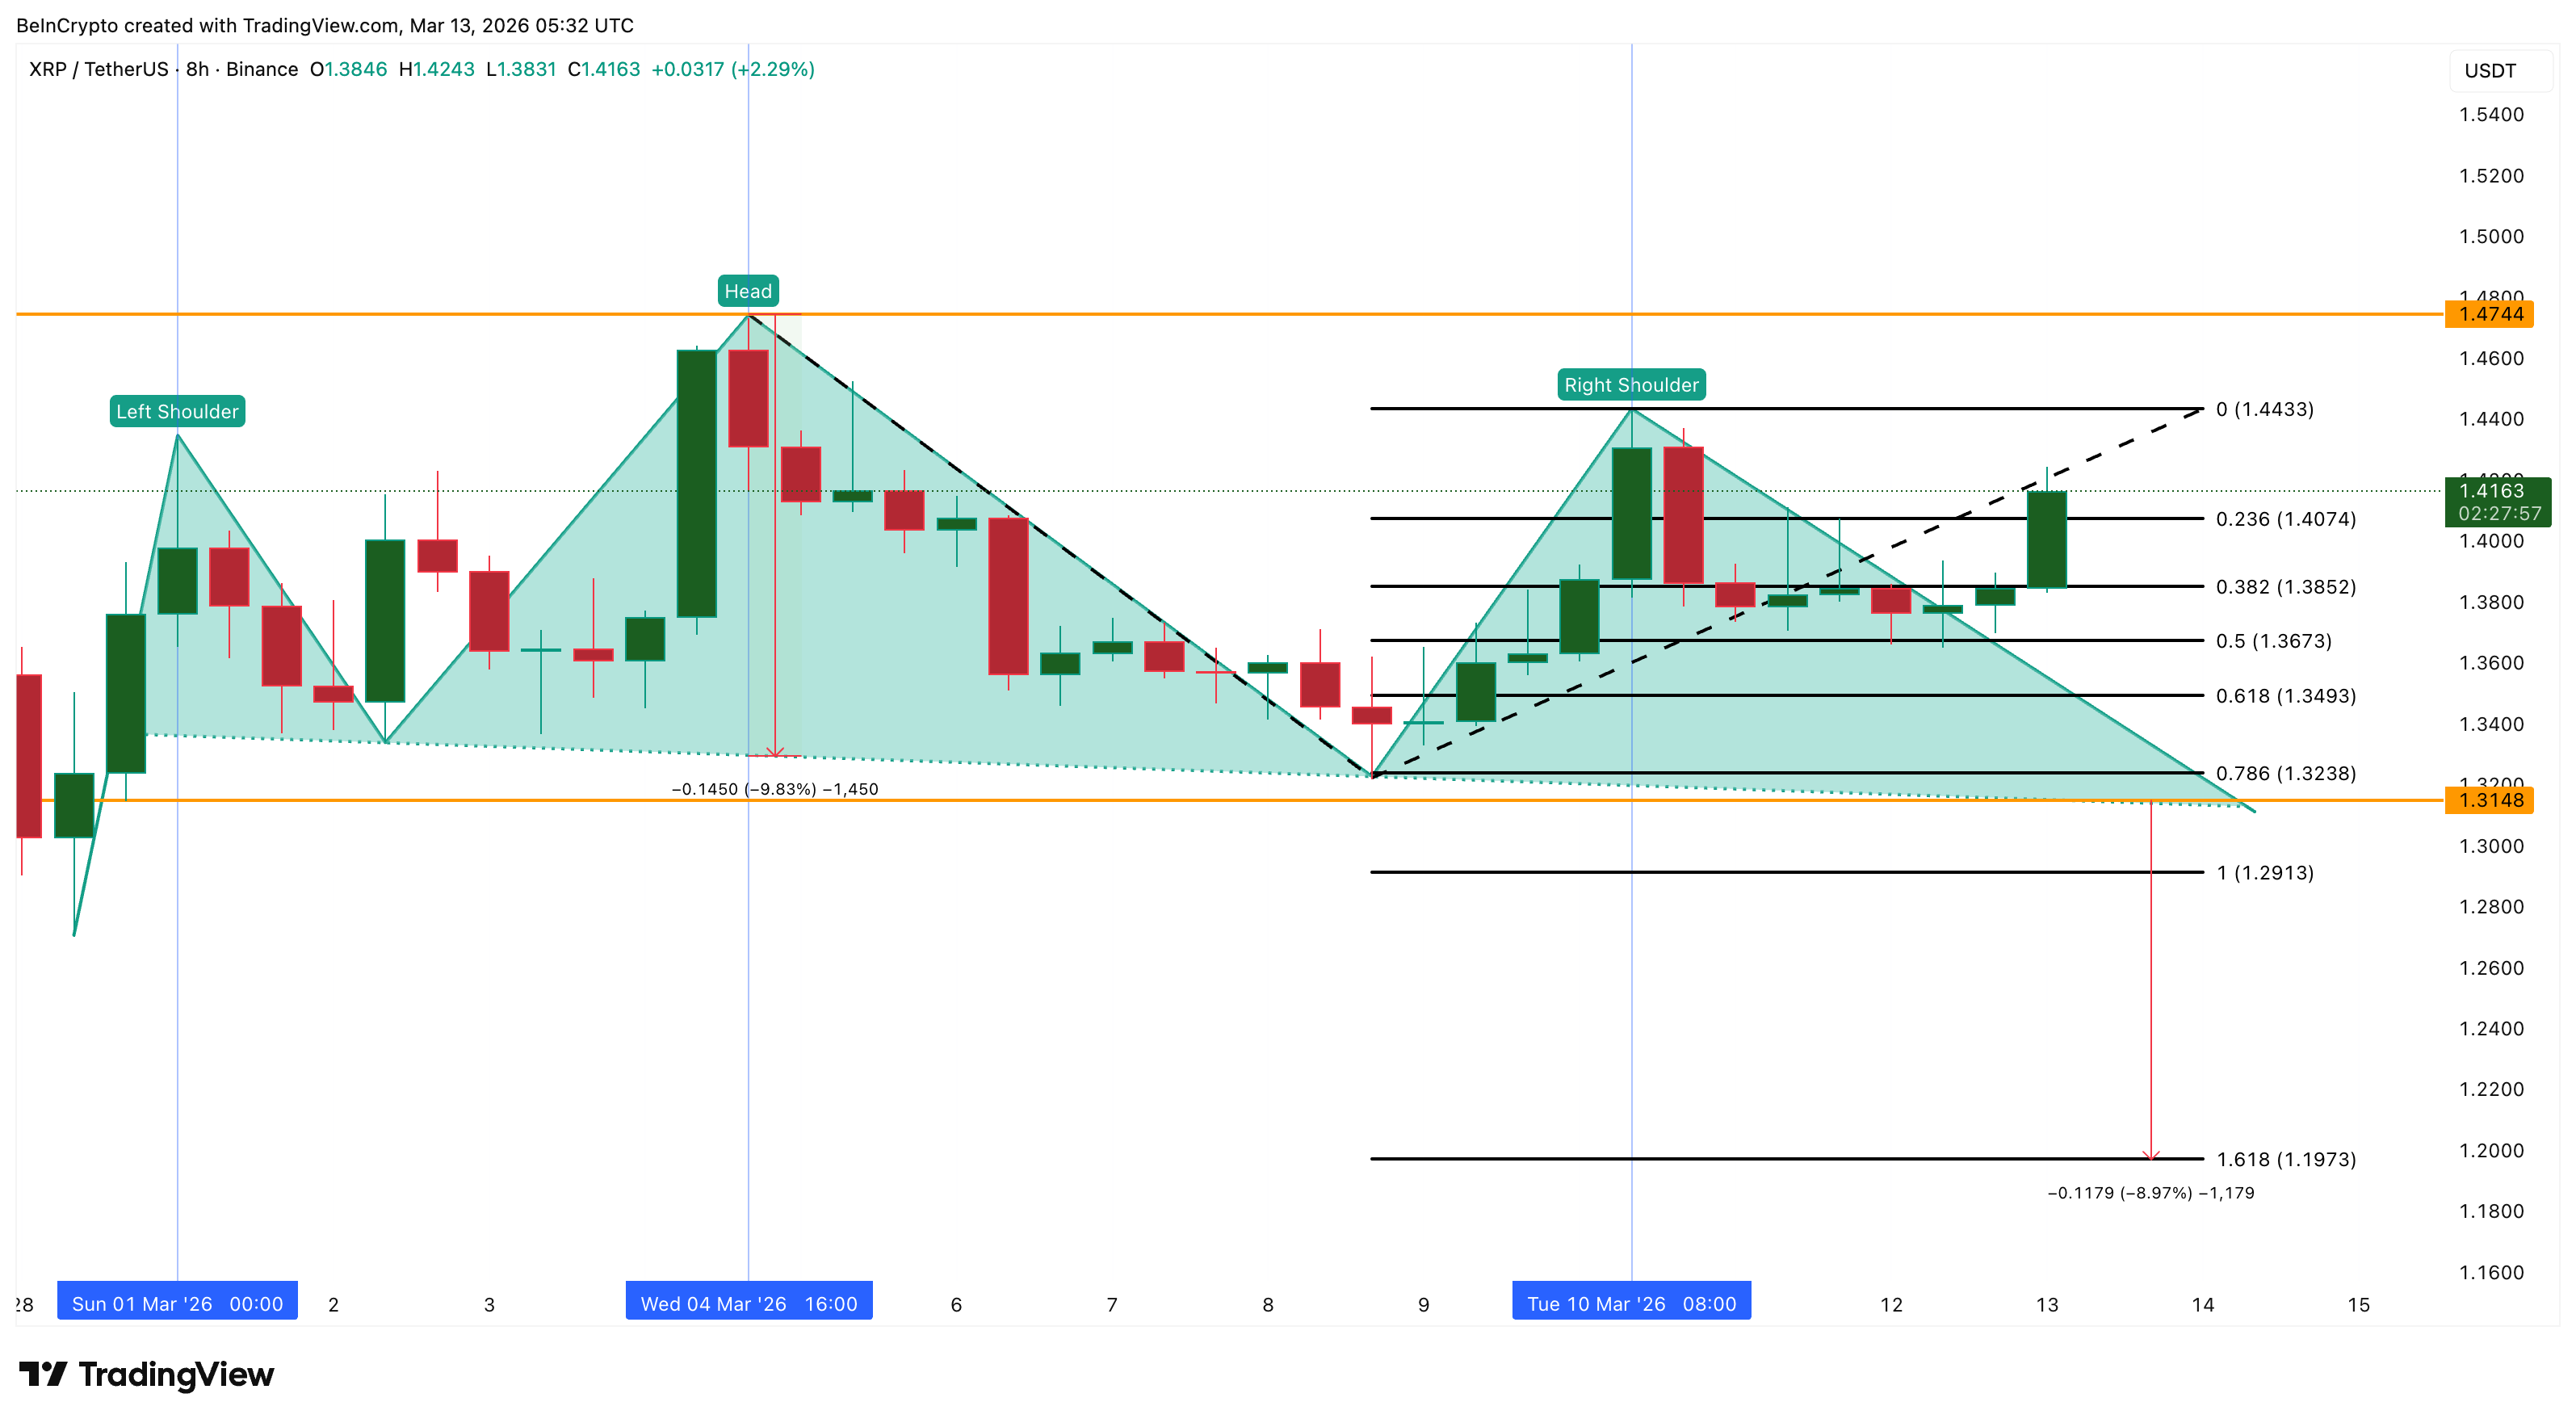
Head-and-Shoulders Pattern Faces Test as Price Reclaims Key Levels
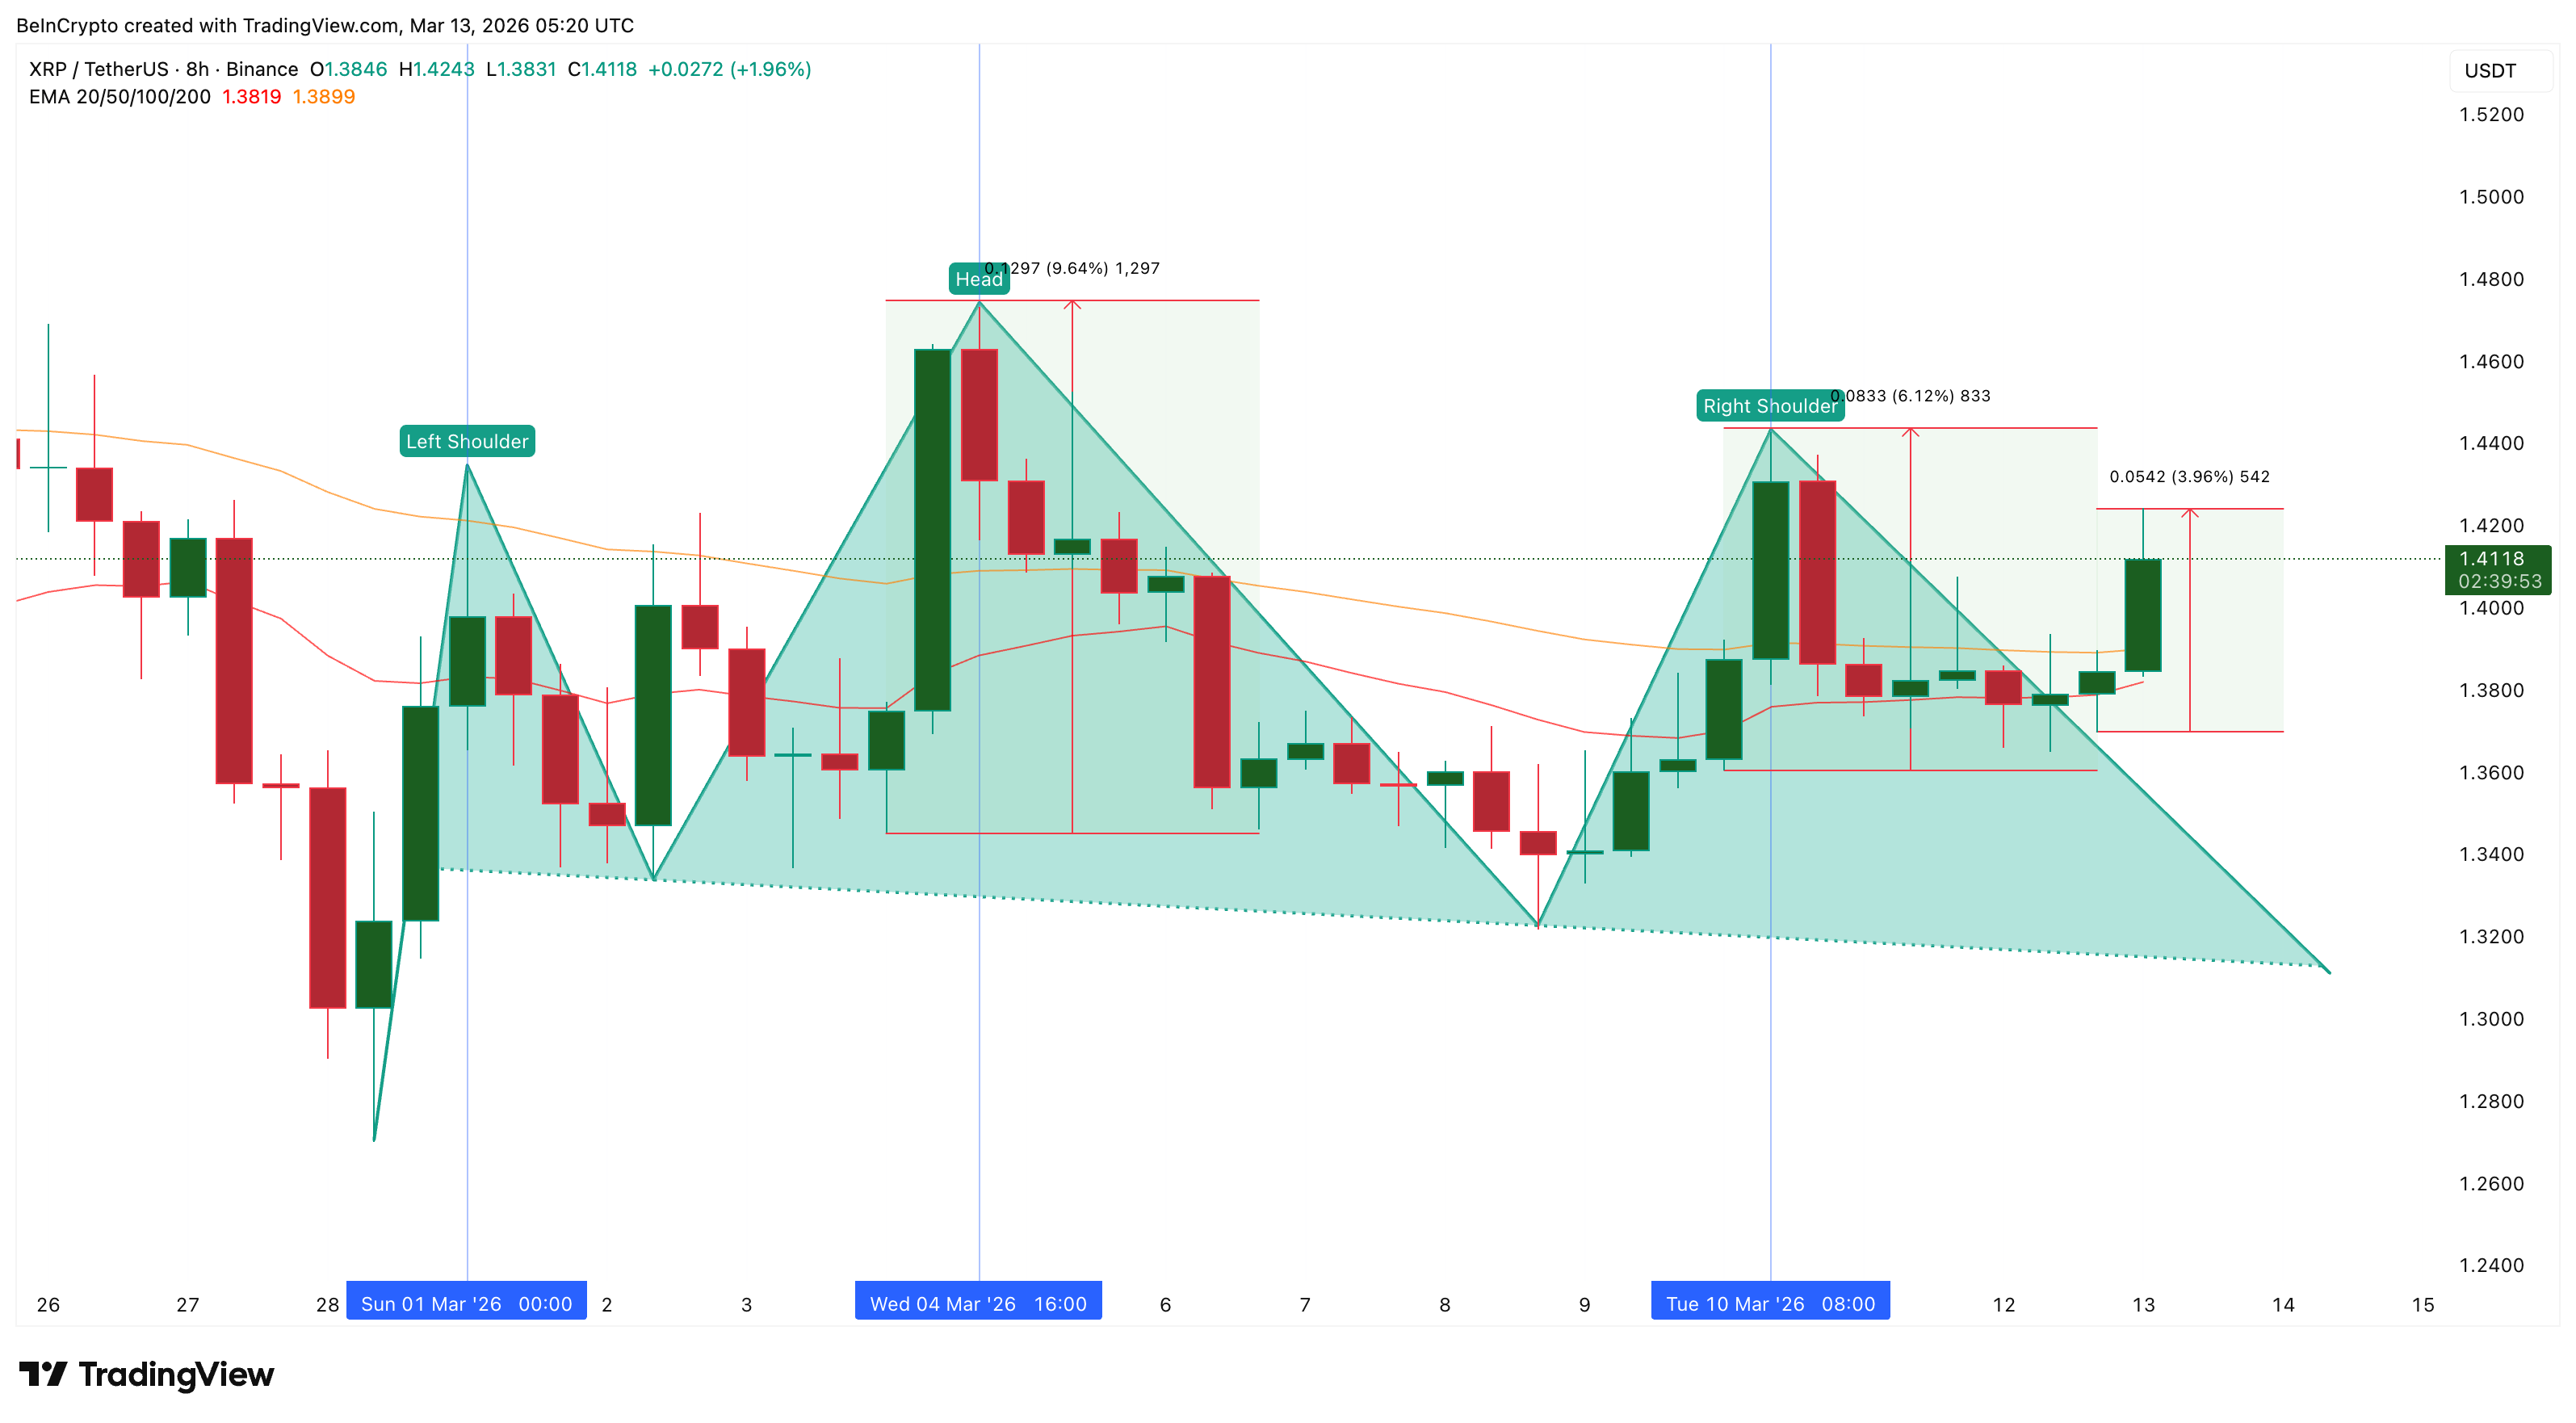
The 8-hour chart currently shows XRP forming a head-and-shoulders structure, a pattern that often signals a potential trend reversal to the downside. In this case, the left shoulder formed on March 1, the head formed on March 4, and the right shoulder developed on March 10.
Despite the bearish structure, XRP has recently regained momentum after reclaiming two key indicators: the 20-period EMA and the 50-period EMA. An EMA, or exponential moving average, tracks recent price momentum and helps traders identify trend direction.
When the price moves above both levels, it often signals strengthening buying pressure.
A similar move happened earlier in the month. When XRP reclaimed these two averages between March 10 and March 11, the price rallied about 6% before forming the right shoulder. Another reclaim between March 4 and March 5 preceded a 10% rise, which eventually created the head of the pattern.
Want more token insights like this? Sign up for Editor Harsh Notariya’s Daily Crypto Newsletter here.
This time, XRP has already climbed roughly 4% since moving above the same indicators again. However, the bearish pattern remains intact for now.
The right shoulder would weaken if XRP pushes above it, while a move above the head would invalidate the short-term bearish structure completely. Until those levels break, the head-and-shoulders pattern still remains active. Yet, a few market cohorts are already positioning for the bearish invalidation.
Traders Turn Bullish as Spot Buying and Leverage Increase
Market positioning suggests traders are increasingly optimistic about the recent rebound.
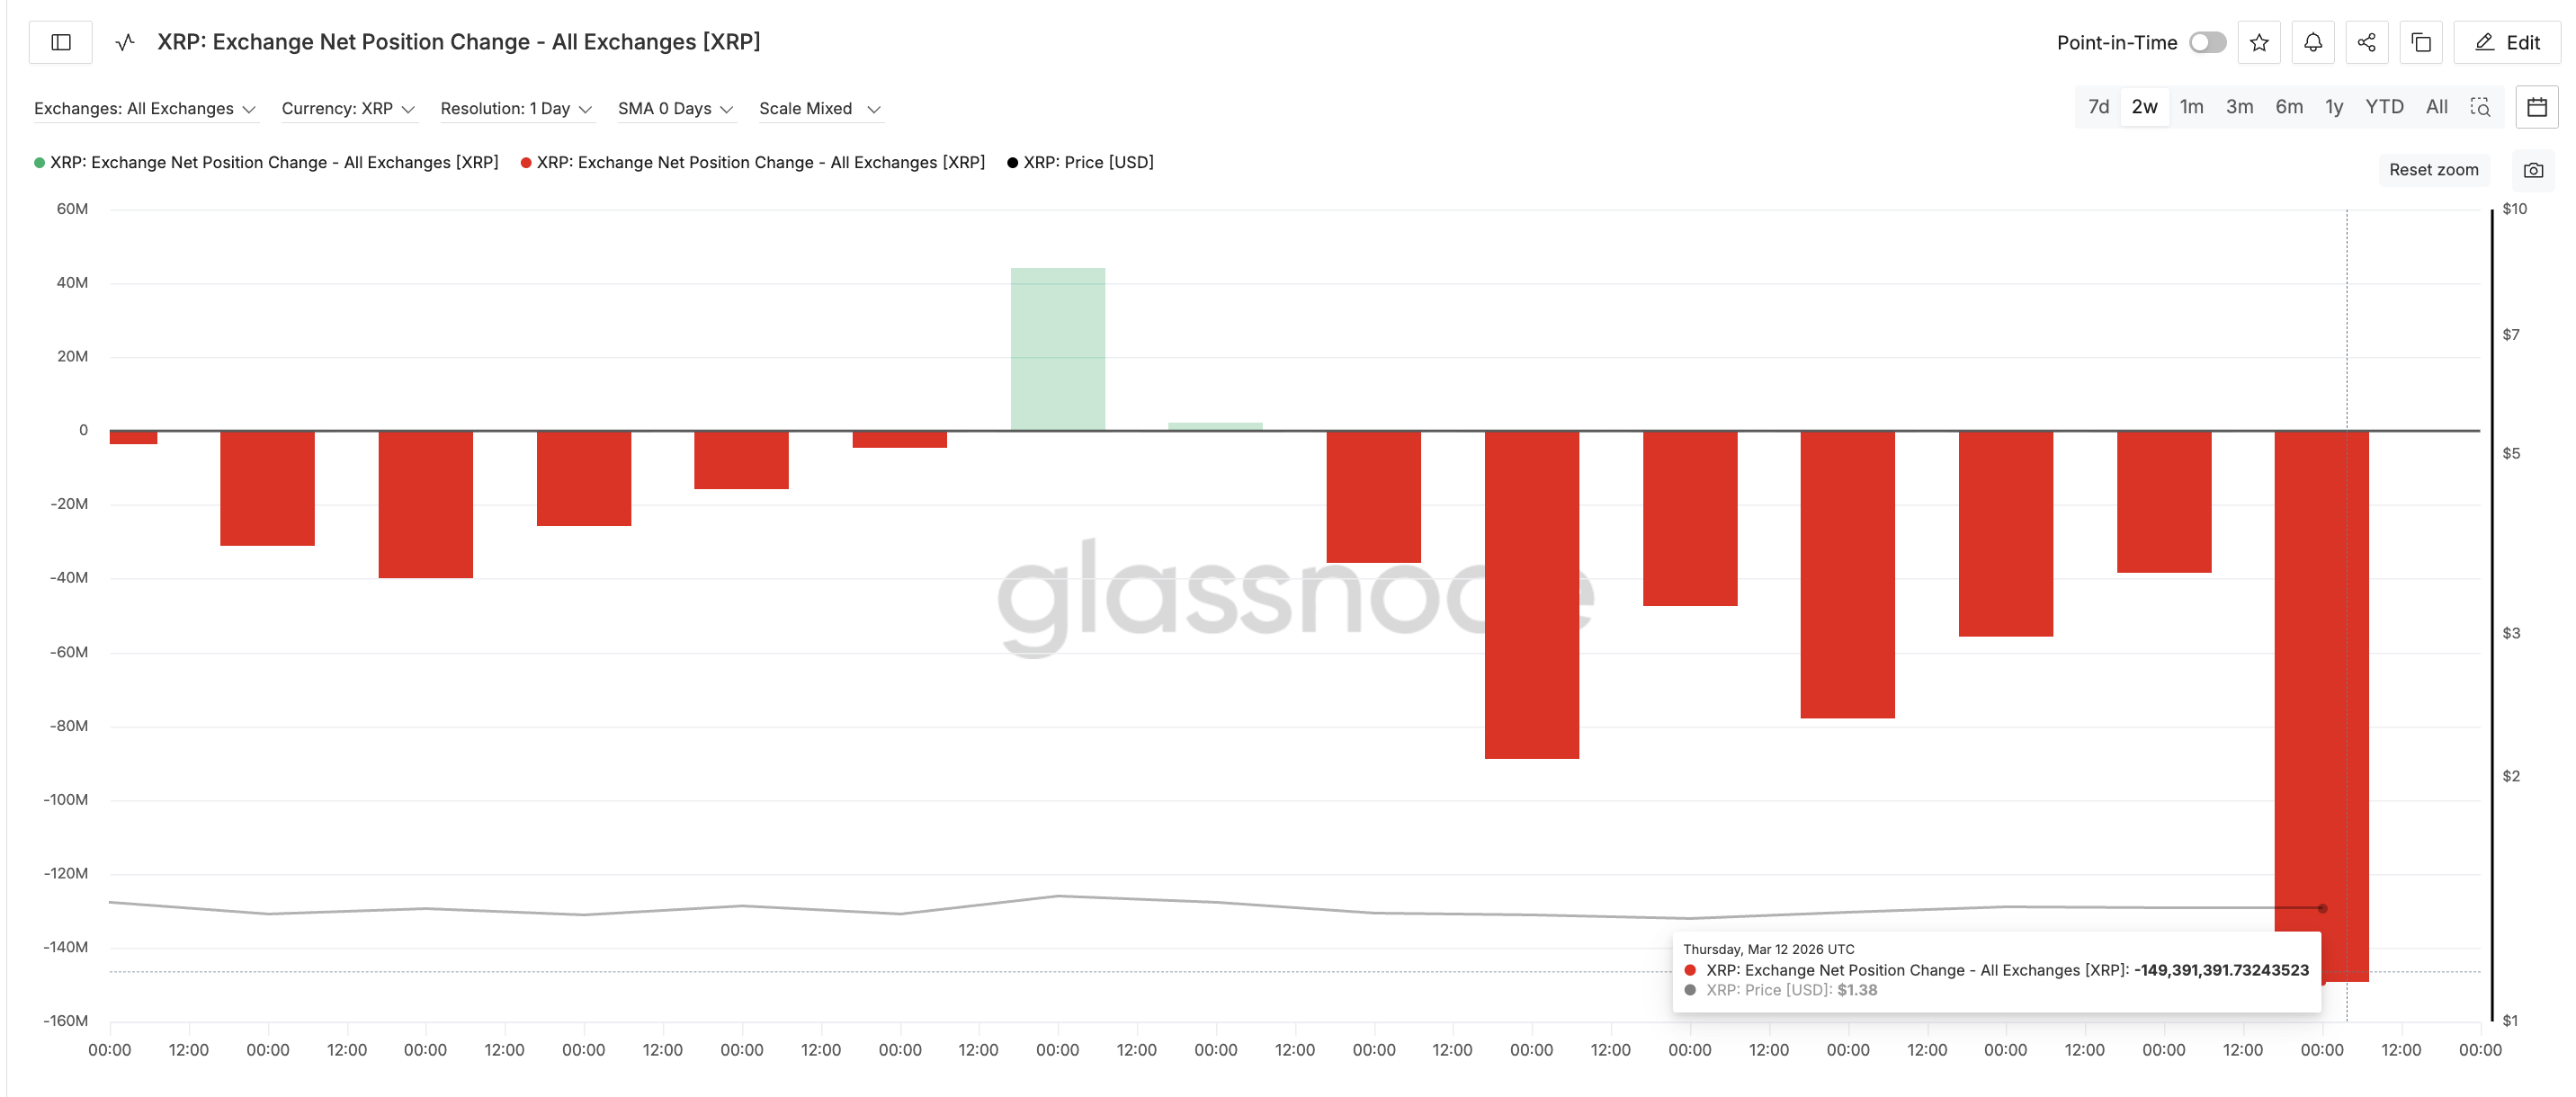
One signal comes from the Exchange Net Position Change metric. This indicator tracks how many coins move into or out of exchanges. When the number becomes more negative, it usually means coins are leaving exchanges, which often signals accumulation.
On March 6, exchange flows showed roughly –35.66 million XRP leaving exchanges. By March 12, when the 20-period EMA was reclaimed, that number had reached about –149.39 million XRP. That represents a roughly 319% increase in net outflows, indicating a sharp rise in buying pressure as investors moved coins off trading platforms.
The derivatives market shows a similar shift in sentiment.
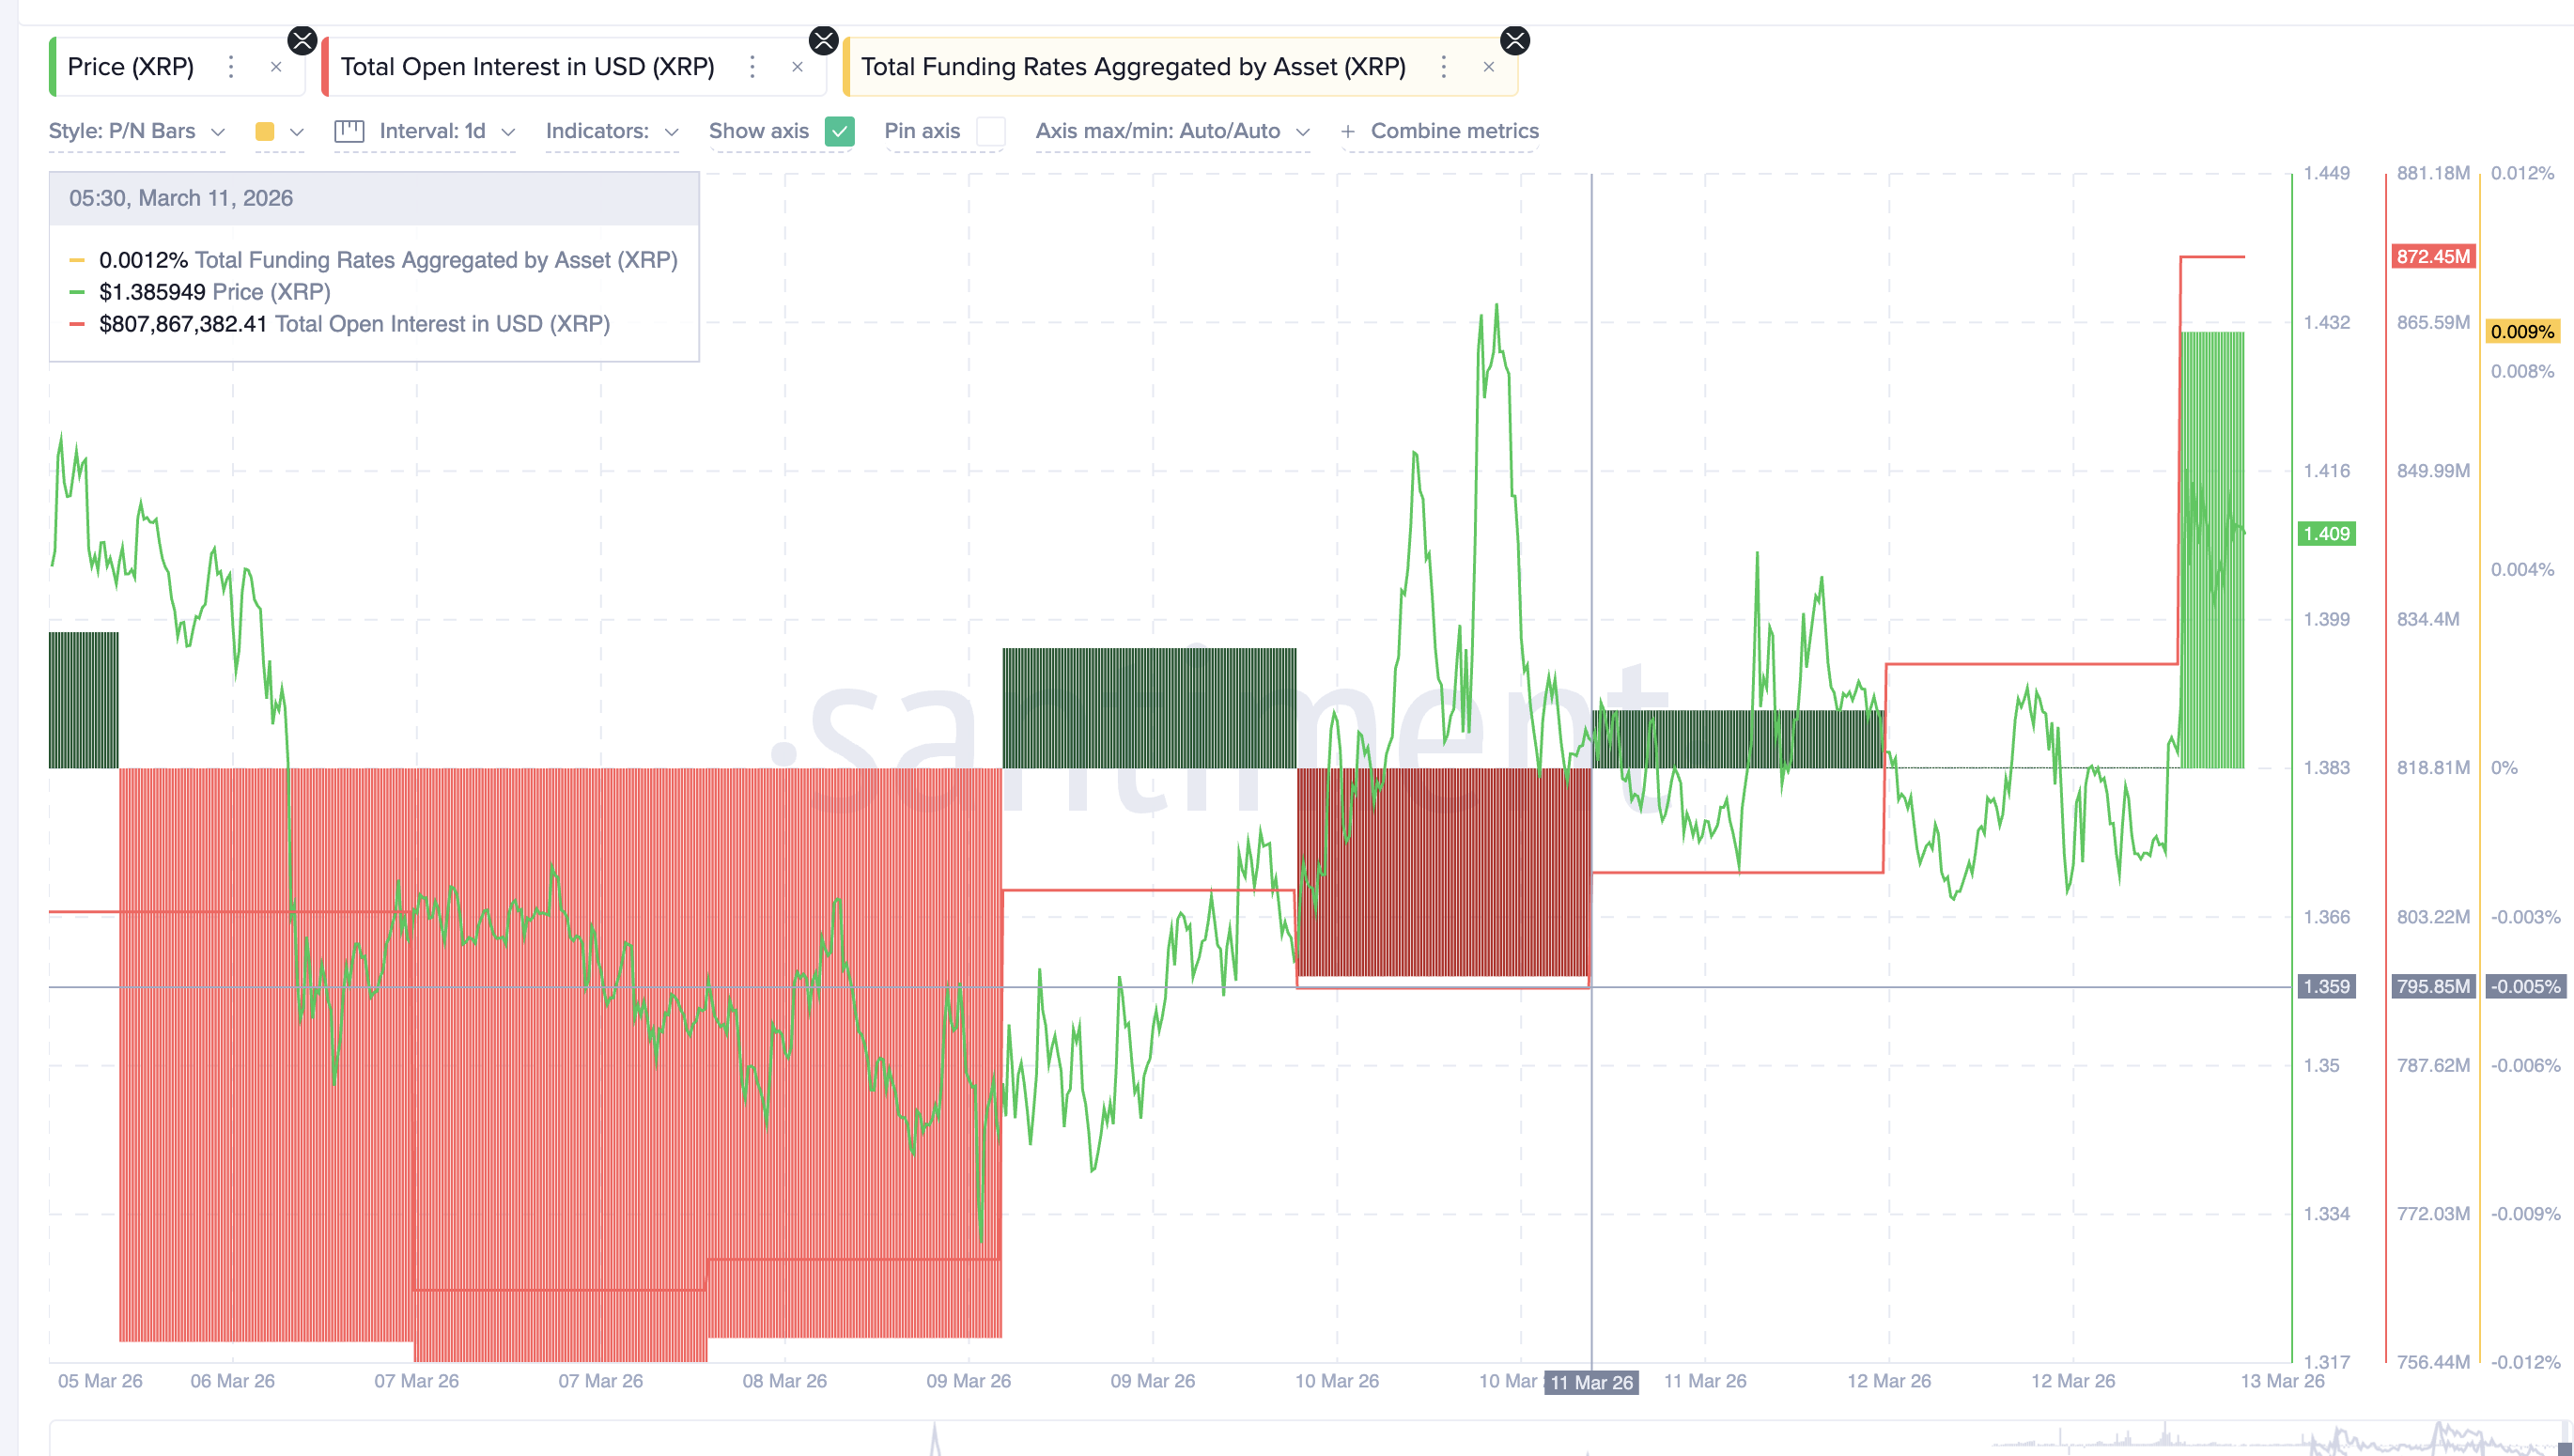
Open interest, which measures the total value of active futures contracts, has increased sharply in recent days. Between March 11 and March 13, open interest rose from about $795 million to $872 million, a roughly 10% increase.
At the same time, funding rates turned positive, rising from about –0.005% to +0.009%. Positive funding rates indicate growing bullish expectations. In simple terms, both spot traders and leveraged futures traders appear increasingly confident about XRP’s rebound.
However, not all large investors share that optimism.
XRP Whales Turn Cautious as Large Holders Reduce Exposure
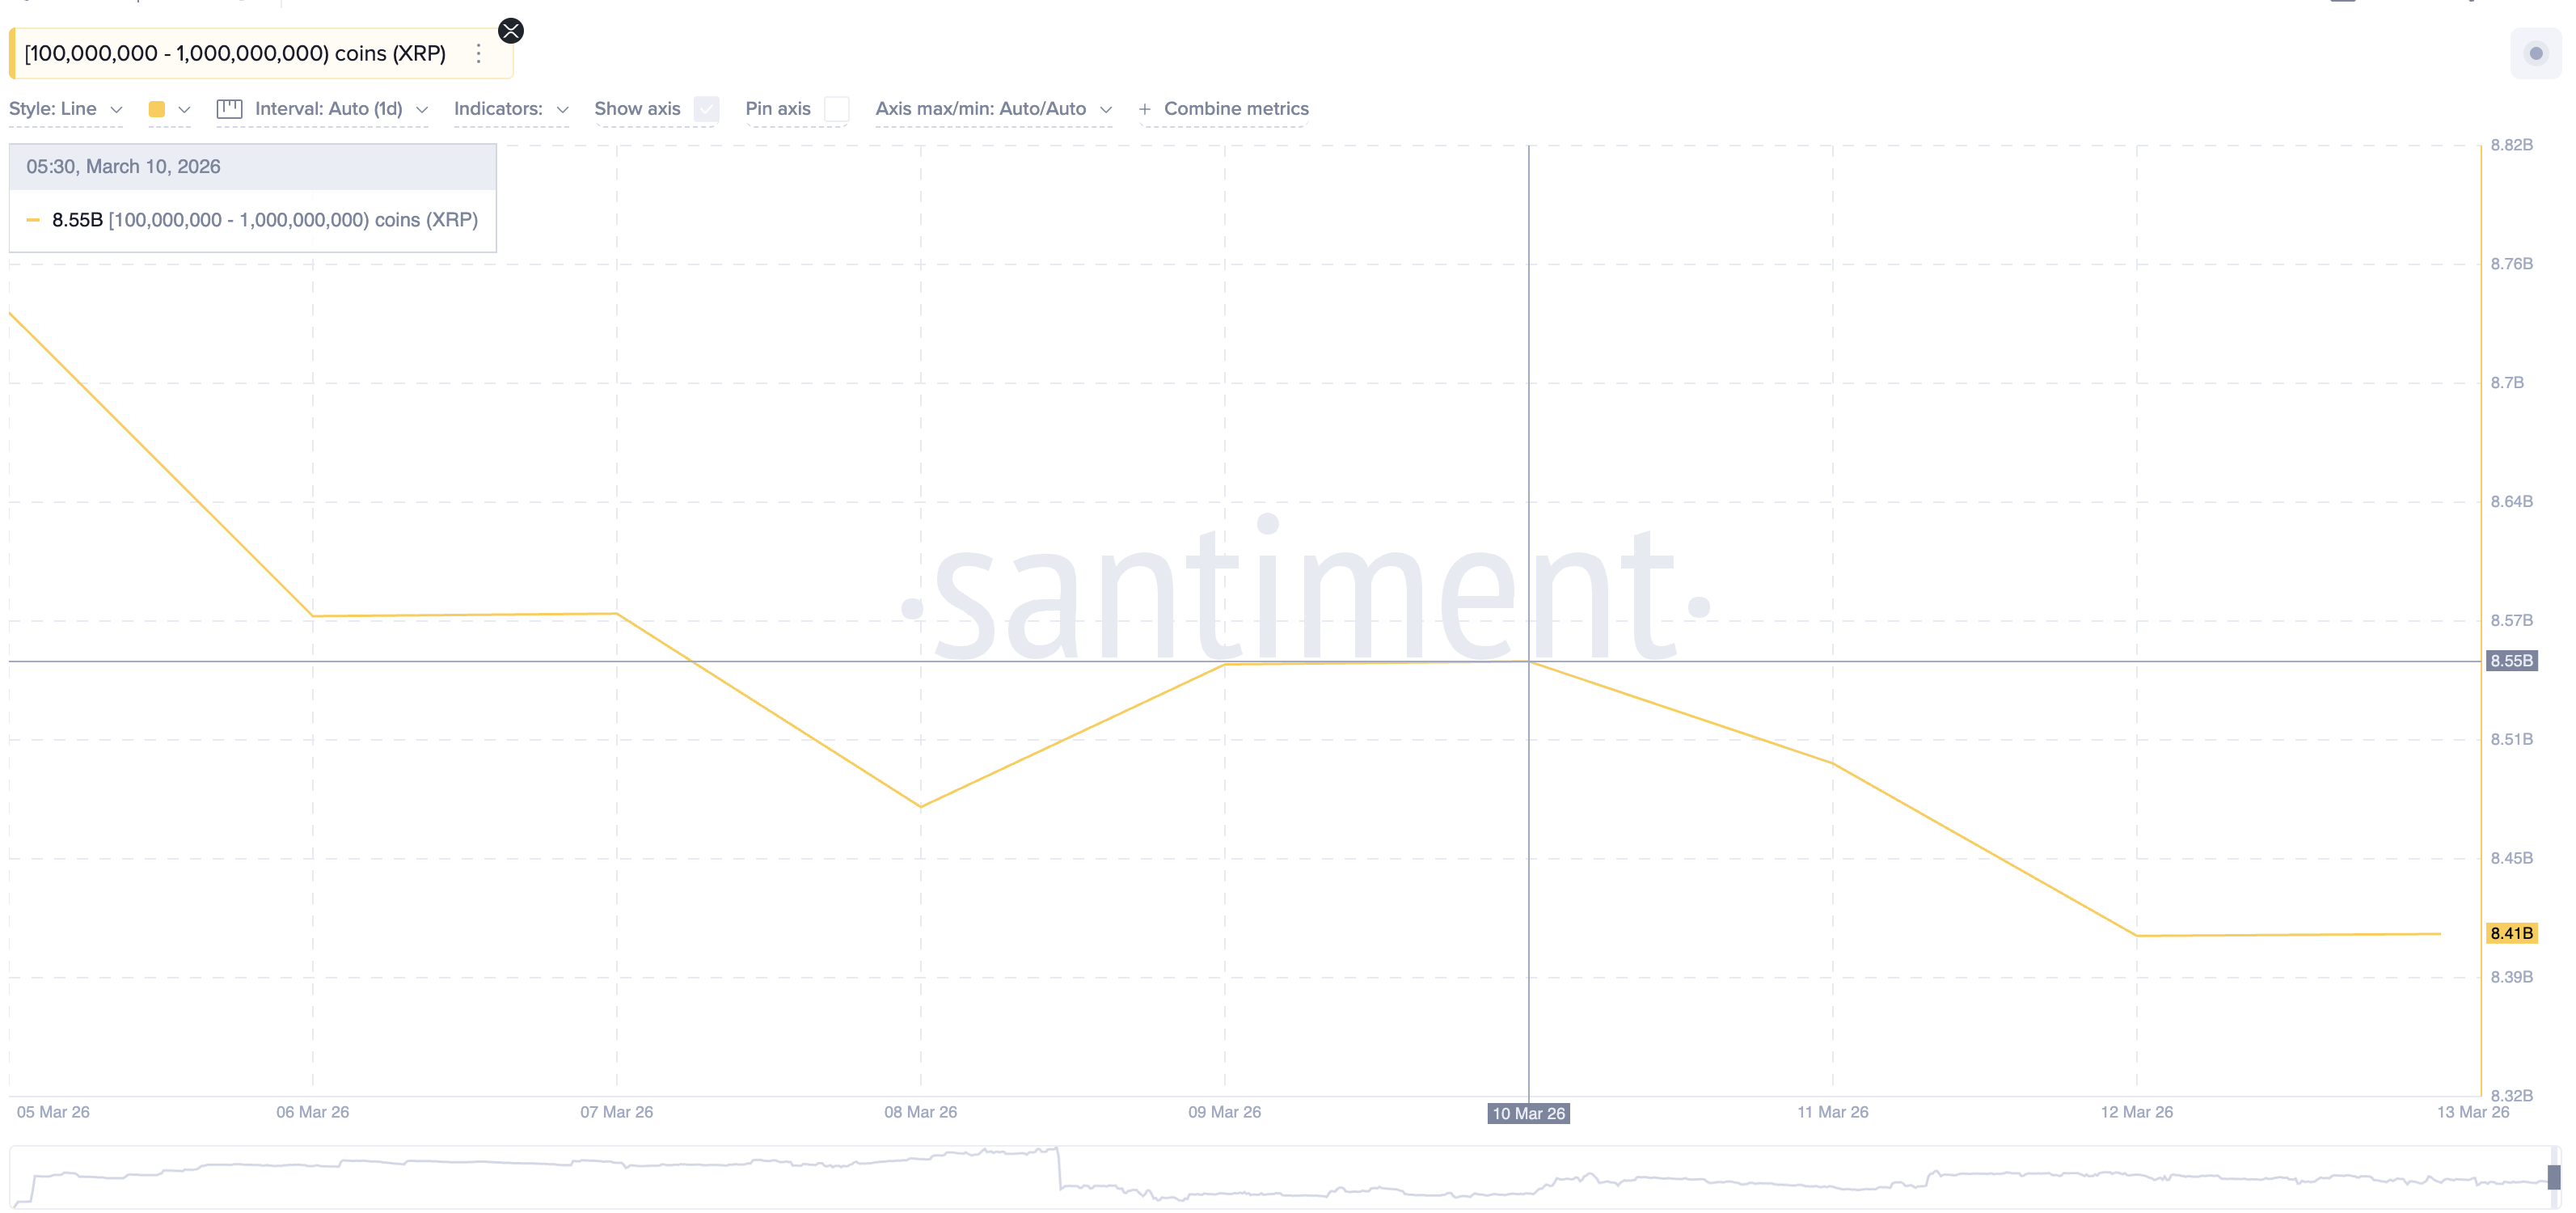
Blockchain data shows that one major group of XRP whales has been behaving differently from the broader market. Addresses holding between 100 million and 1 billion XRP began reducing their balances around March 10, the same time the right shoulder of the head-and-shoulders pattern formed.
These large holders controlled about 8.55 billion XRP on March 10. Their balances have since declined to around 8.41 billion XRP.
That means whales have distributed roughly 140 million XRP, a drop of about 1.6% in their holdings. Interestingly, the selling slowed after March 12, when balances stabilized near the same level. This suggests whales may now be in a wait-and-see mode rather than aggressively buying into the current rebound.
The timing is notable because their selling began exactly when the bearish pattern appeared on the chart. In other words, while traders are becoming more optimistic, some of the largest holders seem to be reacting to the technical risk.
XRP Price Levels That Will Decide the Next Move
The next move for XRP will likely depend on a few critical price levels.
The first key resistance sits near $1.44. A sustained move above this level would weaken the right shoulder structure. A stronger breakout above $1.47 would invalidate the head-and-shoulders pattern entirely and signal a potential continuation of the bounce. On the downside, $1.40 now acts as the first major support level.
If XRP falls below that level, the next downside targets appear near $1.34 and $1.31. The latter represents the neckline of the bearish pattern.
A breakdown below $1.31 could activate the head-and-shoulders structure and expose a potential 10% decline toward roughly $1.19 and even lower.
