

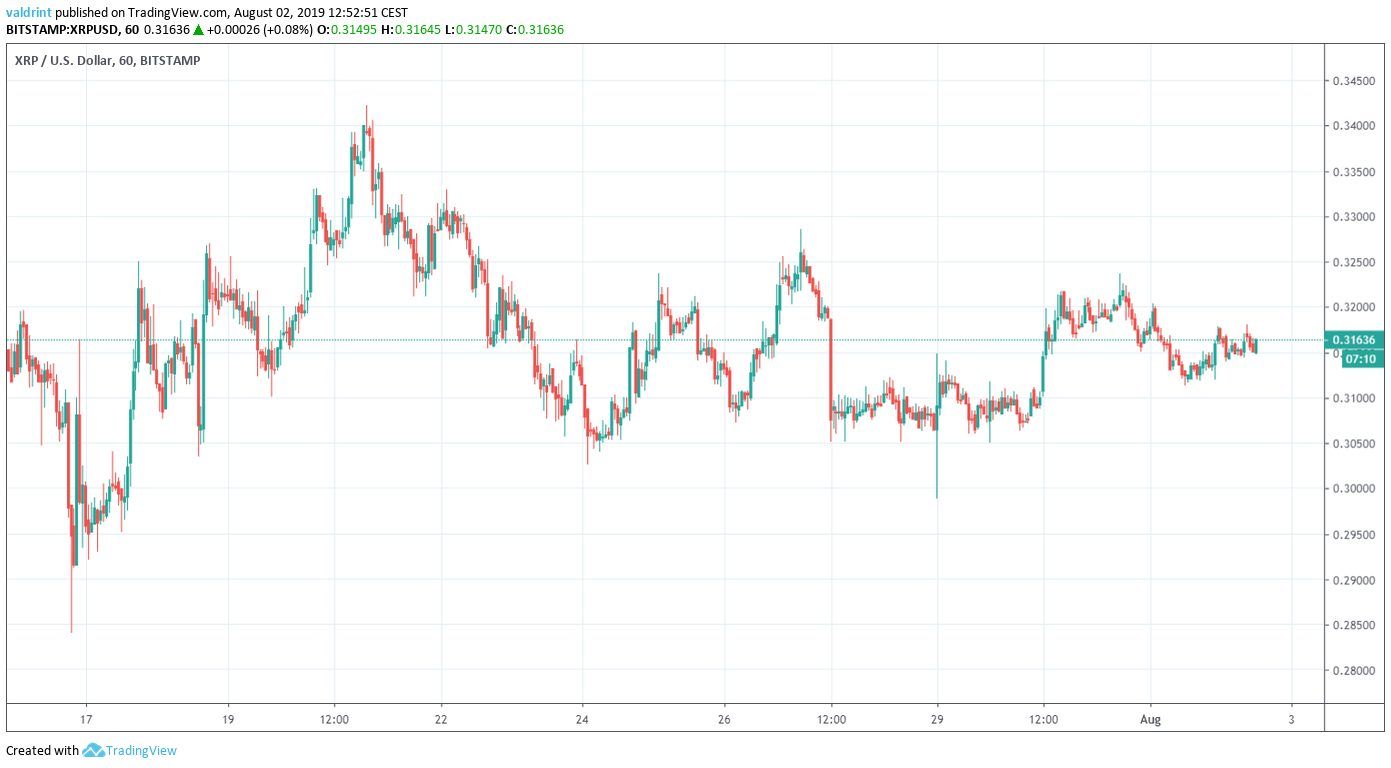
On July 16, 2019, the XRP price reached a low of $0.28. An upward move ensued. By July 20, XRP had reached a high of $0.34. It has been decreasing since, trading inside a range between $0.305 and $0.33.
 Will XRP break down below $0.30 or will an upward move begin? In order to answer this question, we have analyzed the XRP price in different time-frames alongside technical indicators.
For our previous analysis, click here.
Interested in trading XRP? How about getting free Newcastle tickets? Follow this link to get a free StormGain account with the chance to win tickets!
Will XRP break down below $0.30 or will an upward move begin? In order to answer this question, we have analyzed the XRP price in different time-frames alongside technical indicators.
For our previous analysis, click here.
Interested in trading XRP? How about getting free Newcastle tickets? Follow this link to get a free StormGain account with the chance to win tickets!
XRP Price: Trends and Highlights for August 2
- XRP/USD is trading inside a descending triangle.
- Daily moving averages are close to making a bullish cross.
- It is trading inside a long-term symmetrical triangle.
- XRP is possibly following a bearish fractal.
Current Pattern
A look at the two-hour time-frame shows that XRP has been trading inside a descending triangle. The descending triangle is considered a bearish pattern, making a price breakdown more likely. Both the support and resistance lines have been touched three times.
At the time of writing, the XRP price was trading in the middle of the triangle.
Additionally, the triangle is not projected to end for at least two weeks.
This makes it possible that the price will continue to trade within its confines, devoid of significant volatility.
Let’s take a look at a longer-term time-frame to predict where the price might go next.
Both the support and resistance lines have been touched three times.
At the time of writing, the XRP price was trading in the middle of the triangle.
Additionally, the triangle is not projected to end for at least two weeks.
This makes it possible that the price will continue to trade within its confines, devoid of significant volatility.
Let’s take a look at a longer-term time-frame to predict where the price might go next.
Long-Term Pattern
A look at the daily time-frame shows that the XRP price has been trading inside a symmetrical triangle since August 2018.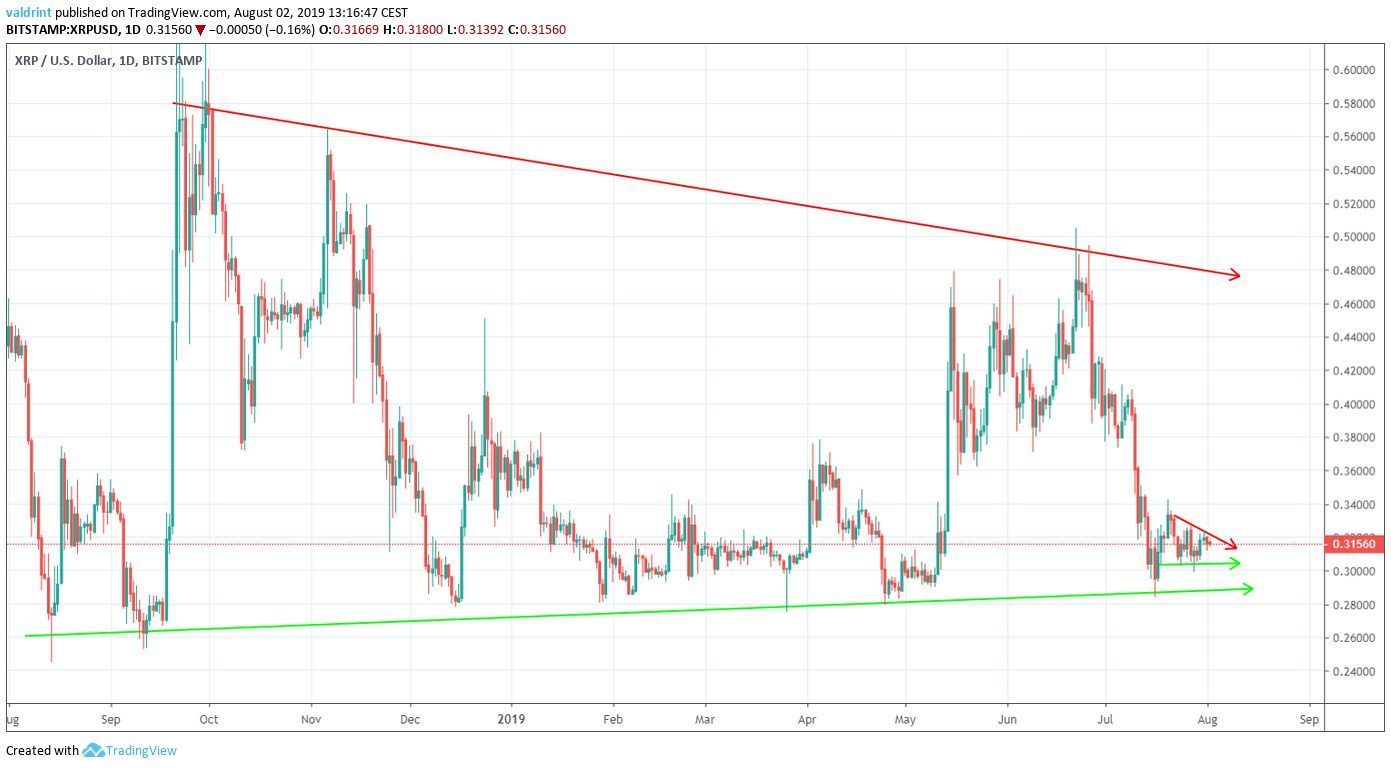 At the time of writing, it was trading very close to the support line, after bouncing from it in the middle of July.
A look at the daily moving averages (MA) shows that they are on the verge of making a bullish cross.
At the time of writing, it was trading very close to the support line, after bouncing from it in the middle of July.
A look at the daily moving averages (MA) shows that they are on the verge of making a bullish cross.
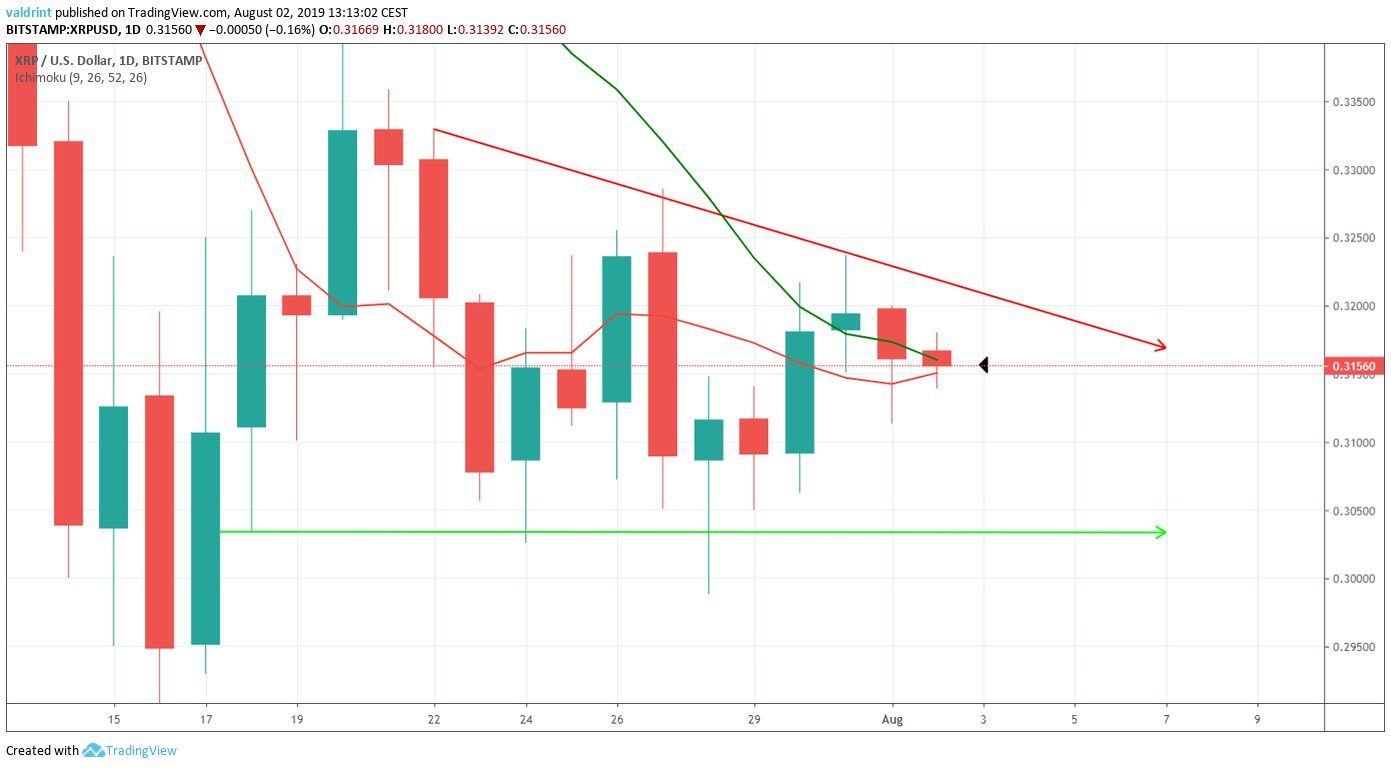 This would likely be a sign that an uptrend has begun.
On the other hand, a rejection of the cross would make a breakdown more likely.
This would likely be a sign that an uptrend has begun.
On the other hand, a rejection of the cross would make a breakdown more likely.
Similarities
A closer look at the daily candlesticks allowed us to identify a possible fractal of the movement inside the triangle. The two time periods are highlighted below.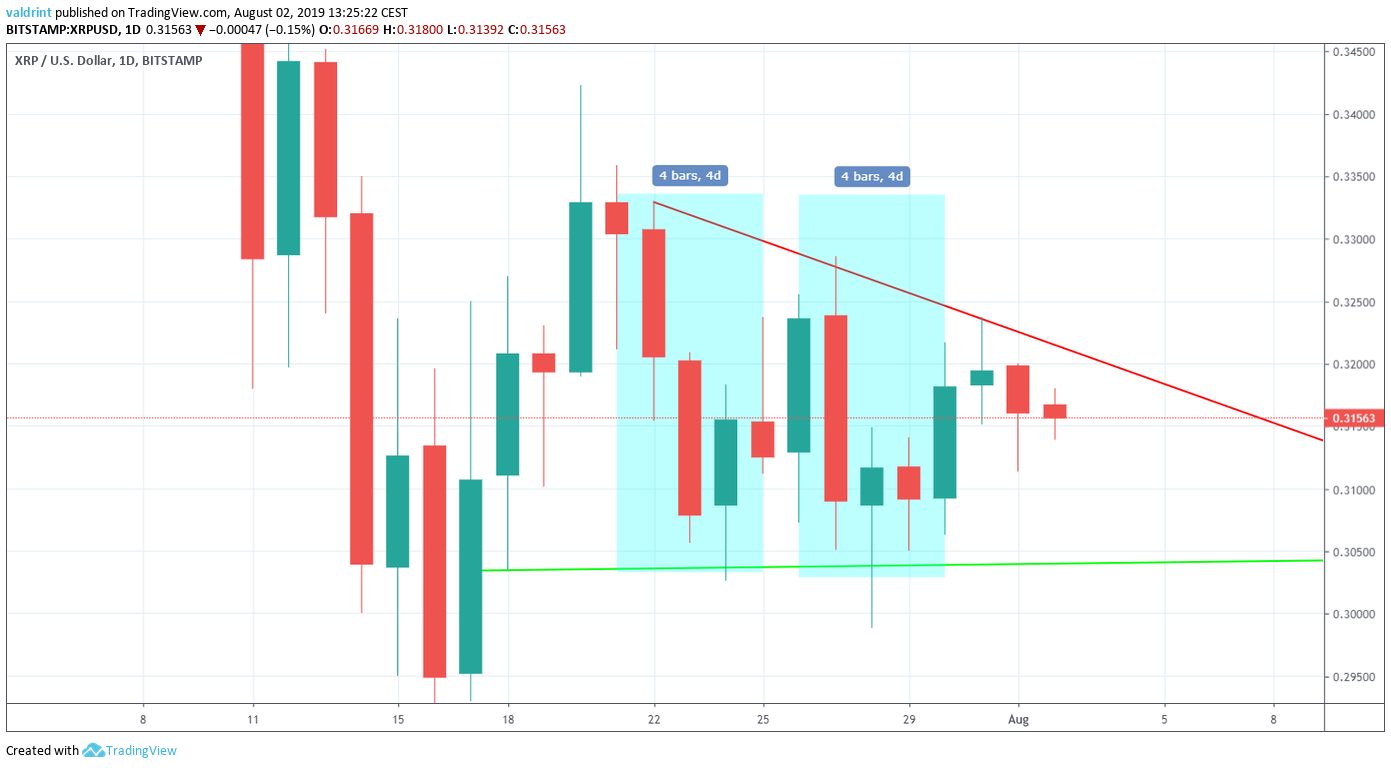 In both cases, once the XRP price reached the resistance line it began a rapid decrease.
Afterward, the ensuing increase was weaker, and once the price reached resistance, it began to decrease again.
A detailed outlook is given below.
In both cases, once the XRP price reached the resistance line it began a rapid decrease.
Afterward, the ensuing increase was weaker, and once the price reached resistance, it began to decrease again.
A detailed outlook is given below.
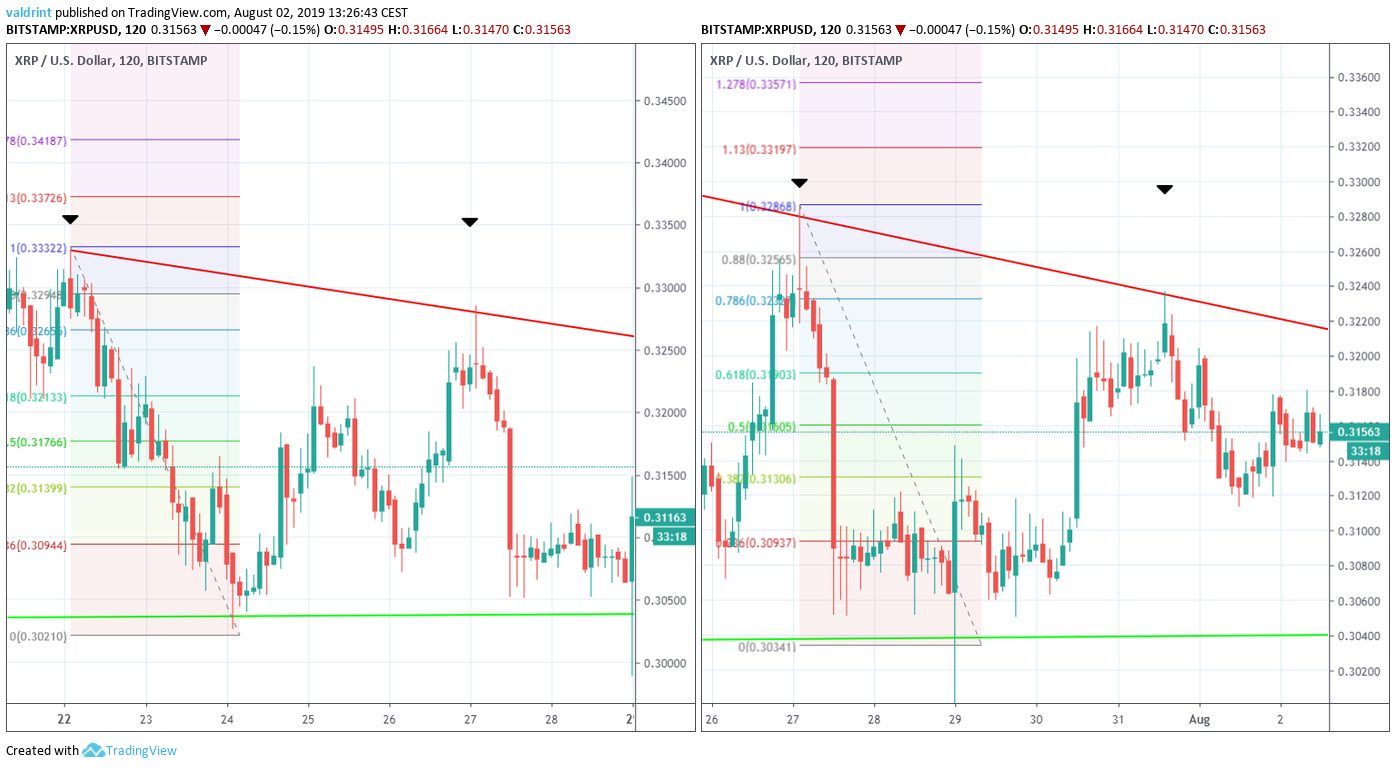 On July 22, the price reached the resistance line (Left) before decreasing all the way to the support line.
Afterward, it began an increase and reached the resistance line. This occurred on July 27. The increase stopped once the price reached the 0.786 fib level.
After reaching the high on July 27 (Right) the price again decreased to the support line.
The ensuing increase took the price to the resistance line on July 31. The line coincided with the 0.786 fib level of the entire drop.
Since then, the price has been decreasing but has not yet reached the support line.
If the price follows a similar pattern, it will do so within the next few days.
On July 22, the price reached the resistance line (Left) before decreasing all the way to the support line.
Afterward, it began an increase and reached the resistance line. This occurred on July 27. The increase stopped once the price reached the 0.786 fib level.
After reaching the high on July 27 (Right) the price again decreased to the support line.
The ensuing increase took the price to the resistance line on July 31. The line coincided with the 0.786 fib level of the entire drop.
Since then, the price has been decreasing but has not yet reached the support line.
If the price follows a similar pattern, it will do so within the next few days.
XRP Price Summary
The XRP price is trading inside a descending triangle. According to our analysis, it is likely to decrease until it reaches the support line of the triangle. Do you think XRP will reach the support line? Let us know in the comments below.Disclaimer: This article is not trading advice and should not be construed as such. Always consult a trained financial professional before investing in cryptocurrencies, as the market is particularly volatile. Images are courtesy of TradingView and Shutterstock.
Disclaimer
In line with the Trust Project guidelines, this price analysis article is for informational purposes only and should not be considered financial or investment advice. BeInCrypto is committed to accurate, unbiased reporting, but market conditions are subject to change without notice. Always conduct your own research and consult with a professional before making any financial decisions. Please note that our Terms and Conditions, Privacy Policy, and Disclaimers have been updated.

Valdrin Tahiri
Valdrin discovered cryptocurrencies while he was getting his MSc in Financial Markets from the Barcelona School of Economics. Shortly after graduating, he began writing for several different cryptocurrency related websites as a freelancer before eventually taking on the role of BeInCrypto's Senior Analyst.
(I do not have a discord and will not contact you first there. Beware of scammers)
READ FULL BIO
Sponsored
Sponsored