
On July 16, 2019, the XRP price reached a low of $0.28. It initiated an upward move and made a high of $0.34 on 20. This is an increase of roughly 20%. It traded inside this range for a period of 29 days. On August 14, it broke down.
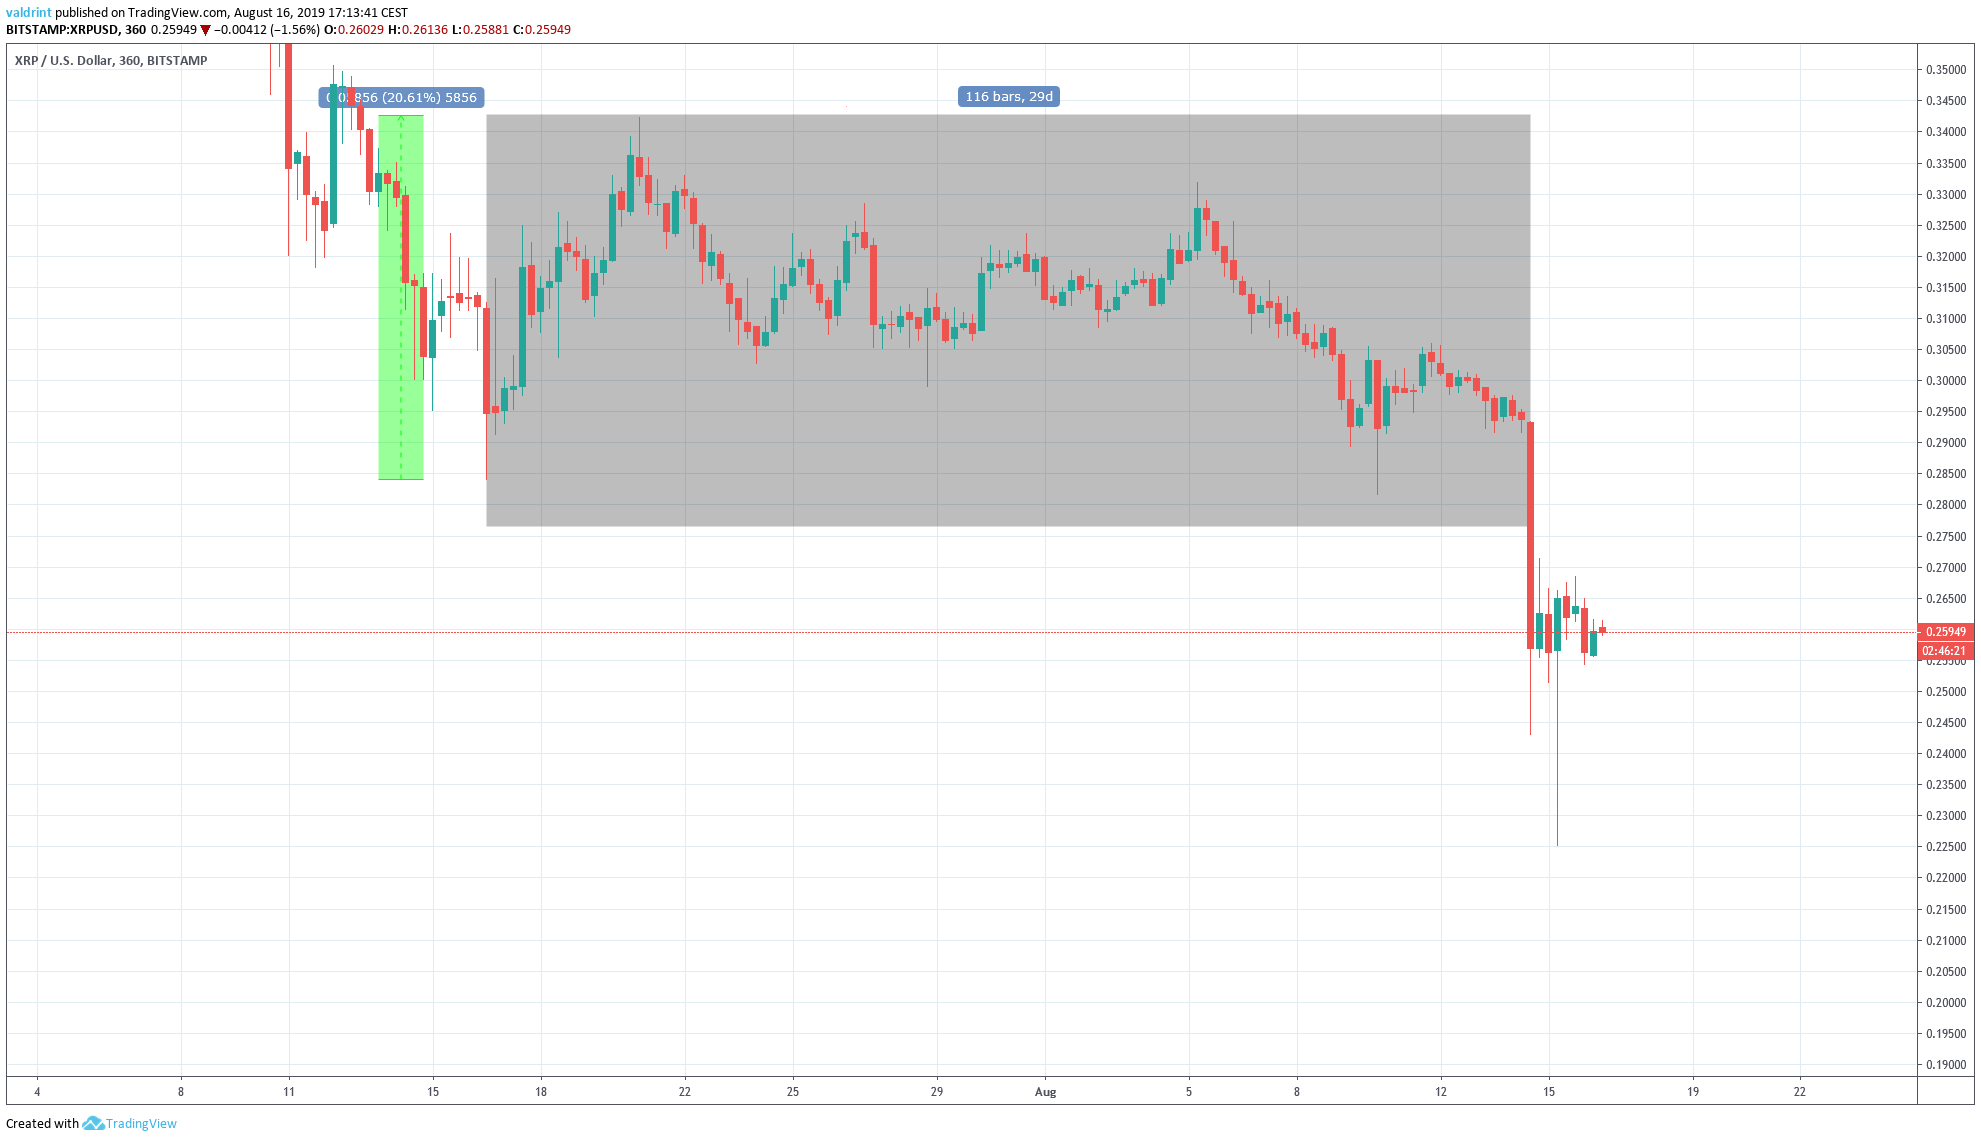
At the time of writing, it was trading at $0.26.
Where will the XRP price go next? Continue reading and find out.
For our previous analysis, click here.
Interested in trading cryptocurrencies with a multiplier of 100x? Check out our partner exchange, StormGain, to do so!

XRP Price: Trends and Highlights for August 16
- XRP/USD broke down from a descending triangle.
- There is support at $0.16.
- Moving averages suggest the XRP price is likely in a long-term downtrend.
- The price is trading inside a short-term symmetrical triangle.
Previous Movement
A closer look at price movement reveals that since July 16 the XRP price traded inside a descending triangle until it broke down on August 14.
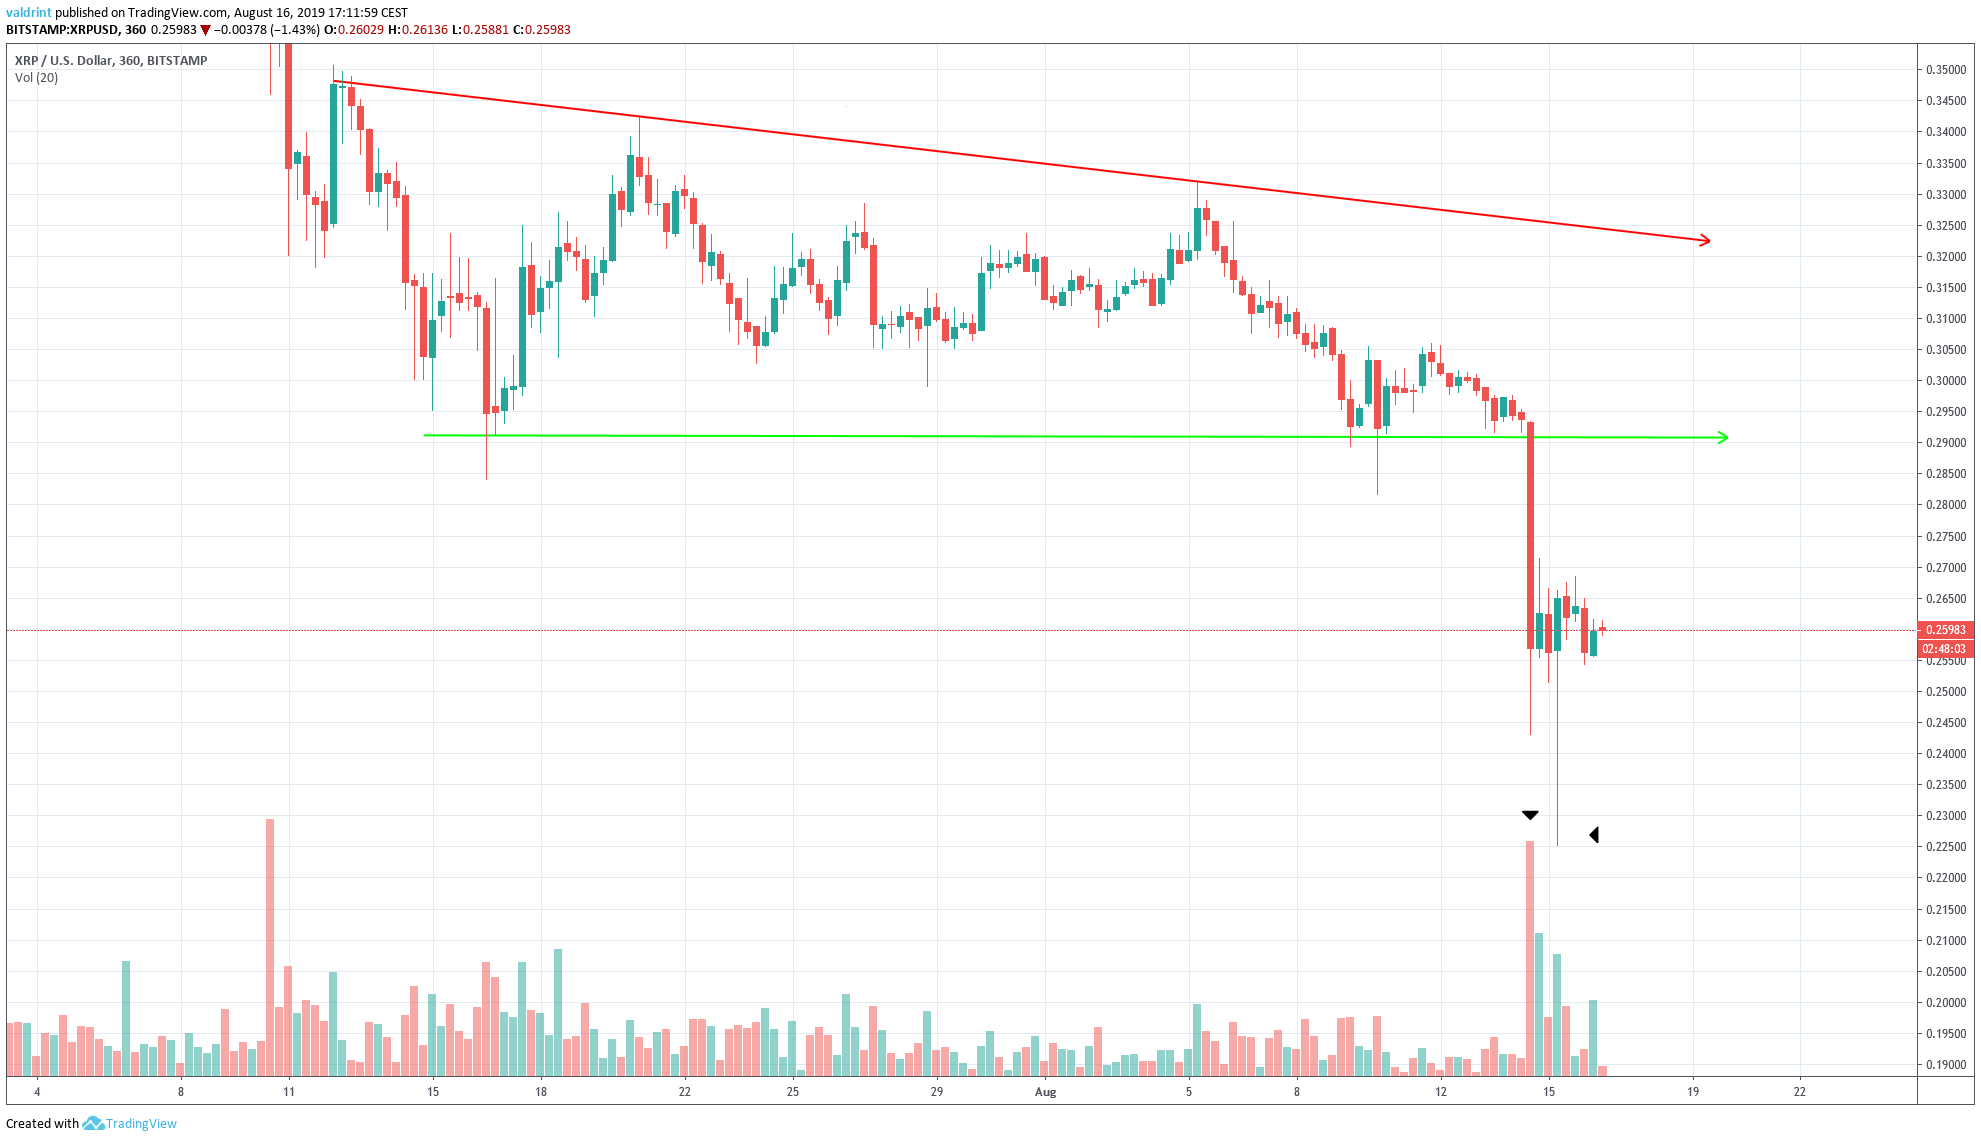
The breakdown occurred with significant volume.
On August 15, the XRP price made a bullish hammer candlestick, which is considered a reversal sign.
However, its volume was relatively small in comparison to the breakdown.
This indicates that if a reversal occurs, it is likely to be a correction in response to the prior movement, rather than the beginning of a new uptrend.
Long-Term Downtrend
A look at the weekly chart shows that the XRP price is trading inside a critical support area.
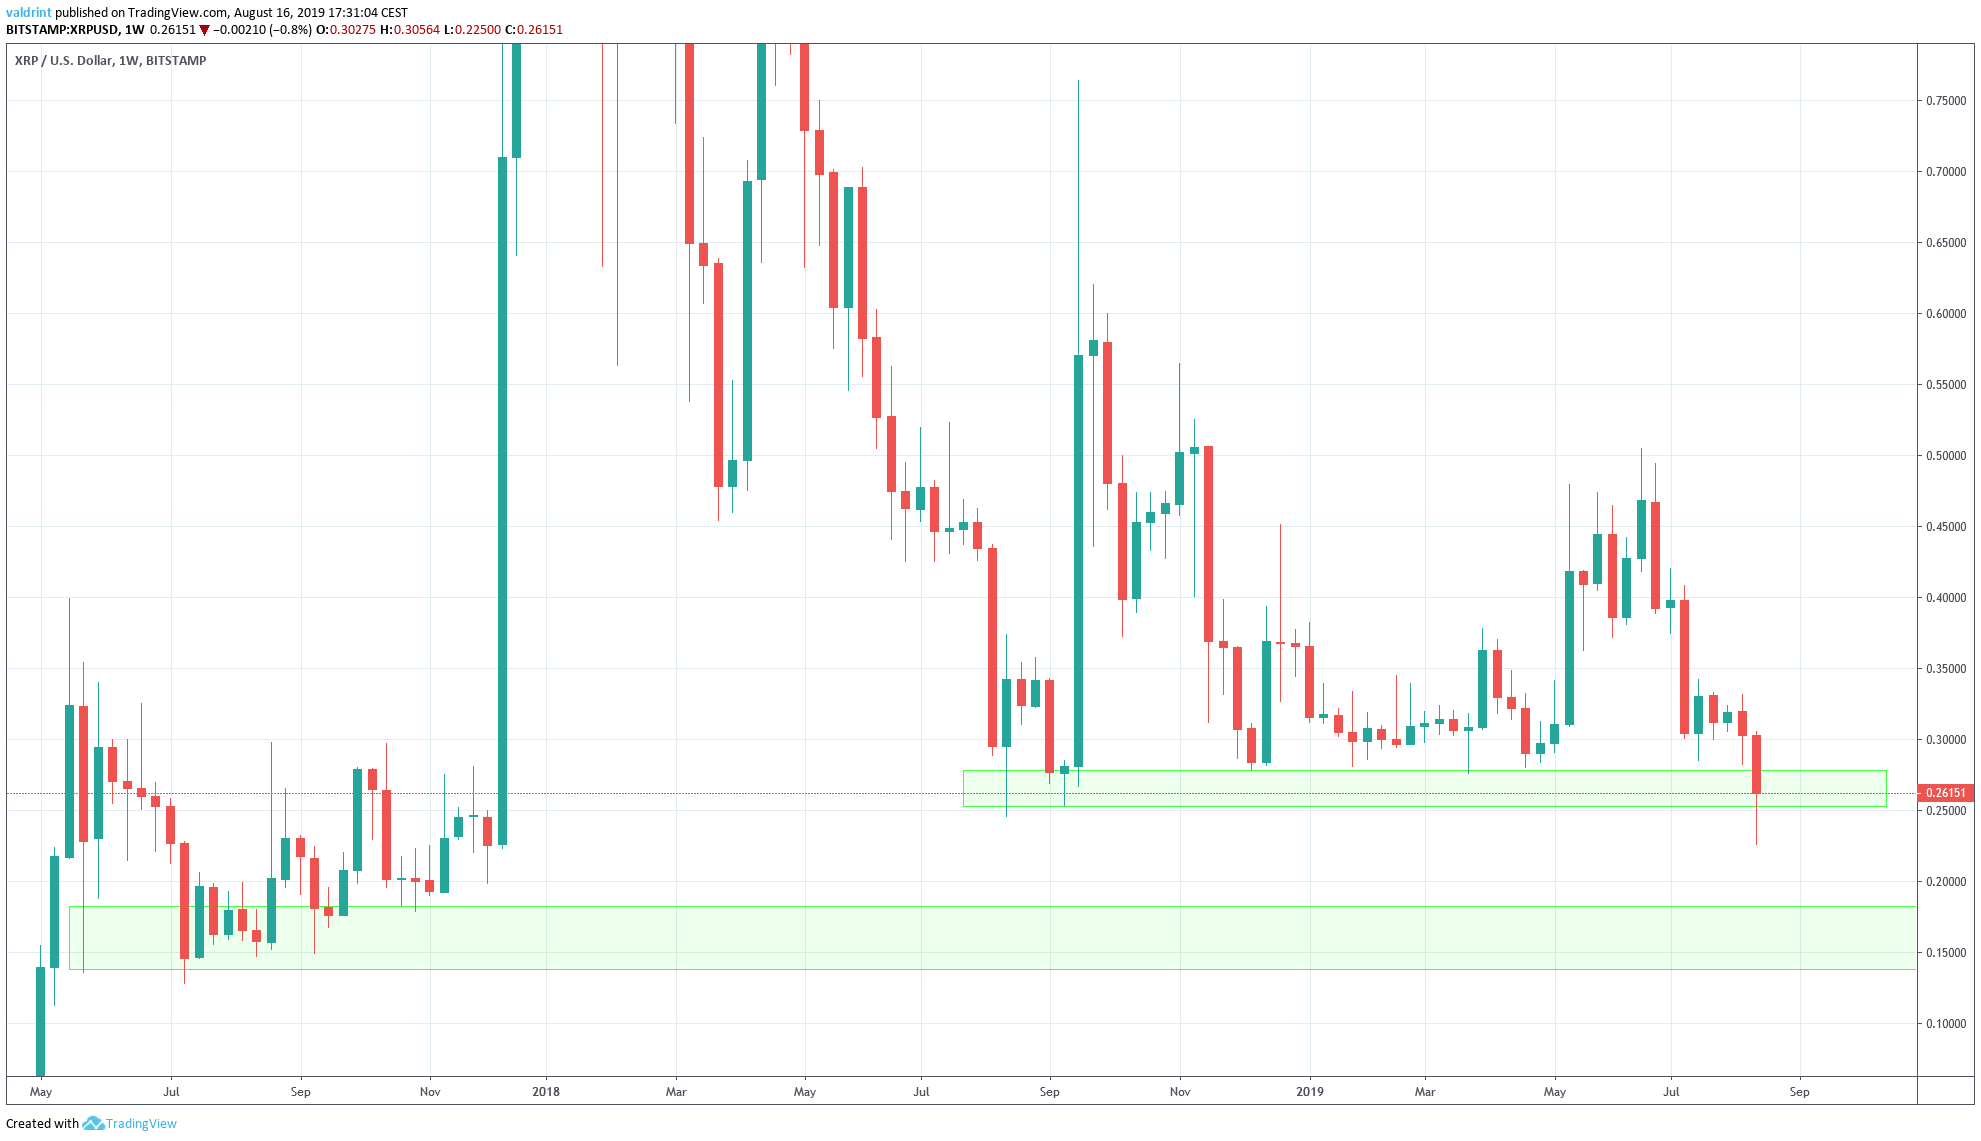
During the breakdown, it reached levels that had not been reached since December of 2017.
However, the weekly candle has yet to close below this support area.
Moving averages suggest that a long-term downtrend has begun.
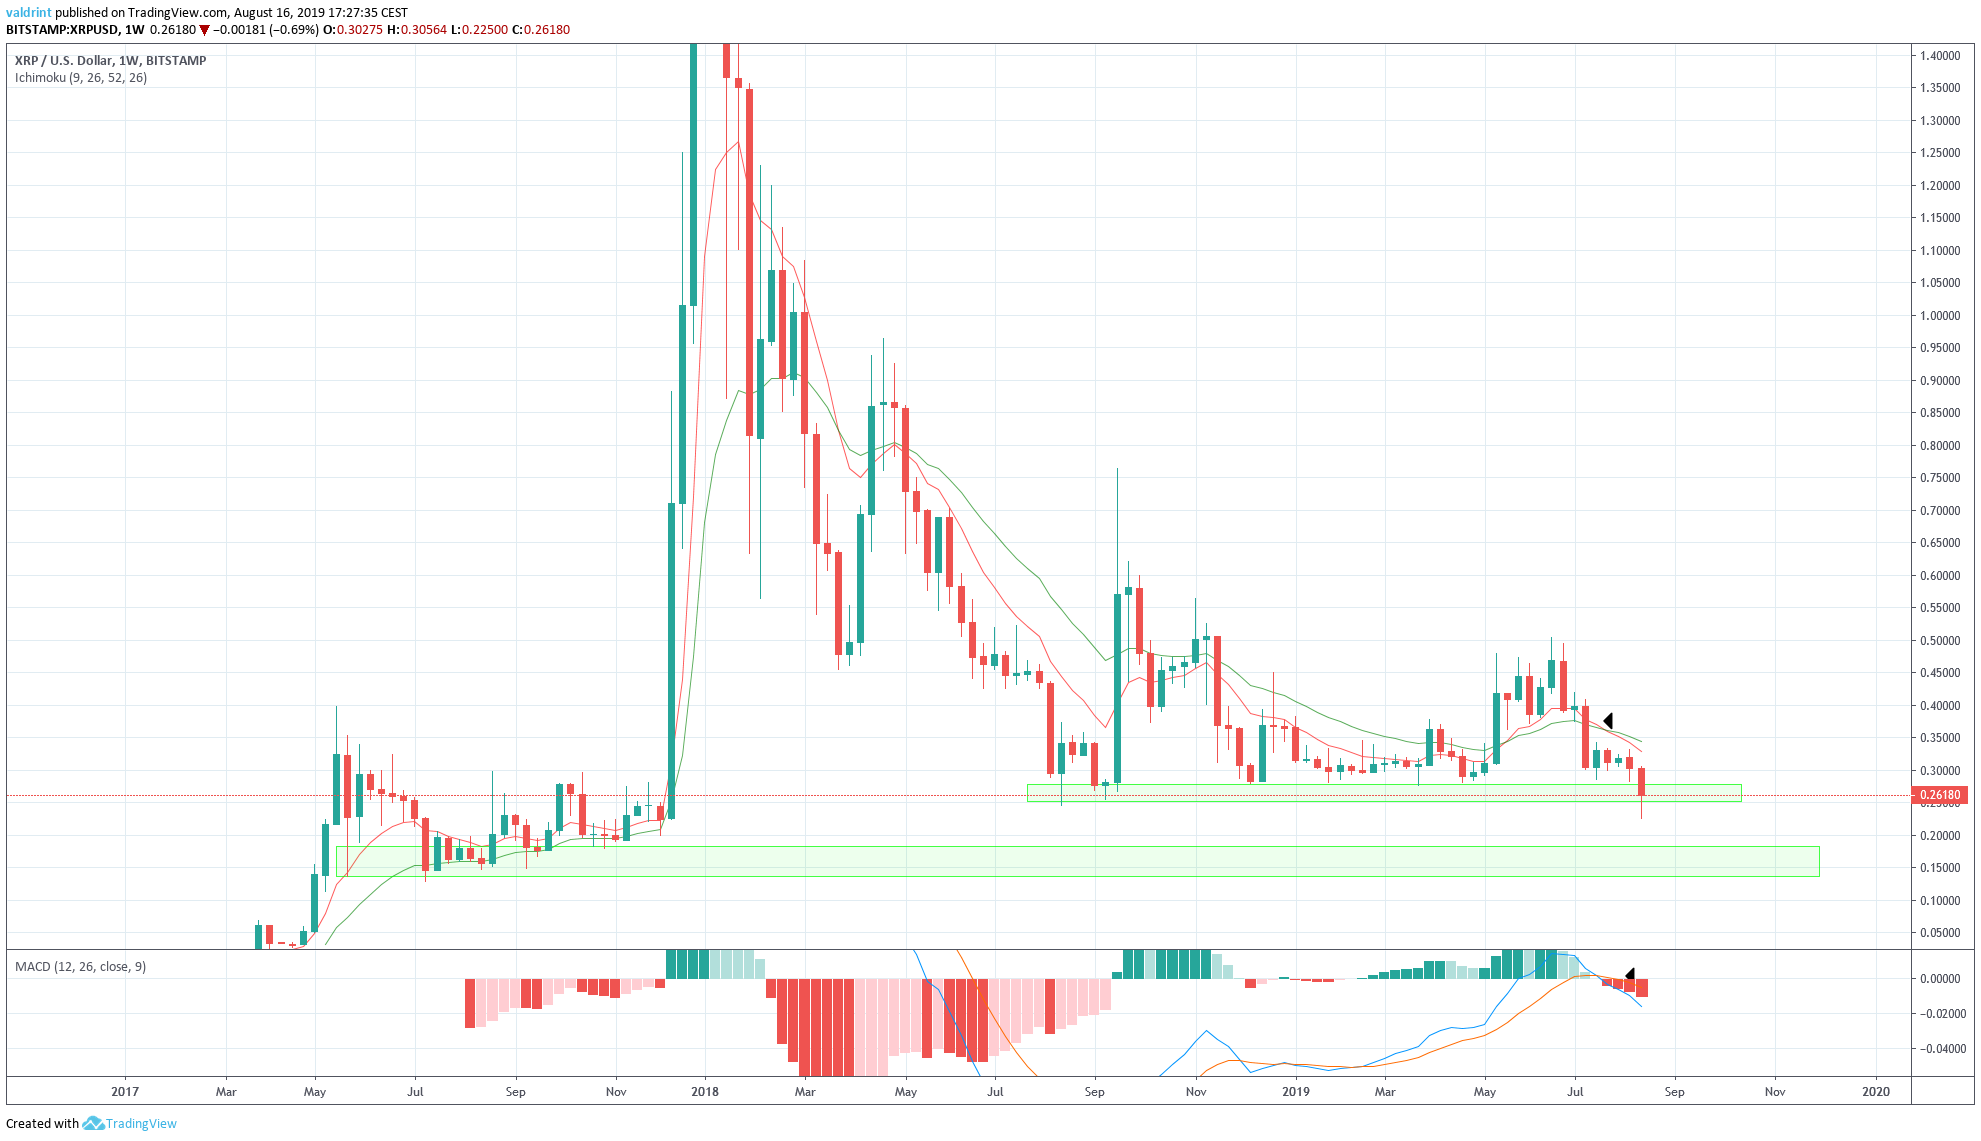
A bearish cross between the 10- and the 20-week moving averages (MA) occurred on, suggesting that a downtrend had begun.
A bearish cross accompanied this in the MACD.
It makes us believe that the XRP price is likely in a long-term downtrend.
Future Movement
Looking closer at the breakdown, we can see that the XRP price is currently trading inside a symmetrical triangle.
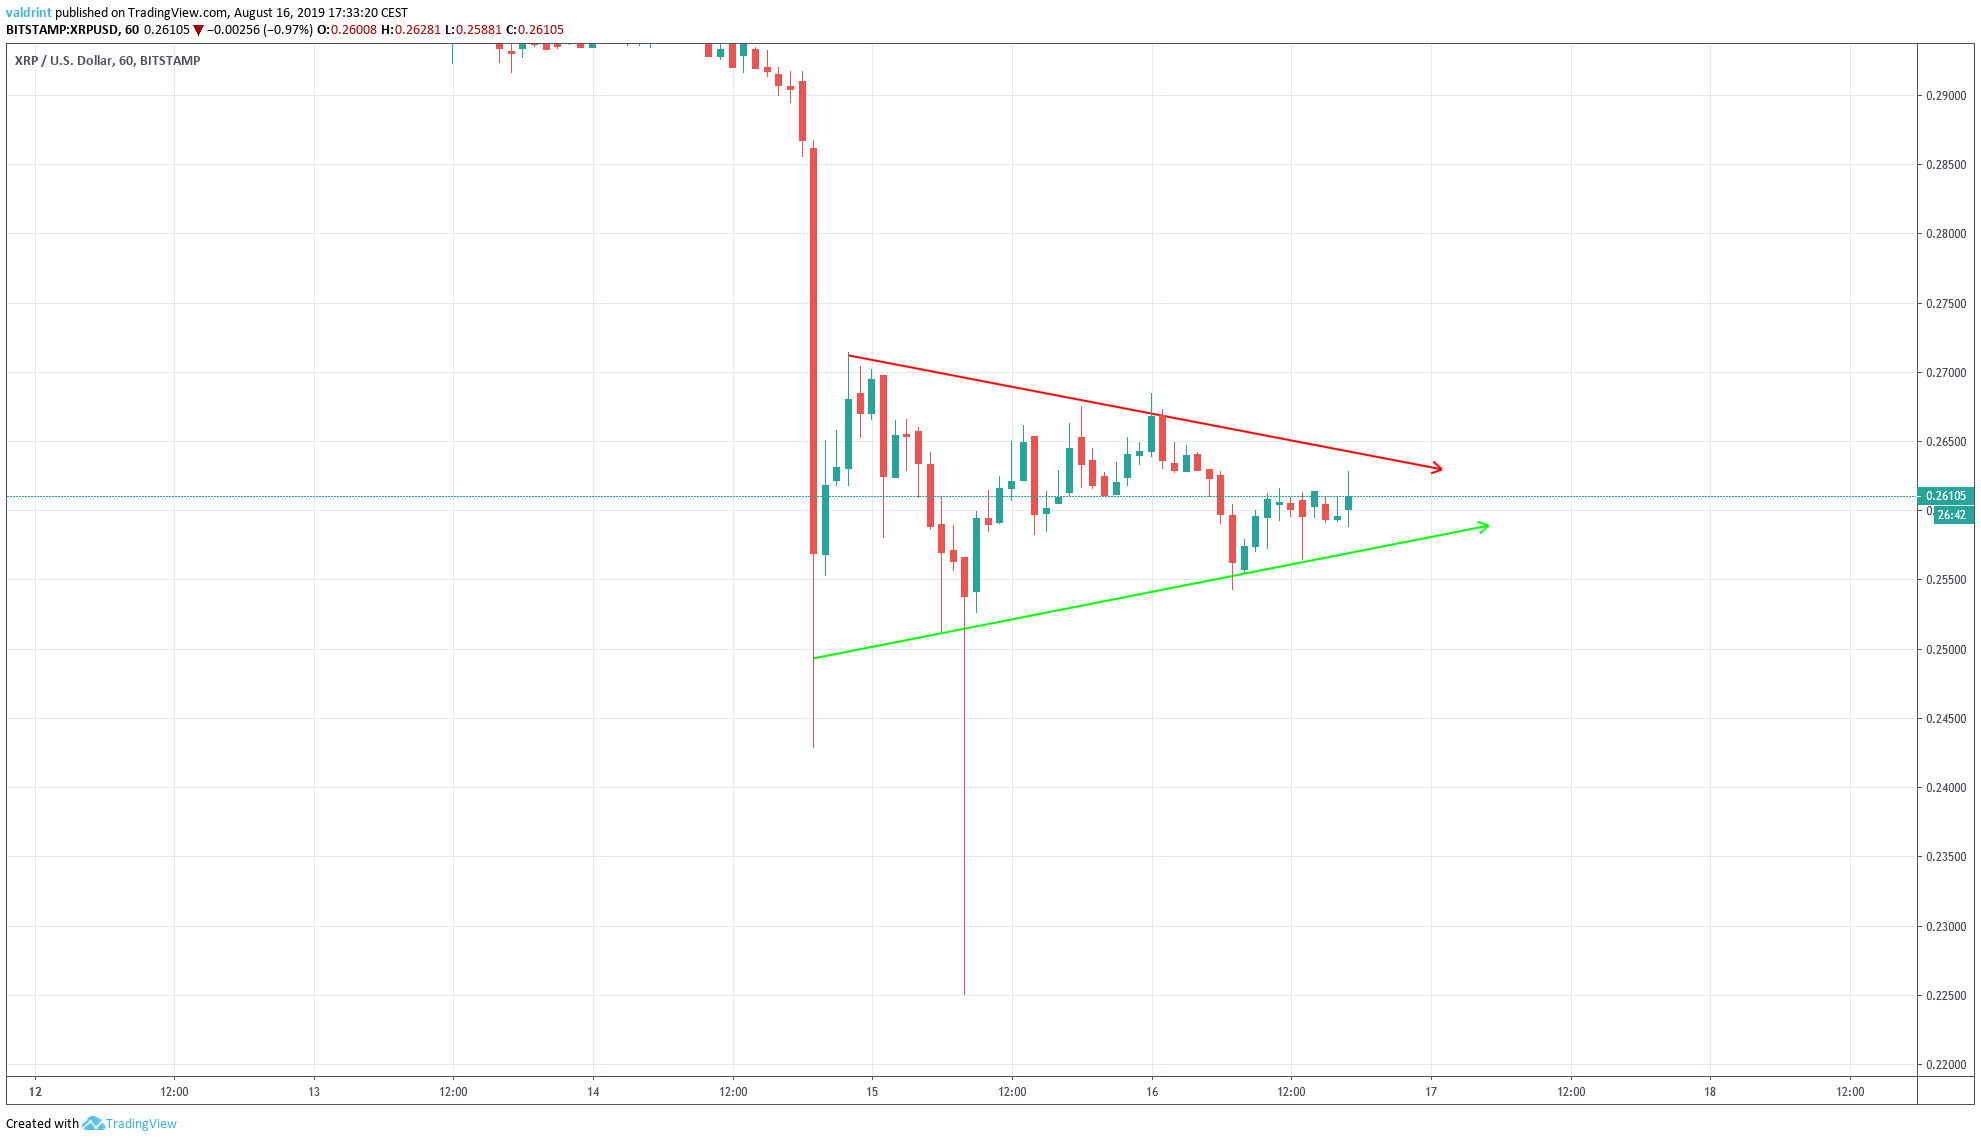
The symmetrical triangle is considered a neutral pattern, but since it has occurred after a downward movement, it is likely to act as continuation one, allowing the XRP price to resume its downward movement.
Therefore, we would expect the price to again move towards $0.24.
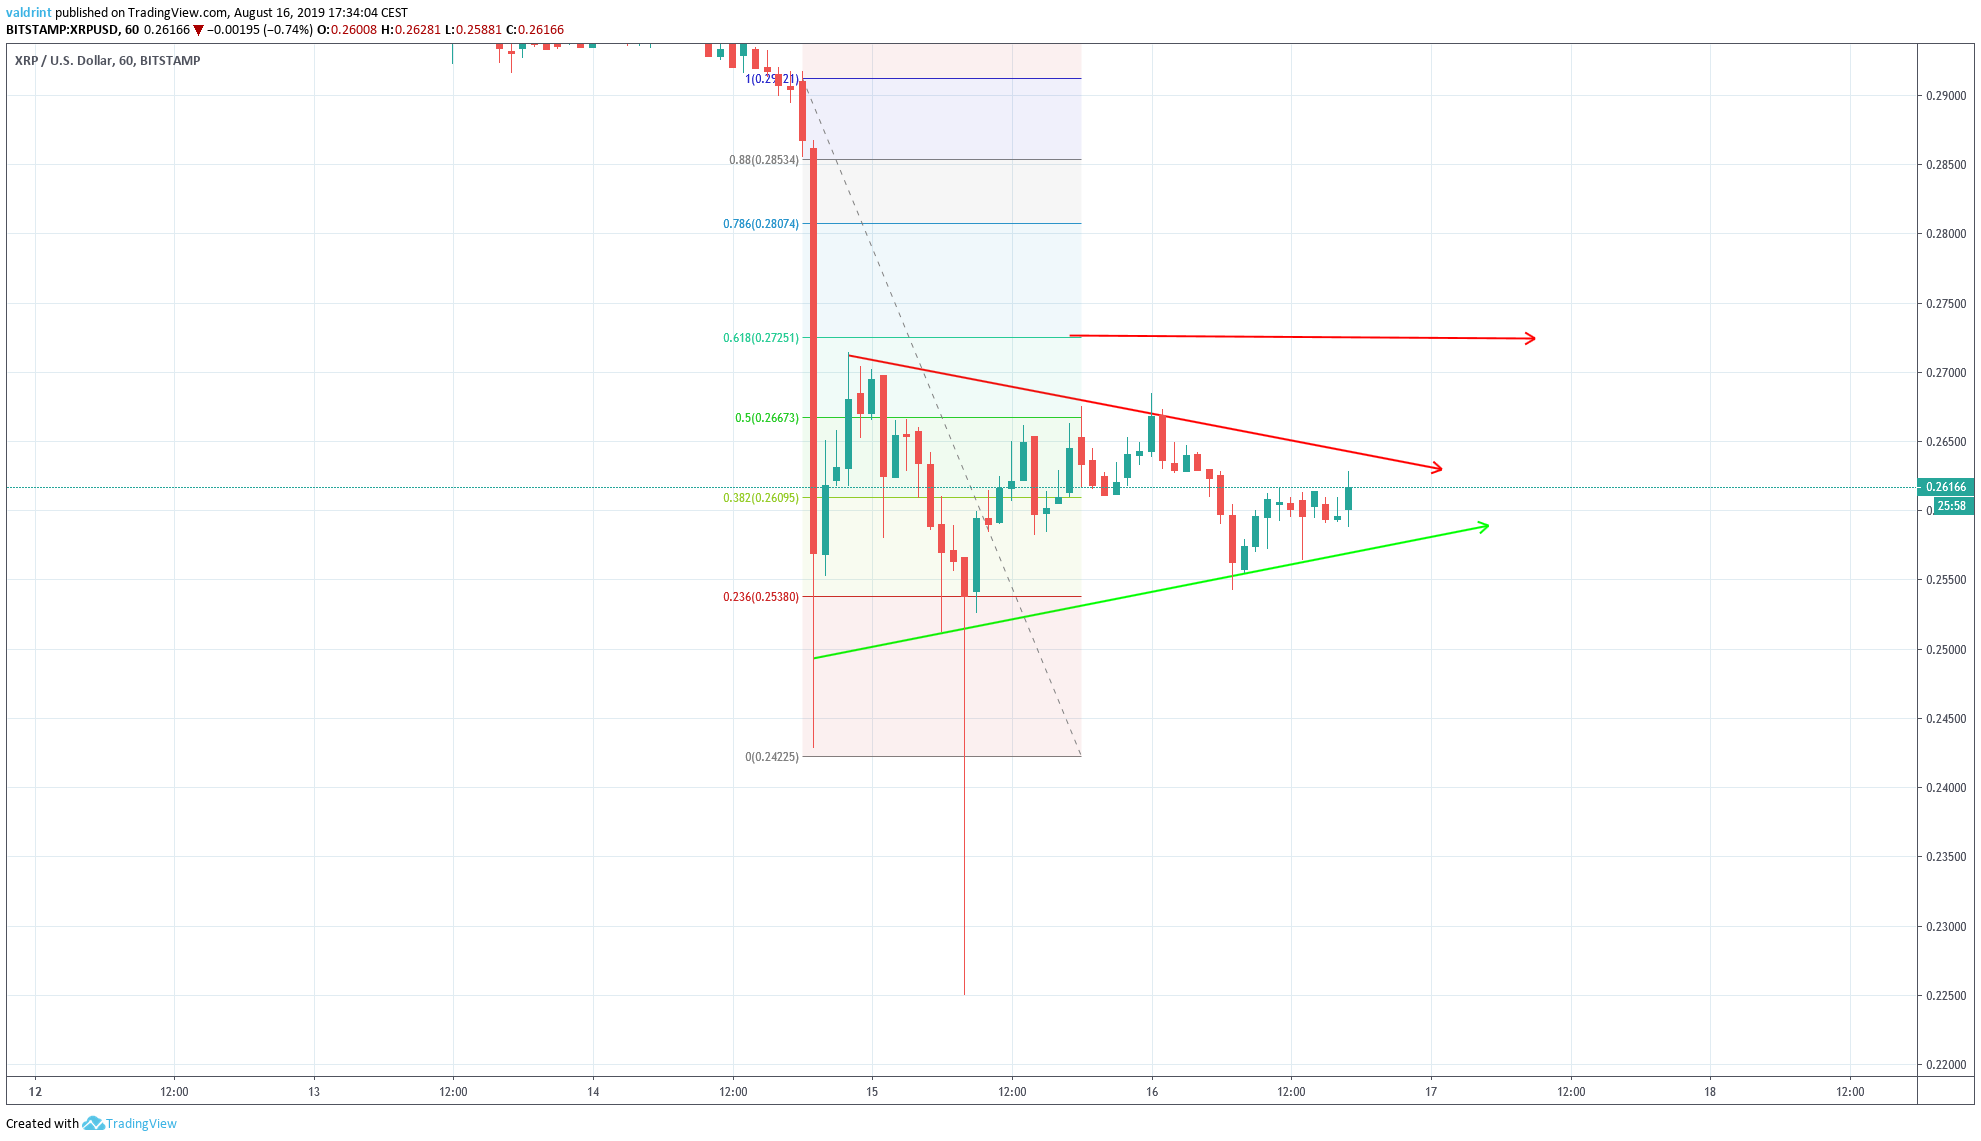
If the price breaks out, it is not likely to increase above $0.275, the resistance provided by the 0.618 fib level near the high of the triangle.
XRP Price Summary
The XRP price broke down below a significant support area.
Based on our analysis, it is likely to eventually reach the support area at $0.16.
For trading intents, while there may be temporary upward moves, we believe that the XRP price is in a long-term downtrend.
This makes opening long positions against the underlying trend difficult and not recommended.
Do you think XRP will reach the support area? Let us know in the comments below.
Disclaimer: This article is not trading advice and should not be construed as such. Always consult a trained financial professional before investing in cryptocurrencies, as the market is particularly volatile.
Images are courtesy of TradingView and Shutterstock.
