
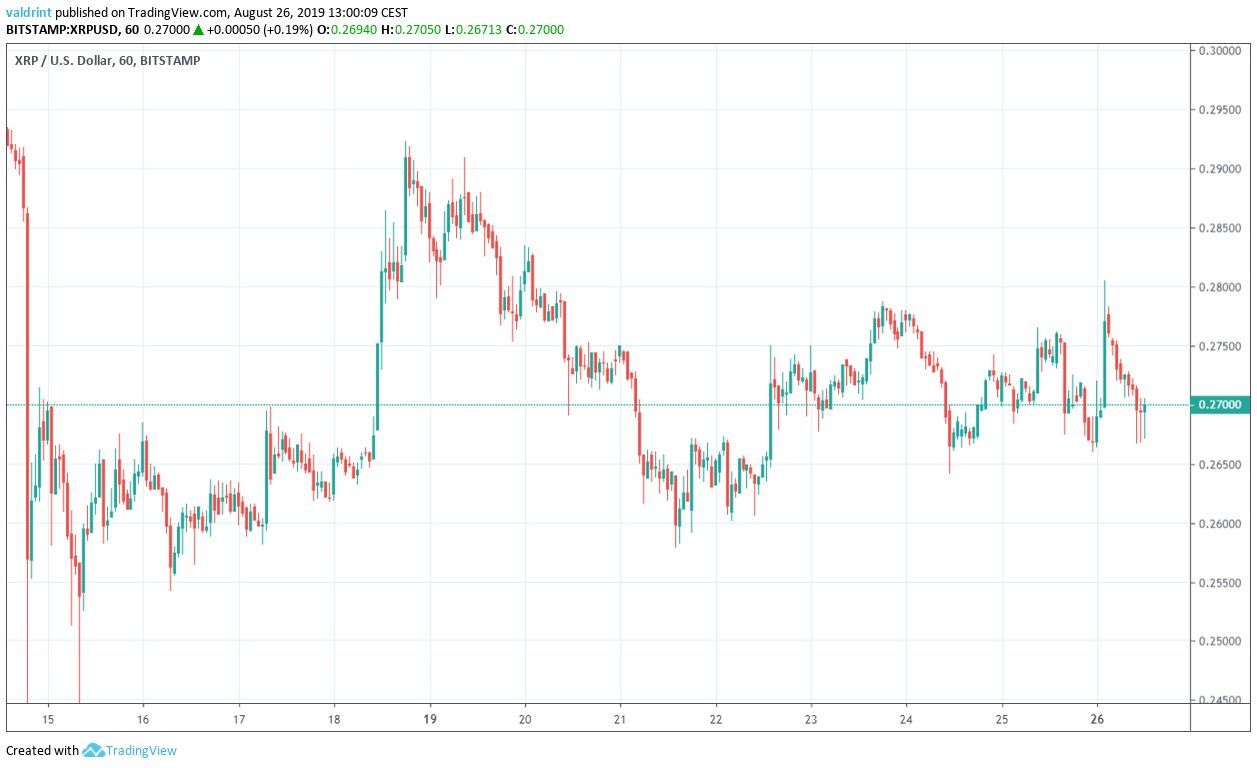
On August 15, 2019, the XRP price reached a low of $0.25. An upward move followed and XRP reached a high of $0.29 on August 18. It has been decreasing since — trading between $0.26-$0.28.
Where will the XRP price go next? Continue reading if you want to find out.
For our previous analysis, click here.
For those of you who prefer a video analysis, please click below:
XRP Price: Trends and Highlights for August 26
- XRP/USD is trading inside a symmetrical triangle.
- XRP is facing resistance from the 10- and 20-day moving averages.
- It previously broke down from a significant support area.
- There is support at $0.245-$0.25.
XRP Price in a Symmetrical Triangle
A look at the hourly time-frame shows that the XRP price has been trading inside a symmetrical triangle since August 15.
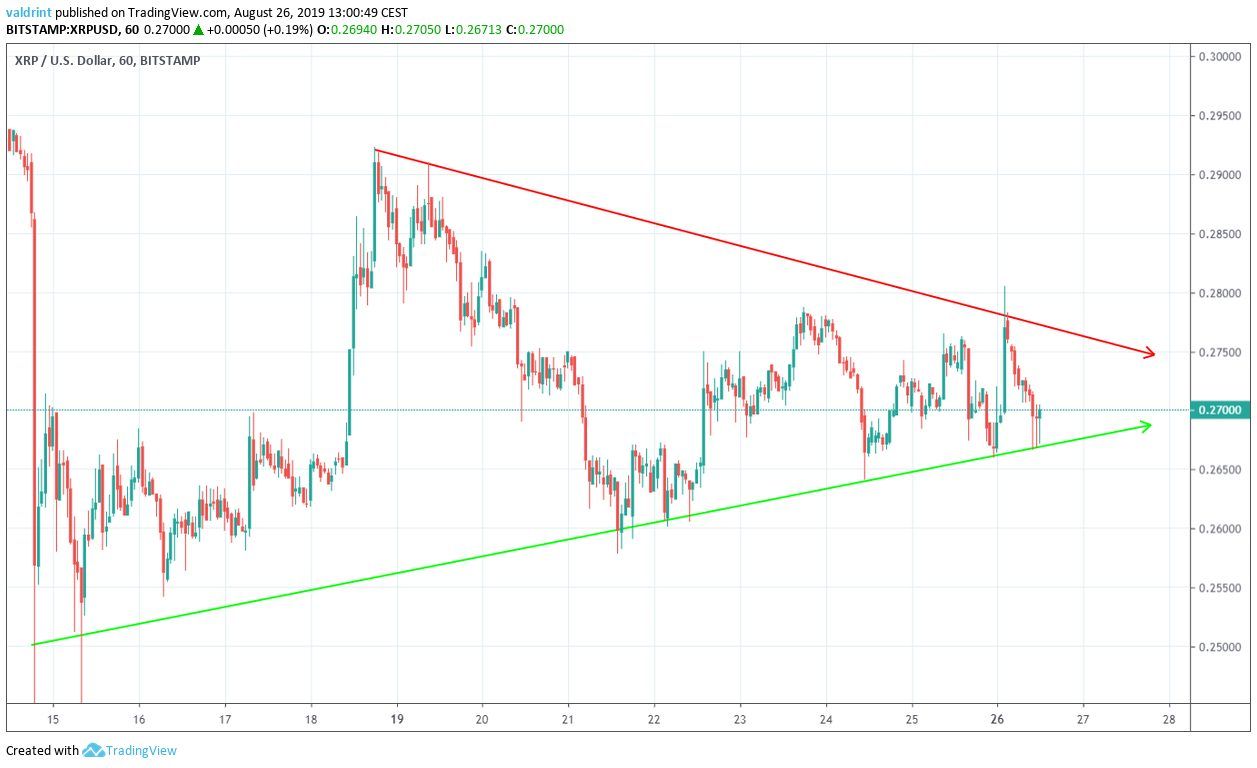
Both the resistance and support lines have been validated several times.
Additionally, the XRP price is rapidly approaching the end of the triangle — at which point a decisive move is likely to occur.
What direction will that take?
Previous Movement
A look at the daily time-frame shows that XRP previously broke down from a horizontal support line on August 14.
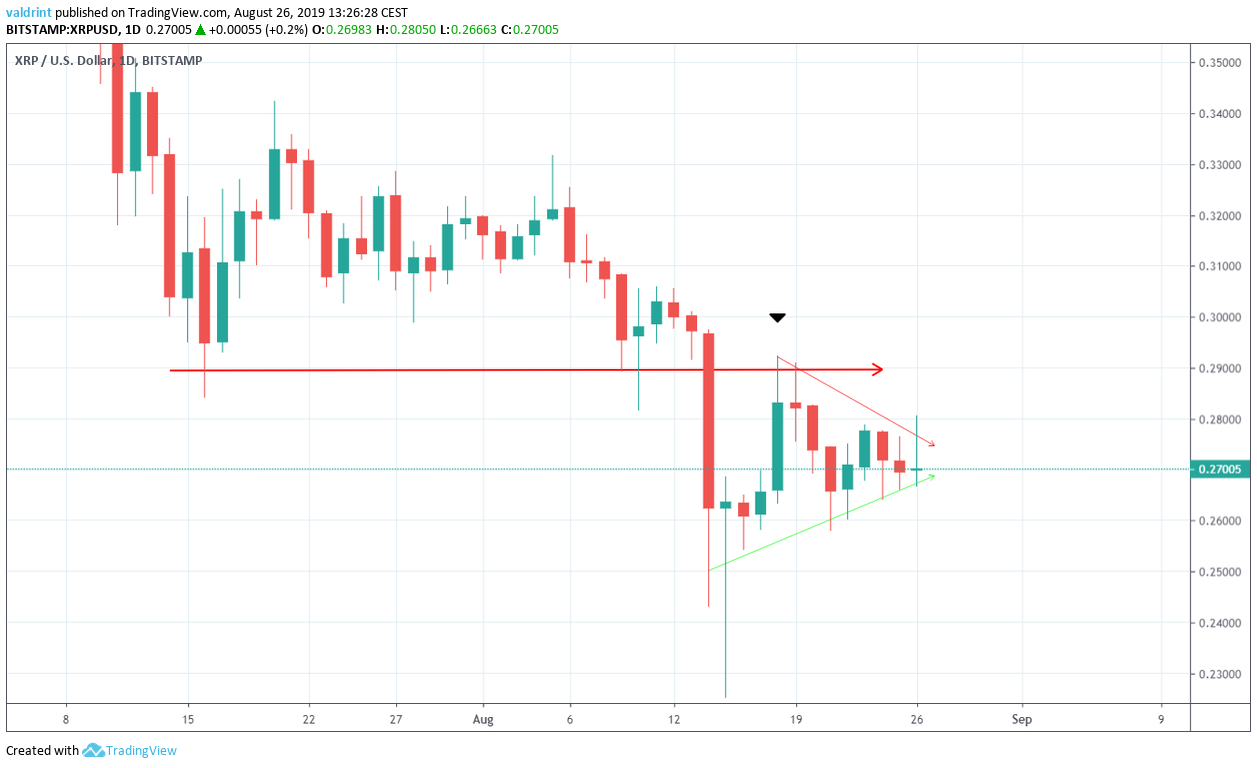
The support line was at $0.29 and is likely to provide future resistance.
The XRP price reached this area on August 18 before being rejected and resuming its downward movement.
The symmetrical triangle is a continuation pattern. Since it is coming after a breakdown, it makes a continuation of that downtrend likely.
This view is supported by a look at the daily moving averages (MA).
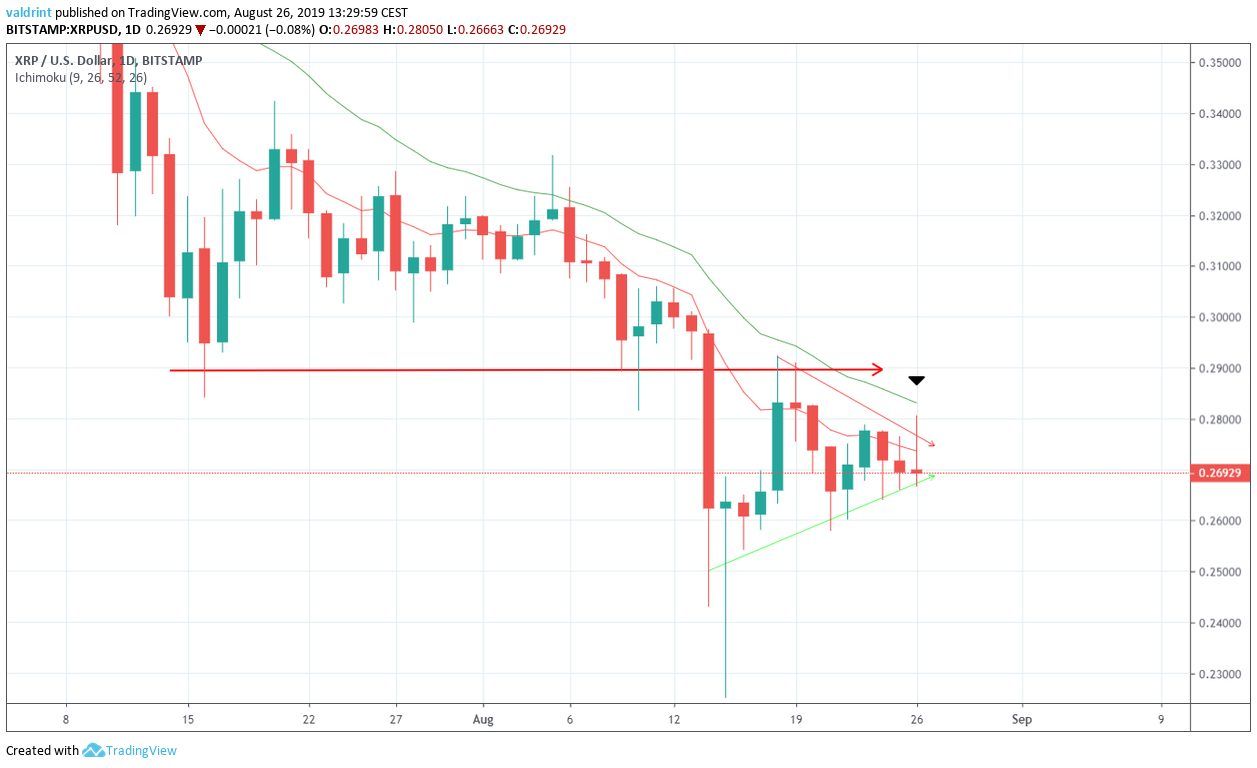
The XRP price is trading below both the 10- and 20-day moving averages.
While it has made attempts at breaking out, they have all been unsuccessful.
Additionally, the 10-day MA shows no signs of wanting to move upward — possible making a bullish cross.
This makes us believe that XRP is likely to breakdown from the triangle.
If it does, where will it go?
Future Movement
In case a breakdown occurs, one support area is outlined below.
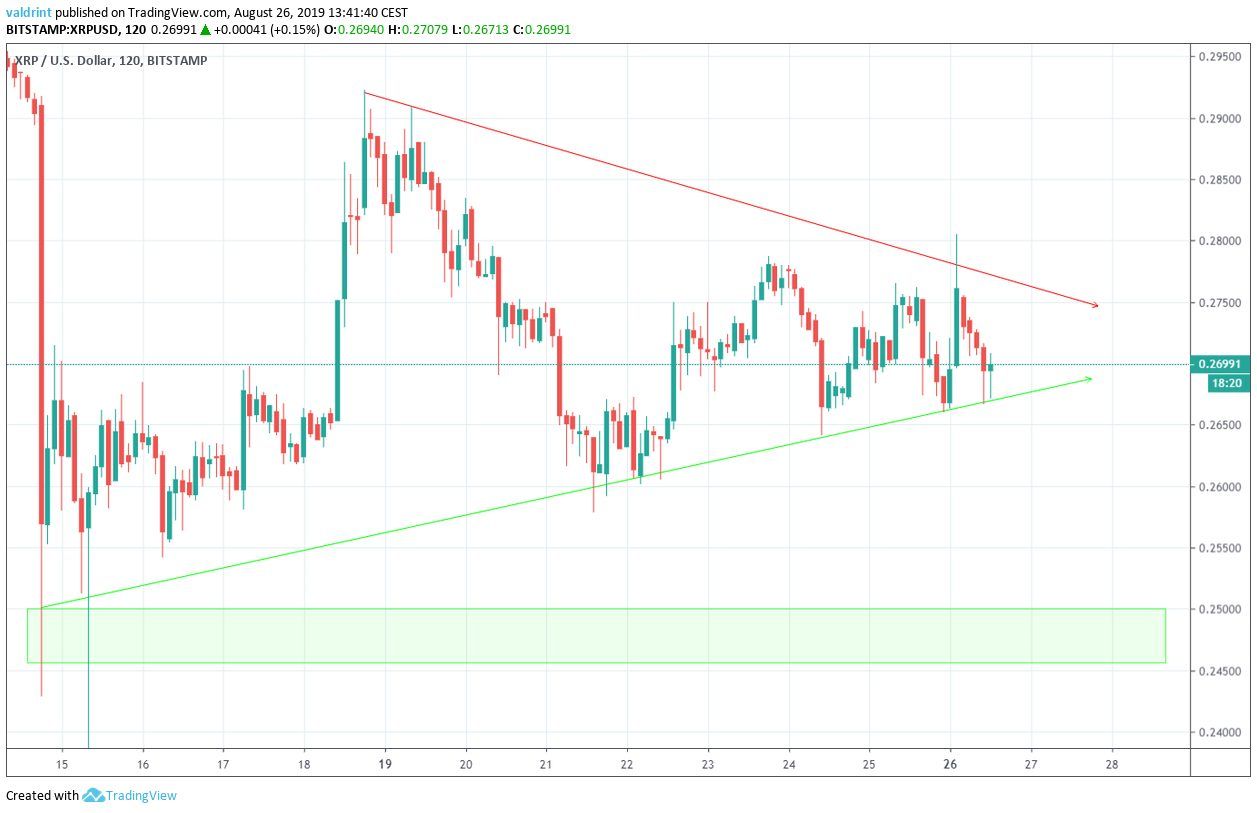
It is found at $0.245-$0.25.
According to our analysis, the XRP price is likely to reach it.
XRP Price Summary
The XRP price is trading inside a symmetrical triangle.
According to our analysis, it is likely to break down.
For trading purposes, we consider XRP a “short” until it reaches the low $0.20s.
Do you think XRP will break down from the triangle? Let us know in the comments below.

Disclaimer: This article is not trading advice and should not be construed as such. Always consult a trained financial professional before investing in cryptocurrencies, as the market is particularly volatile.
Images are courtesy of Shutterstock, TradingView.
