
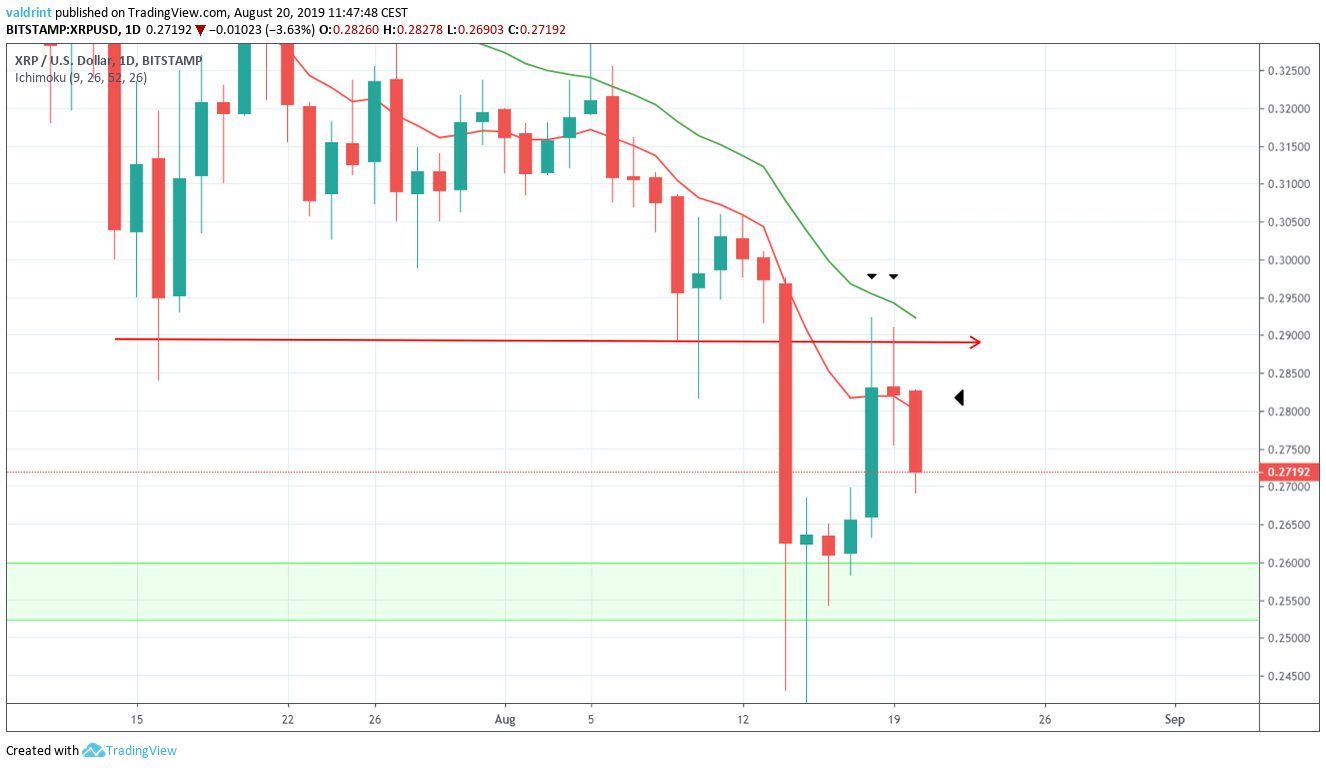
On August 14, 2019, the XRP price reached a low of $0.242. It traded in a range between $0.25-$0.27 until August 18, when the price initiated an upward move. It reached a high of $0.292 the same day, before beginning to decrease.
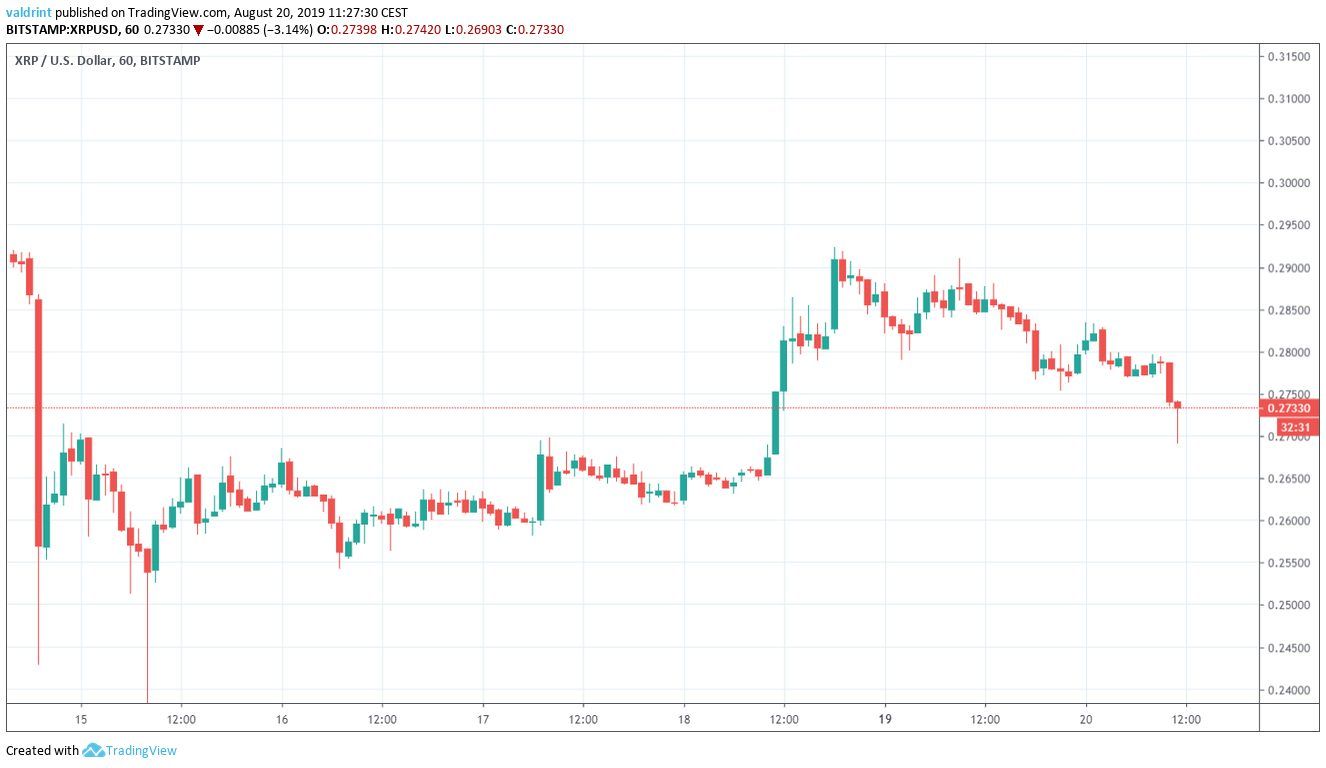
At the time of writing, it was trading close to $0.27.
Where will the XRP price go to next? Continue reading if you want to find out.
For our previous analysis, click here.
Interested in trading cryptocurrencies with a multiplier of 100x? Check out our partner exchange, StormGain, to do so!

XRP Price: Trends and Highlights for August 20
- XRP/USD broke down from a descending triangle.
- The XRP price is potentially trading inside a symmetrical triangle.
- The 10- and 20-day moving averages have rejected a bullish cross.
- There is support between $0.25-$0.26.
Previous XRP Price Movement
A look at the six-hour time-frame shows that since July 15, XRP had been trading inside a descending triangle, before breaking down on August 16.
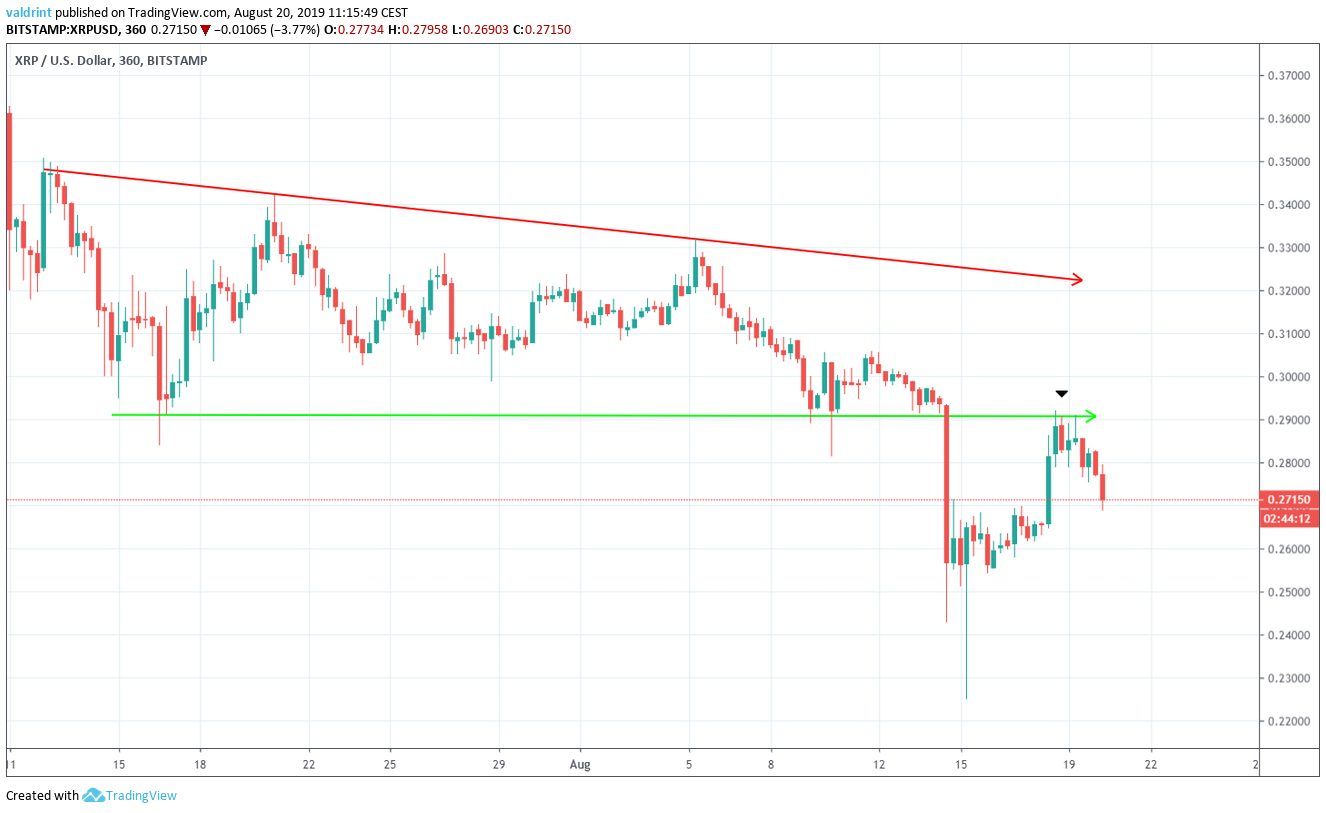
After the breakdown, the XRP price retraced all the way to the previous support line, validated it as resistance, and began a downward move — that is still ongoing.
Ascending Support
A look at the hourly chart shows that since reaching the aforementioned low on August 14, the XRP price has been following an ascending support line.
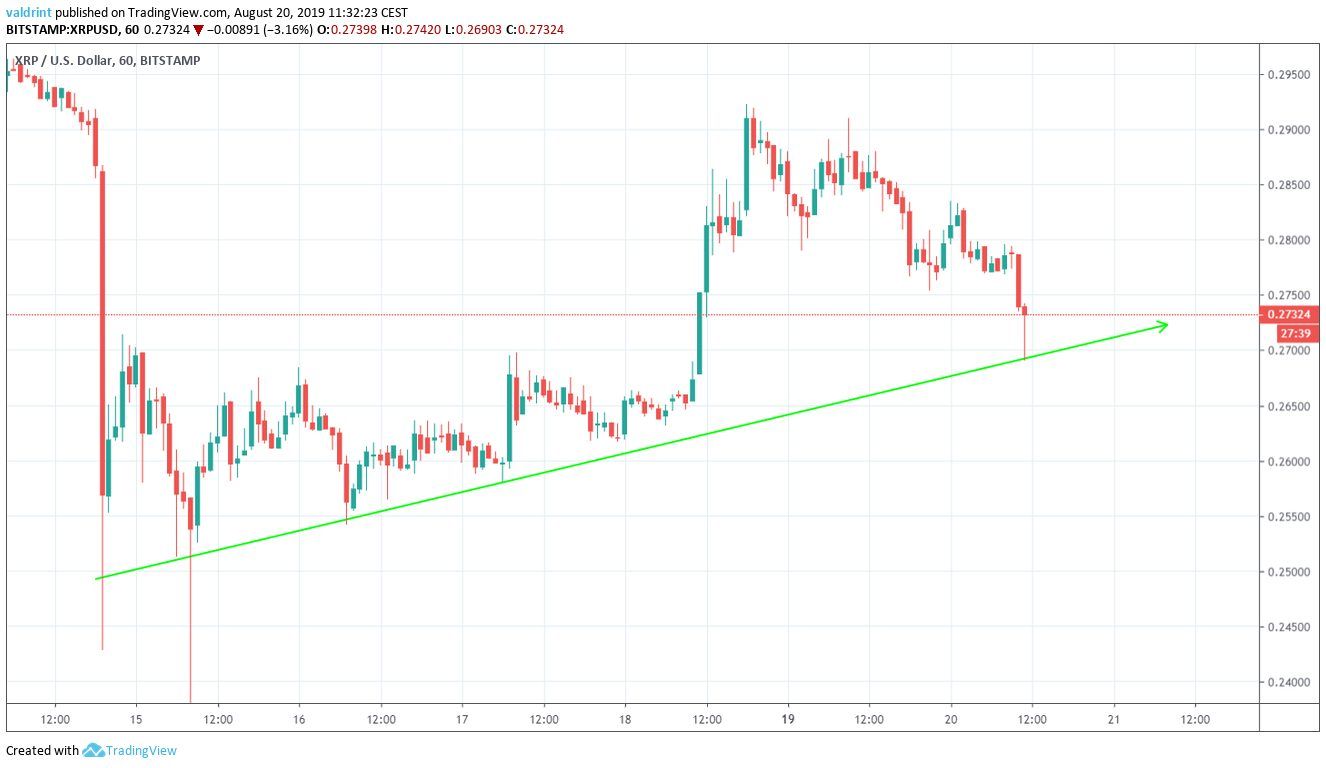
Once it reached this support line, it immediately began to increase and is in the process of generating a hammer candlestick.
Additionally, drawing a resistance line from the high of $0.292 gives us a symmetrical triangle.
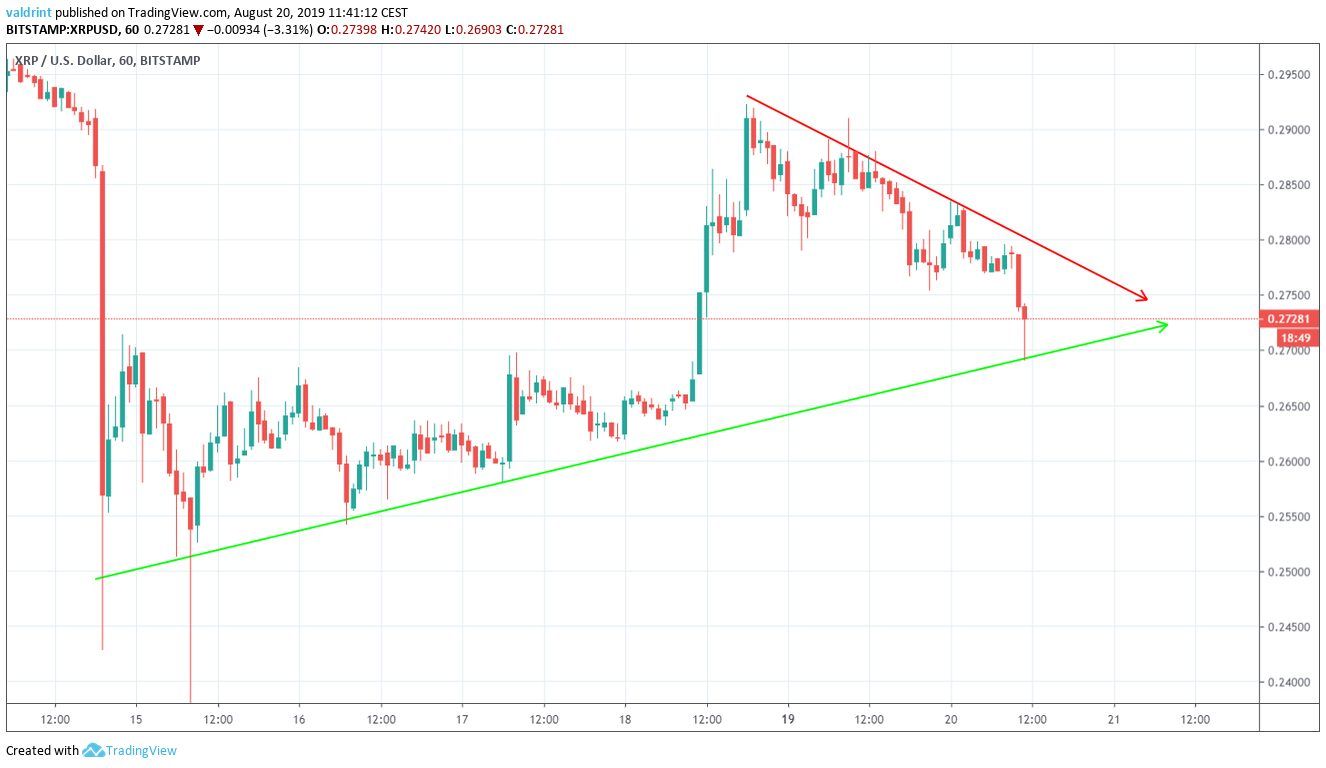
Since the symmetrical triangle is considered a neutral pattern, both a breakout and breakdown are equally likely.
Let’s take a look at technical indicators and see which one will occur.
Moving Averages
A look at the moving averages (MA) suggests that the XRP price is more likely to break down from the triangle.
On August 18 and 19, it reached the 20-day moving average, created a long upper wick, and began to decrease.
Additionally, this caused a possible bullish cross to be rejected.
The ongoing decrease has taken the XRP price below the 10-day MA — which is now offering resistance.
Additionally, we can see a support area between $0.25-$0.26.
We believe the price is likely to reach it.
XRP Price Summary
The XRP price is trading inside a symmetrical triangle.
According to our analysis, it is likely to break down from the triangle and reach the support area outlined below.
For trading purposes, if a retracement towards $0.28 occurs, it could offer profitable shorting opportunities with a target close to $0.25.
How long do you think the XRP price will continue to increase? Let us know in the comments below.
Disclaimer: This article is not trading advice and should not be construed as such. Always consult a trained financial professional before investing in cryptocurrencies, as the market is particularly volatile.
Images are courtesy of Shutterstock, TradingView.
