
On July 16, 2019, the XRP price reached a low of $0.28. An upward move ensued. XRP reached a high of $0.34 on July 20. It has been decreasing since then. On August 10, it reached a low of $0.281.
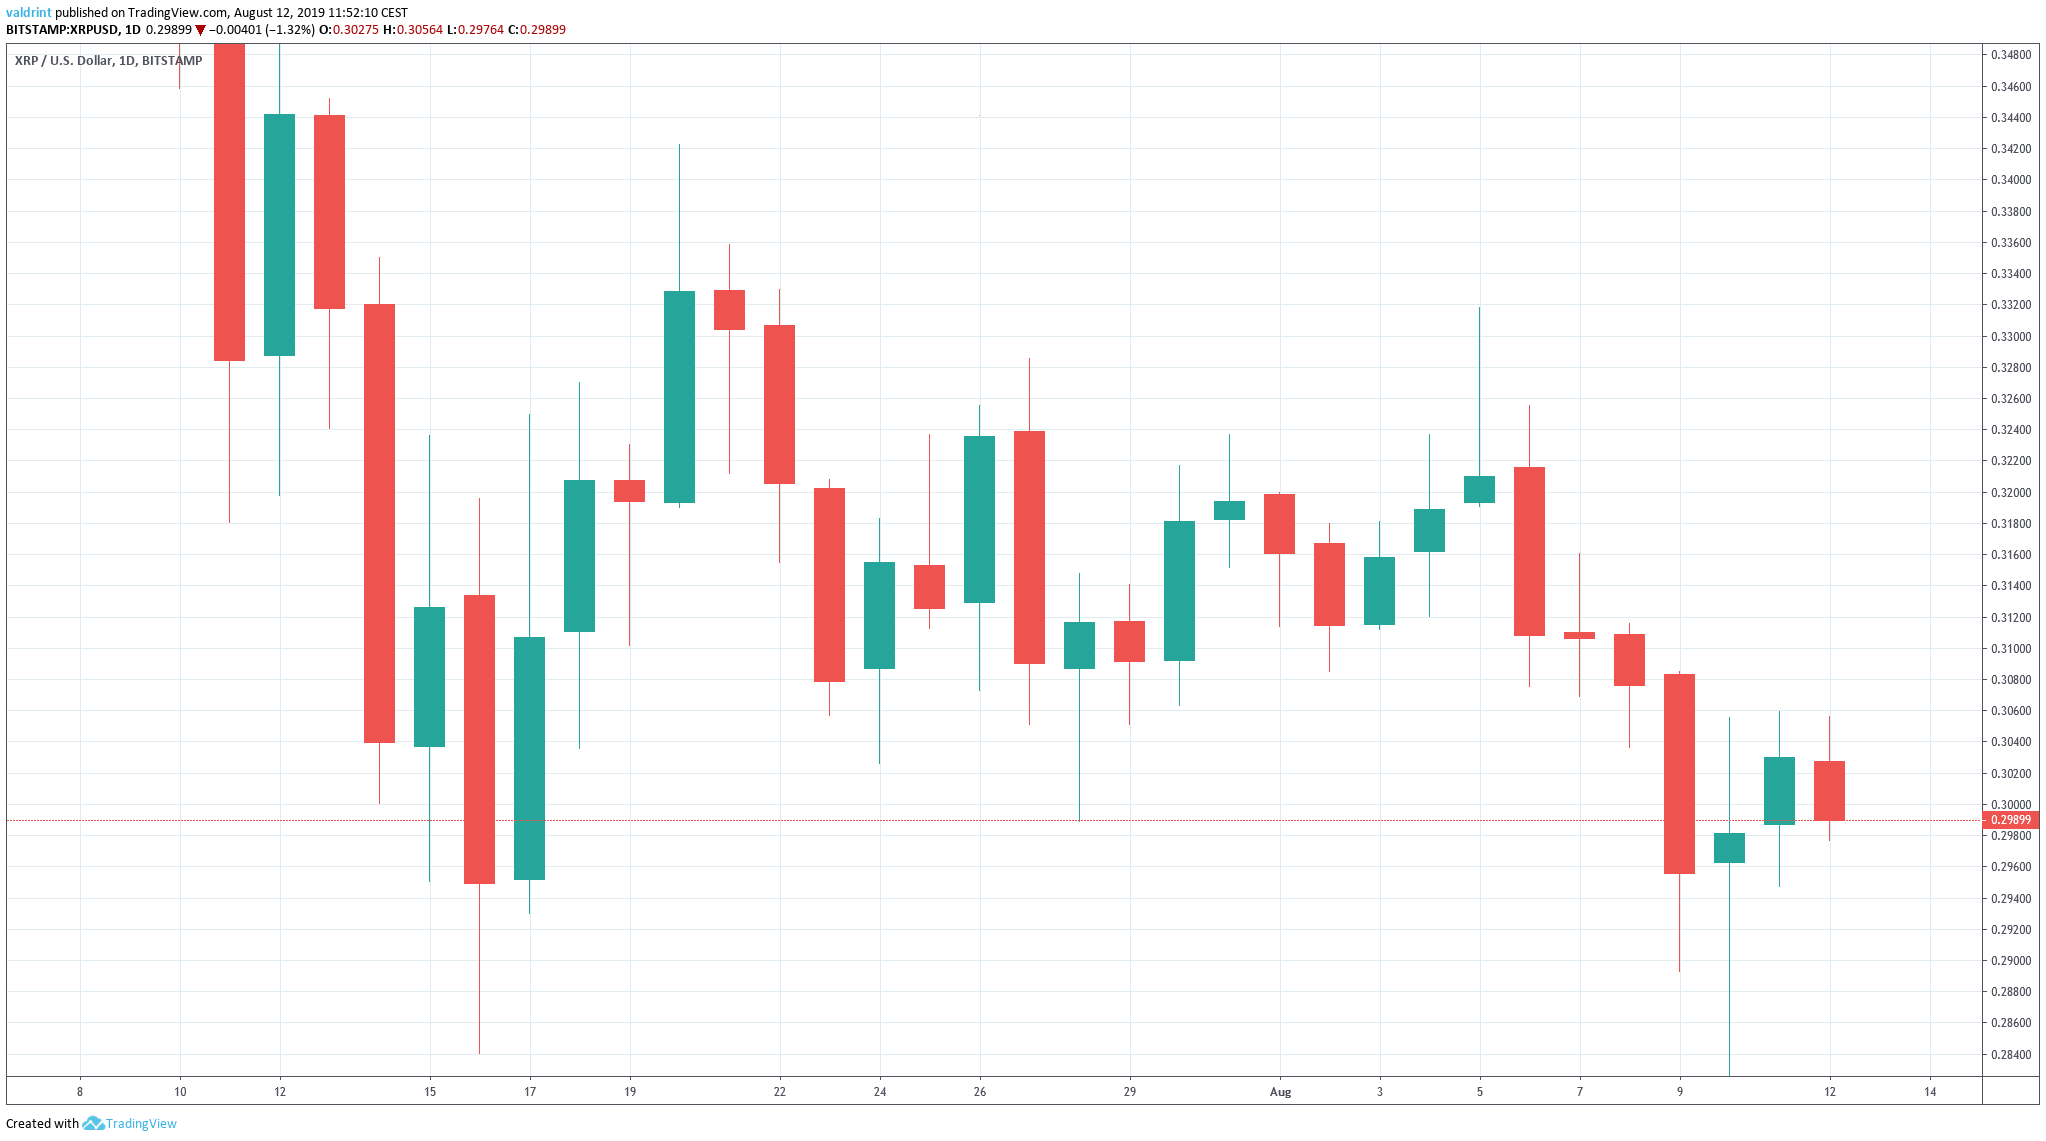
Will XRP continue to decrease or will it initiate a reversal? Continue reading if you are interested in finding out.
For our previous analysis, click here.

XRP Price: Trends and Highlights for August 12
- XRP/USD is following a descending resistance line
- It has created a double bottom reversal pattern.
- It is trading inside a long-term symmetrical triangle.
- A bearish divergence has developed in the RSI and the MACD.
- There is resistance at $0.35.
Long-Term XRP Price Pattern
A look at the daily time-frame shows that XRP has been trading inside a symmetrical triangle since August 2018.

At the time of writing, it was trading very close to the support line.
The fact that the pattern has been in place for slightly more than a year makes us believe that the prospects of a breakdown are not very high.
Additionally, a look at the RSI & MACD suggests that a reversal will soon begin.
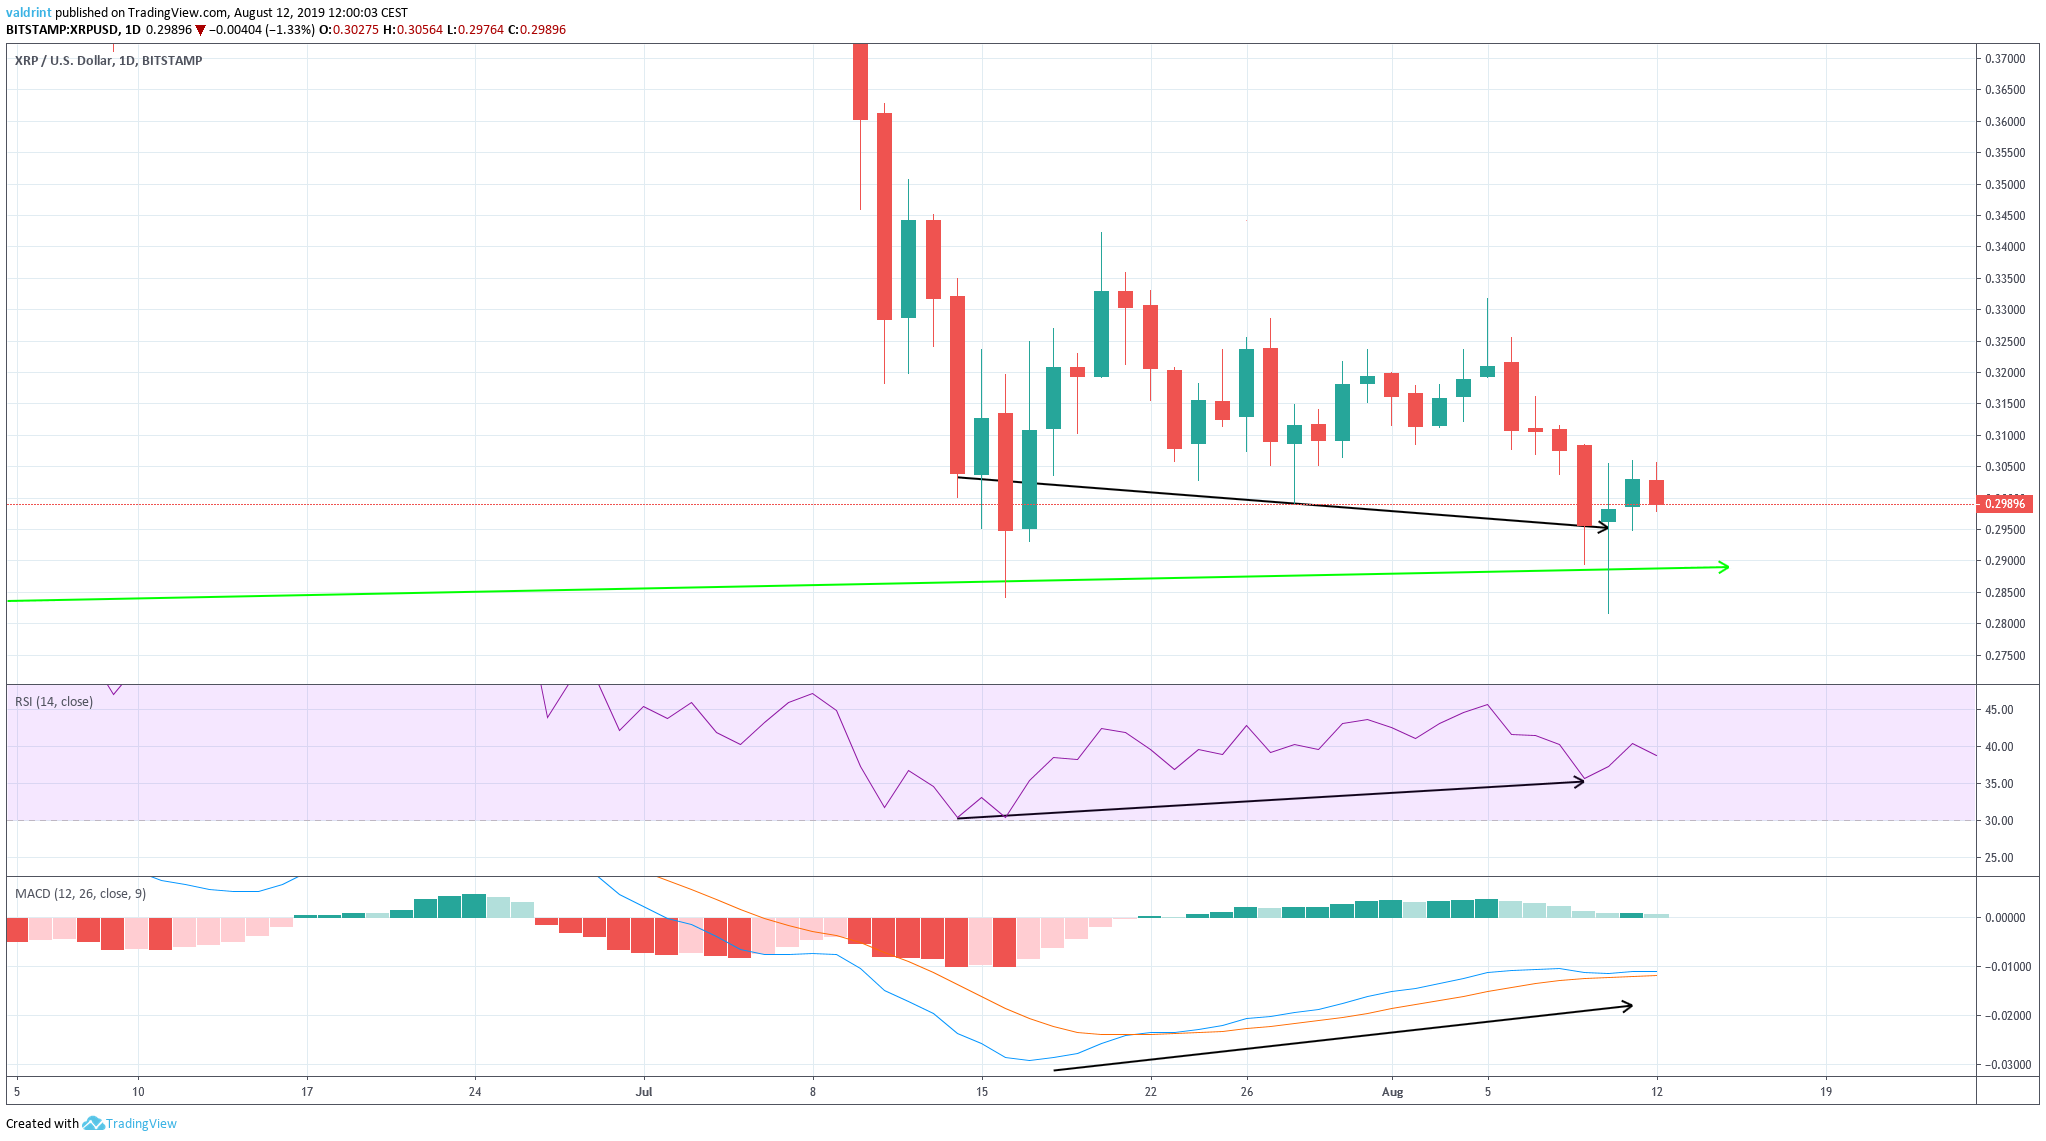
Both have been generating bullish divergence since July 16, the previous time the XRP price touched the support line.
Therefore, we believe that XRP will soon begin to increase.
Let’s take a look at the short-term to see how that might materialize.
Descending Resistance Line
A look at the two-hour time-frame shows that XRP has been following a descending resistance line since July 12.
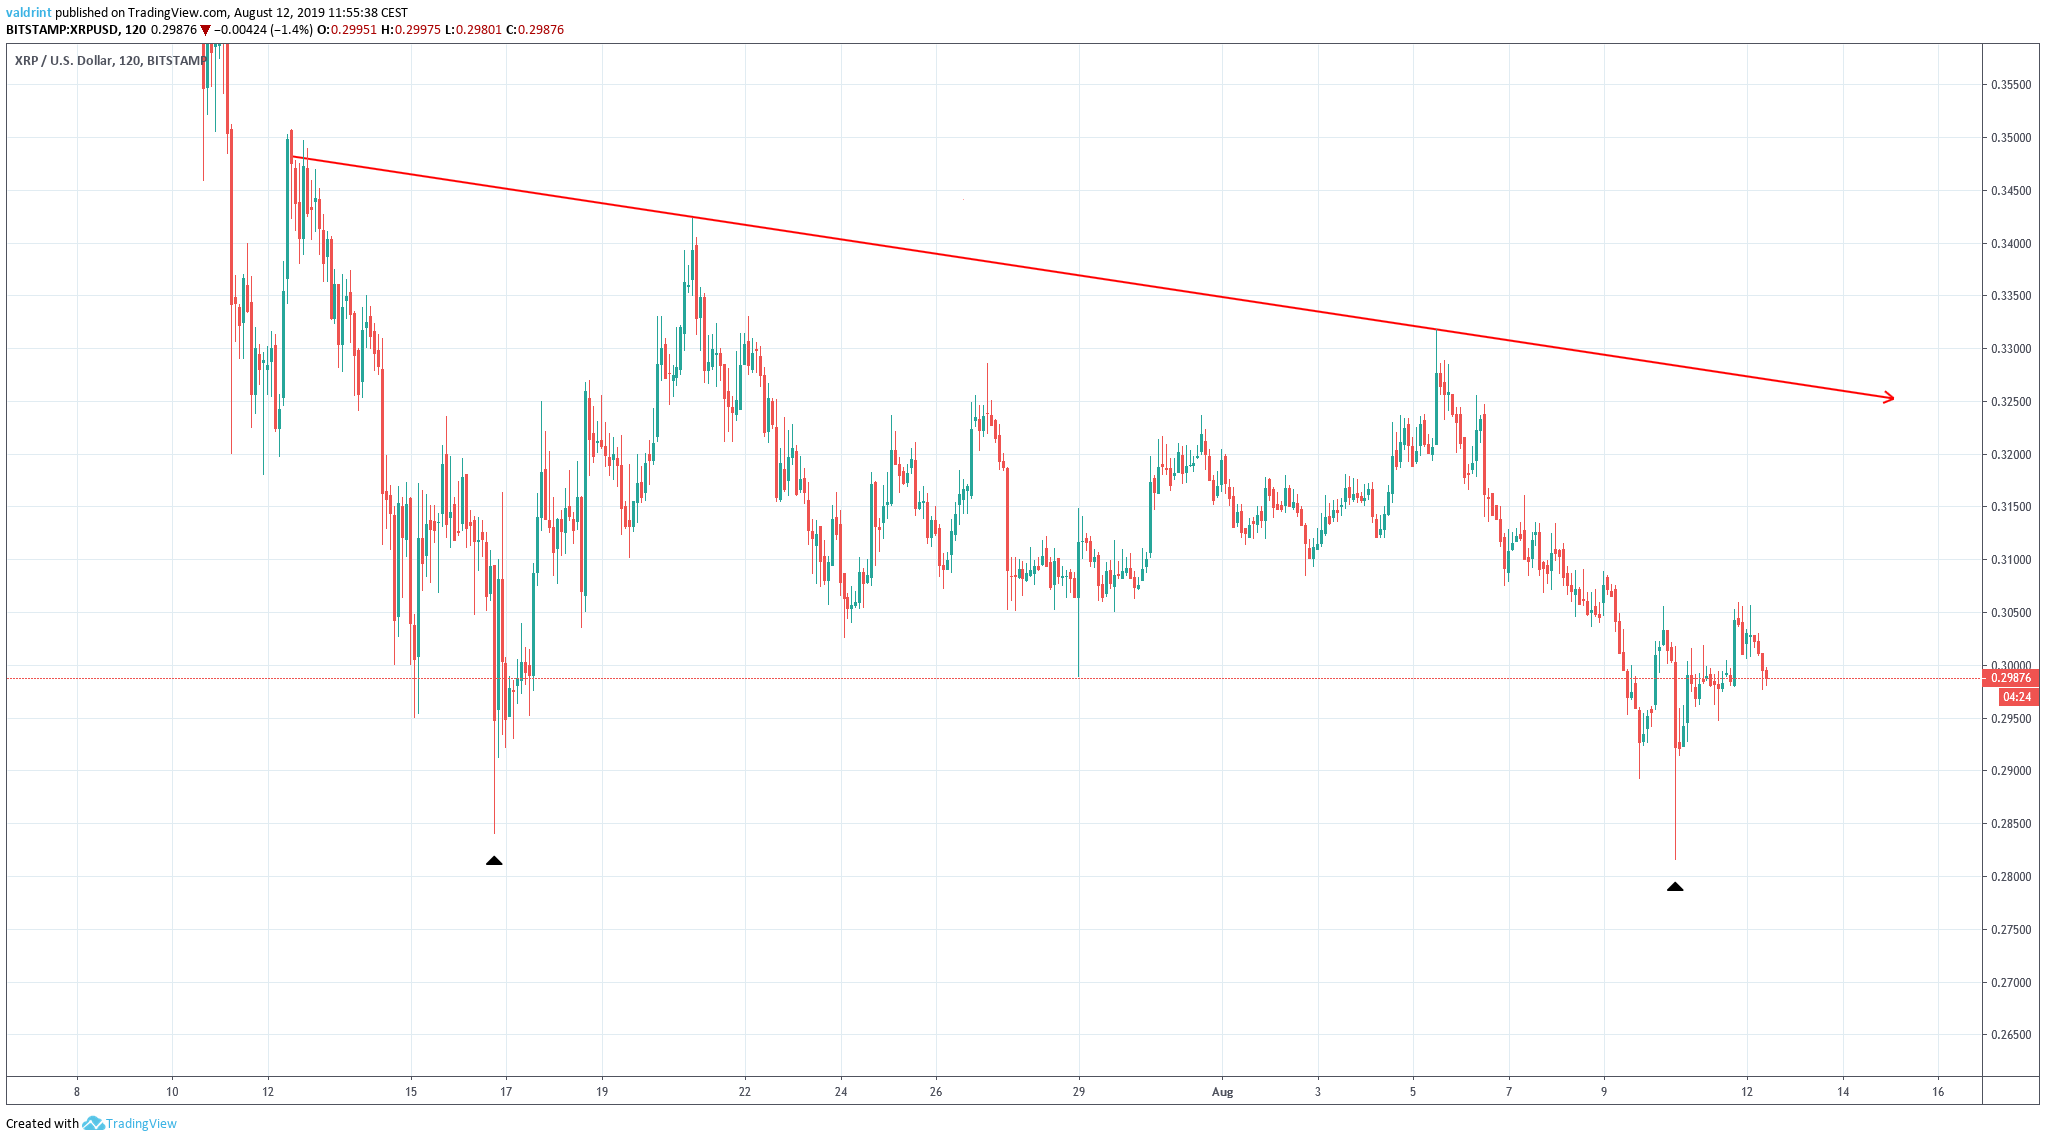
Additionally, XRP has made two lows below $0.285 on July 16 and August 10.
In both cases, it generated very long lower wicks, a sign of buying pressure.
When found on a downtrend, the double bottom is considered a bullish reversal pattern.
Combined with the long-term analysis, this makes us believe that the XRP price will move towards the resistance line.
If it breaks out, one resistance area is outlined below:
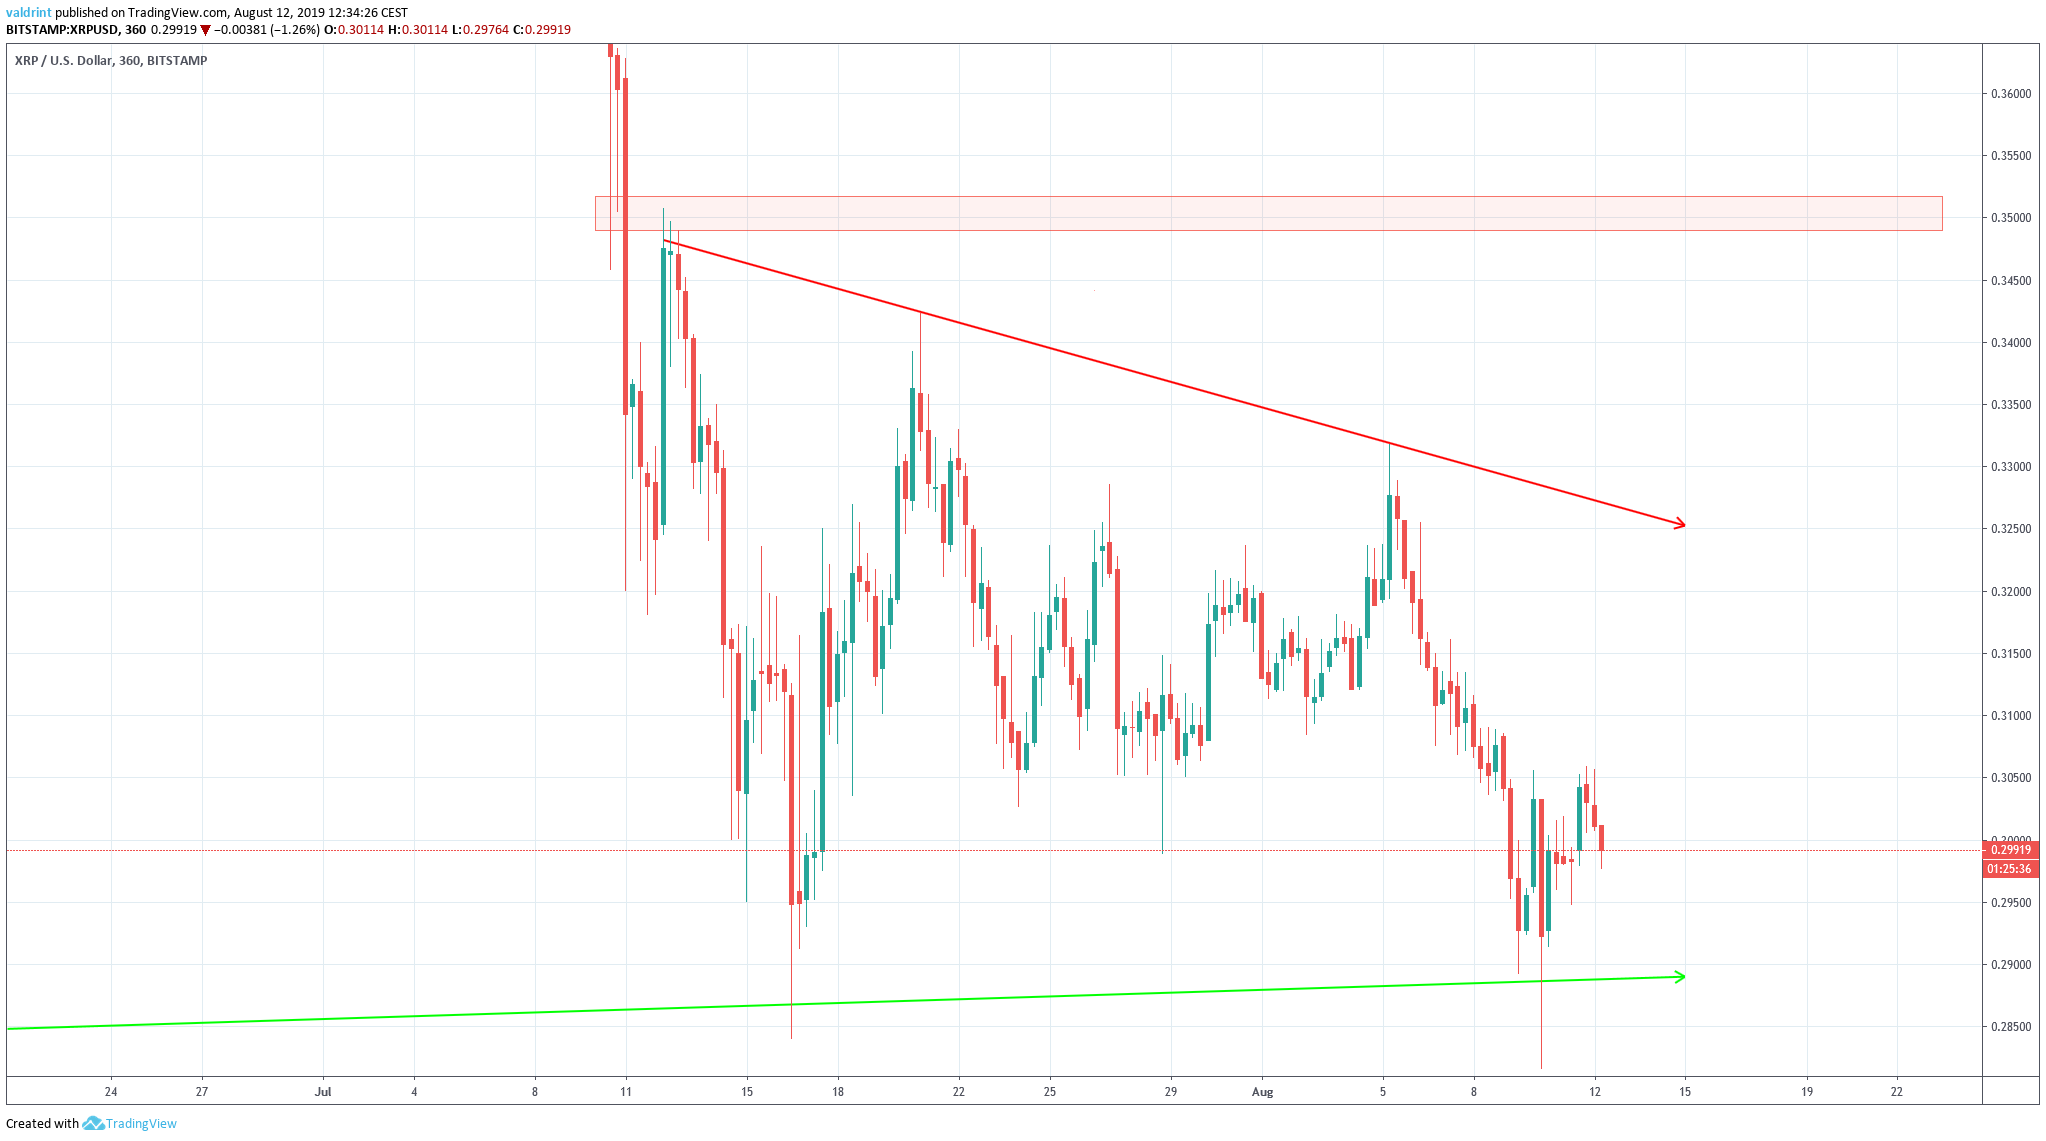
It is found at $0.35, coinciding with the beginning of the resistance line.
While we cannot confidently predict a breakout, we believe it is very likely that XRP will at least increase until it reaches the resistance line.
XRP Price Summary
The XRP price has been following a short-term descending resistance line.
According to our analysis, it is likely to reach it and possibly break out.
Do you think XRP will break out from the resistance line? Let us know in the comments below.
Interested in trading cryptocurrencies with a multiplier of 100x? Check out our partner exchange, StormGain, to do so!
Disclaimer: This article is not trading advice and should not be construed as such. Always consult a trained financial professional before investing in cryptocurrencies, as the market is particularly volatile.
Images are courtesy of TradingView and Shutterstock.
