
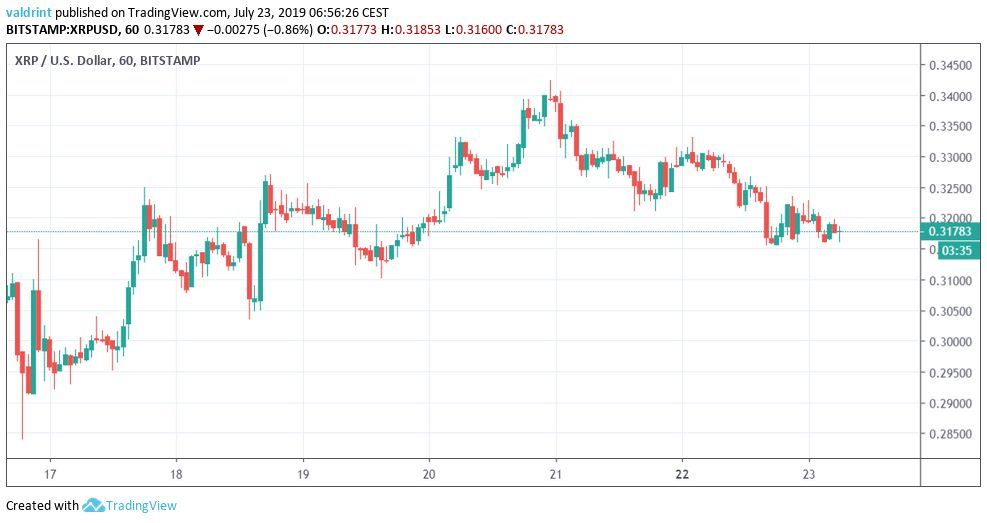
On July 16, 2019, the XRP price reached a low of $0.284. A gradual uptrend began. On July 20, it reached a high of $0.343. Since then, it has been decreasing.
Will XRP initiate a reversal soon? Keep scrolling below if you want to find out the answer to that question.
For our previous analysis, click here.
If you are interested in trading XRP (XRP) with a multiplier of up to 100x on our new partner exchange with the lowest fees, follow this link to get a free StormGain account!
XRP Price: Trends and Highlights for July 23
- XRP/USD broke down from an ascending support line.
- It is trading inside a descending wedge.
- There is a very slight bullish divergence developing in the short-term RSI.
- There is support at $0.31.
- There is resistance above $0.33.
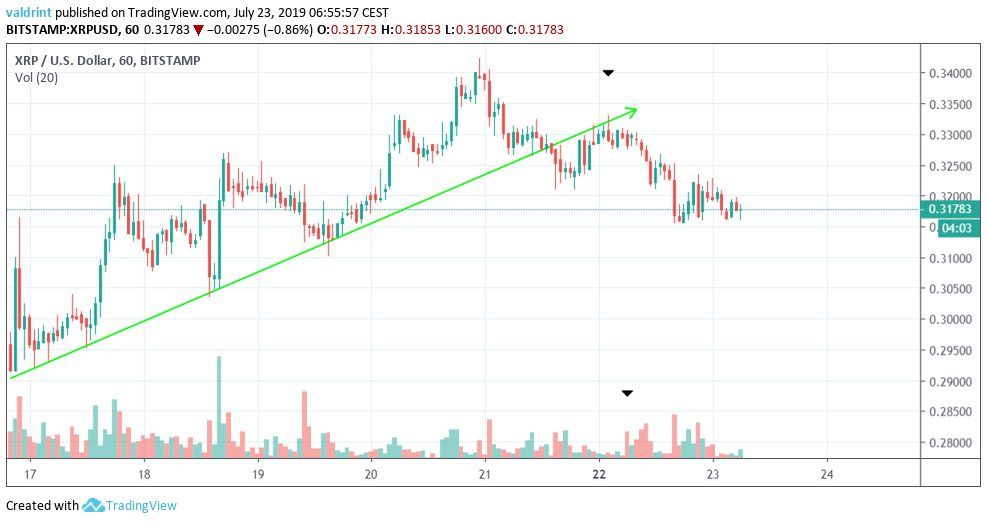
- XRP is trading inside a long-term symmetrical triangle.
Previous and Current XRP Price Patterns
Since reaching the aforementioned low on July 16, the XRP price has been following the ascending support line outlined below.
The XRP price broke down from the support line on July 21. Afterward, it came back to validate it as resistance.
The breakdown transpired with below-average volume, reducing its significance.
Also, XRP is now trading inside a descending wedge.
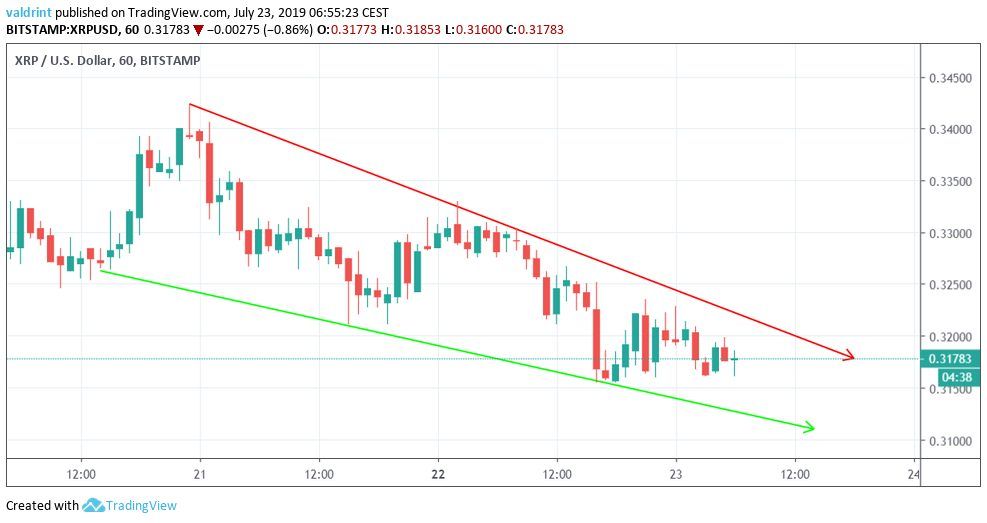
The descending wedge is a bullish pattern, making an XRP price breakout more likely.
Will the price initiate a breakout?
Possible Breakout
A look at the RSI suggests that XRP may initiate a breakout attempt.
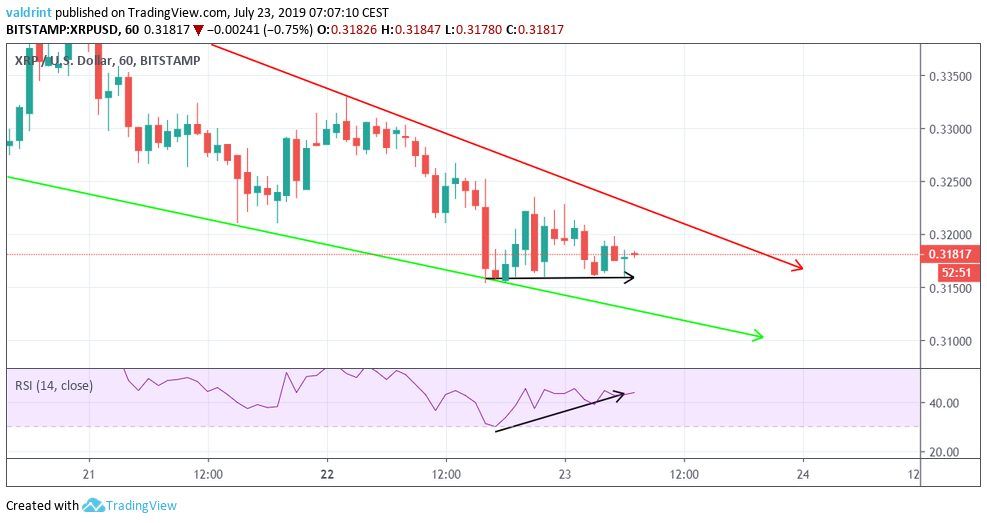
There has been some bullish divergence developing.
However, it is not very significant and it is not present in the MACD.
Furthermore, there is no notable support area that would allow the XRP price to initiate a reversal.
One such area is outlined below.
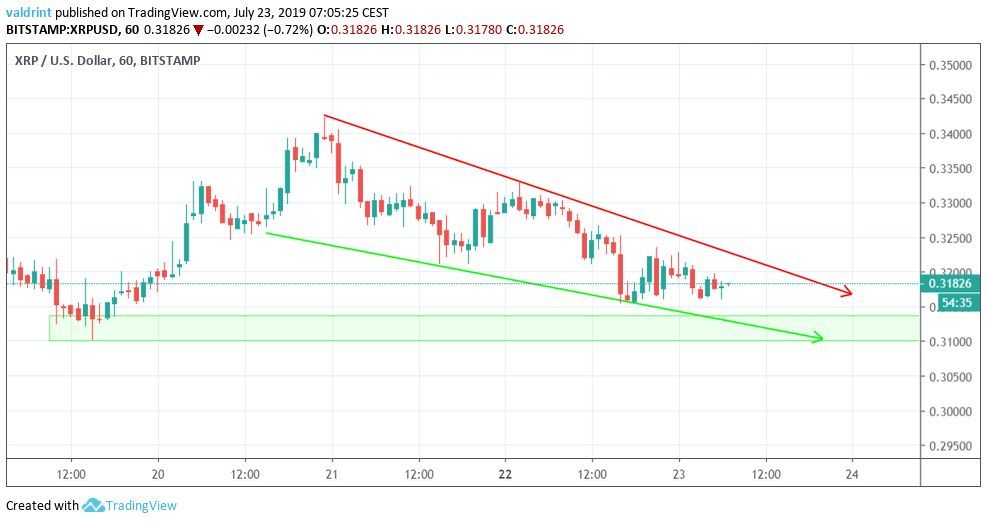
It is found slightly above $0.31.
It is likely that the XRP price reaches it before possibly making an upward move and breaking out.
Reversal Areas
If the XRP price does so, one resistance area is outlined below.
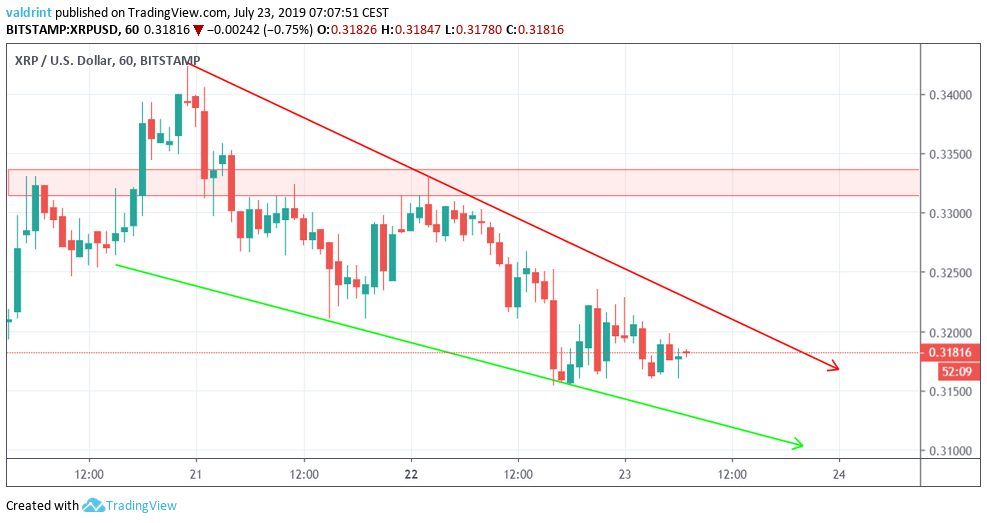
The closest resistance area is found slightly above $0.33.
We believe that it is likely that XRP will reach this area.
Long-Term
A long-term view shows that XRP has been trading inside a symmetrical triangle since September 2018.
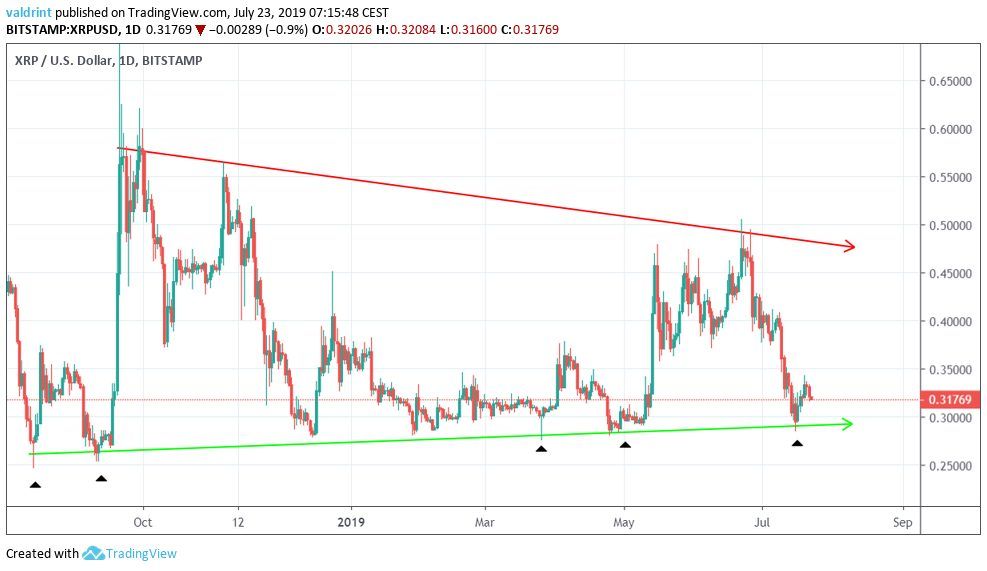
Recently, it touched the support line for the fifth time.
Every other time it has done so, it has initiated an upward move.
A look at the daily moving averages supports this idea.
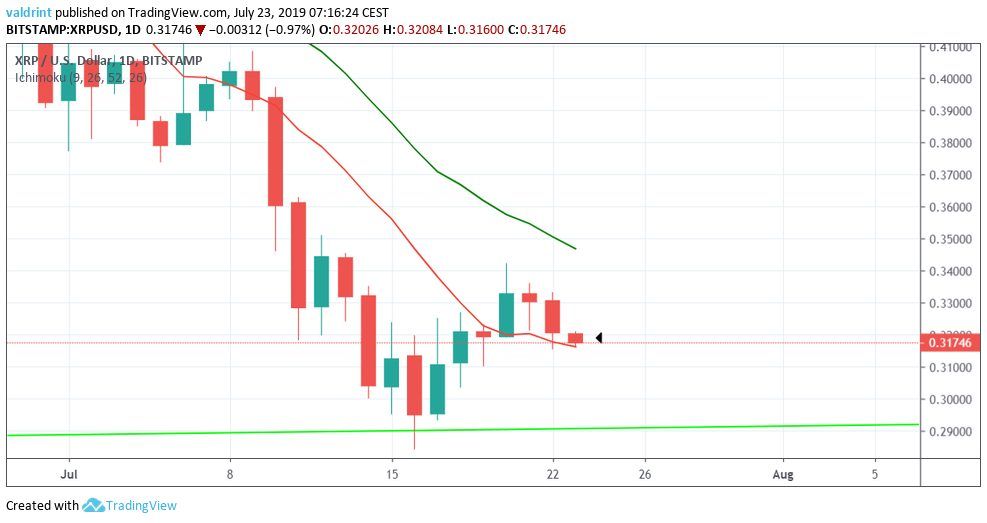
The recent increase took the XRP price above the 10-day MA. Afterward, the price has found support above it.
Furthermore, the MA seems to be ready to increase, possibly setting itself up for an eventual bullish cross.
Summary
The XRP price is trading inside a short-term descending wedge and long-term symmetrical triangle.
According to our analysis, the XRP price is likely to break out from the wedge and reach the resistance area outlined above.
Do you think the XRP price will break out from the wedge? Let us know in the comments below.
