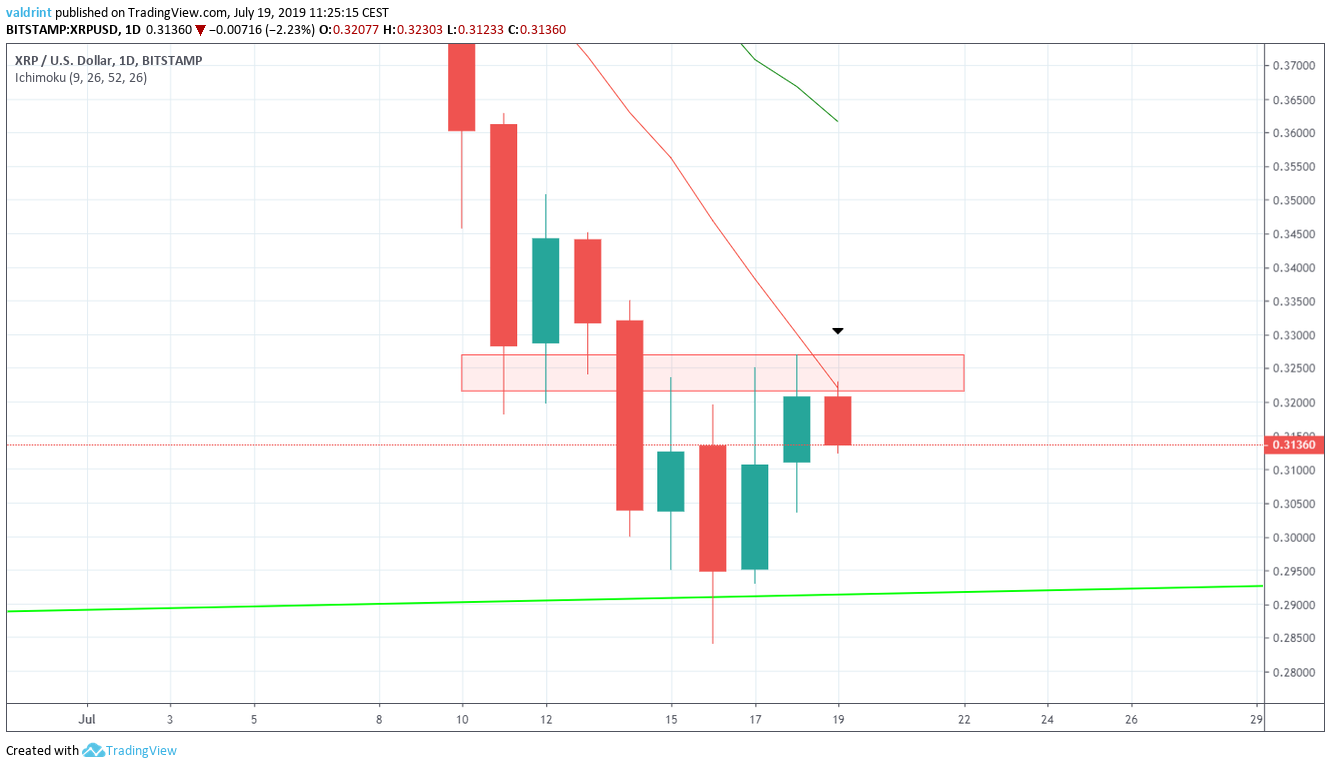
On July 12, 2019, the XRP price reached a high of $0.35. A decrease ensued. On July 16, the price made a low of $0.284. It has been increasing since.
Will the XRP price find support above $0.3? Continue reading below in order to find out.
For our previous analysis, click here.
If you are interested in trading cryptocurrencies with a multiplier of up to 100x on our new partner exchange with the lowest fees, follow this link to get a free StormGain account!

XRP Price: Trends and Highlights for July 19
- XRP/USD is trading inside a descending wedge.
- There is bullish divergence developing in the short-term RSI.
- It is trading inside a very long-term symmetrical triangle.
- The XRP price is facing resistance from the 10-day moving average.
- There is resistance near $0.33.
XRP Price in a Descending Wedge
Since reaching the aforementioned low on July 16, the XRP price has been trading inside a descending wedge. The descending wedge is considered a bearish pattern, making price breakdowns more likely. At the time of writing, it was trading right on the support line of the wedge.
Additionally, it is approaching the point of convergence between resistance and support, at which time either a breakout or breakdown should occur.
The end of the wedge is projected to be on July 21, at the latest.
We can see that the upward move that created the support line of the wedge was preceded by bullish divergence in the RSI.
 The divergence is significant.
However, it is only present in the RSI in time-frames of six-hours or shorter.
Measuring from the low on July 16, the XRP price has increased by roughly 10 percent.
Will the price be able to break out from the resistance area, or will it break down from the wedge?
Daily Resistance
A look at the daily time-frame shows that XRP has been trading inside a symmetrical triangle since August 2018. At the time of writing, it was trading very close to the support line.
The triangle has been touched six times, and every time the price has done so previously it has begun upward moves.
The fact that the triangle has been in place for such a long period of time combined with the high number of touches makes it a very significant support area.
However, in the short-term, XRP is facing significant resistance.
This is especially visible when we include moving averages (MA) in the analysis.
 The XRP price is facing very close resistance from the 10-day MA, which has previously made a bearish cross with the 20-day one.
Furthermore, the 10-day MA coincides with a significant resistance area which is found near $0.325.
The long upper wicks of candlesticks that have reached this area indicate that there is significant selling pressure.
To conclude, we believe that XRP will eventually break down from the short-term ascending wedge. However, we believe that the support line of the triangle will not be broken. It should eventually be the catalyst for an upward move towards the resistance line of the triangle.

