


On July 9, 2019, the XRP price reached a high of $0.408. A rapid decrease ensued the next day, which is still continuing. On July 16, the price made a low of $0.286.
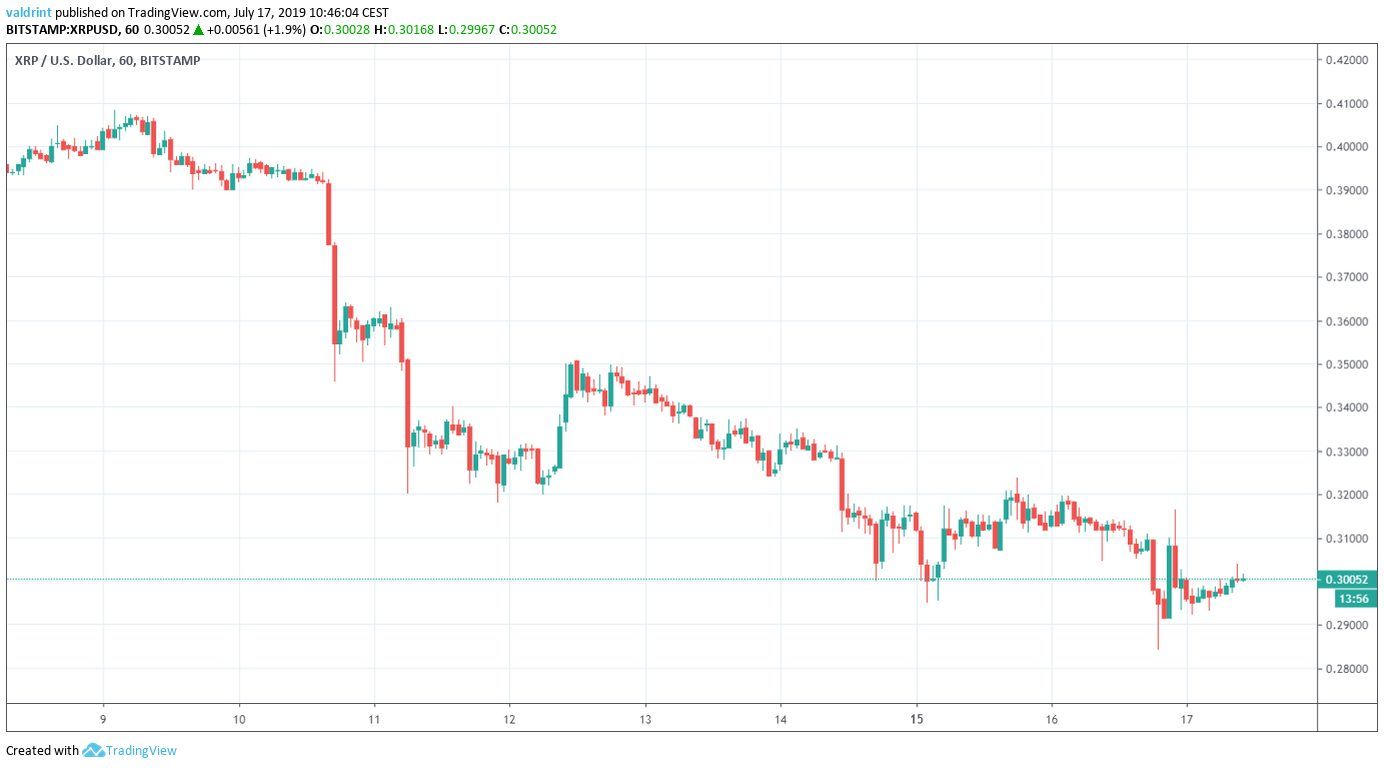
When will the decrease end for XRP? Keep reading below in order to find out.
For our previous analysis, click here.
XRP Price: Trends and Highlights for July 17
- XRP/USD is trading inside a descending channel.
- There is a short-term bullish divergence developing in the RSI and the MACD.
- There is resistance between $0.34 and $0.35.
- XRP is trading inside a long-term symmetrical triangle.
XRP Price in a Descending Channel
A look at the hourly time-frame shows that the XRP price has been trading inside a descending channel since July 11.
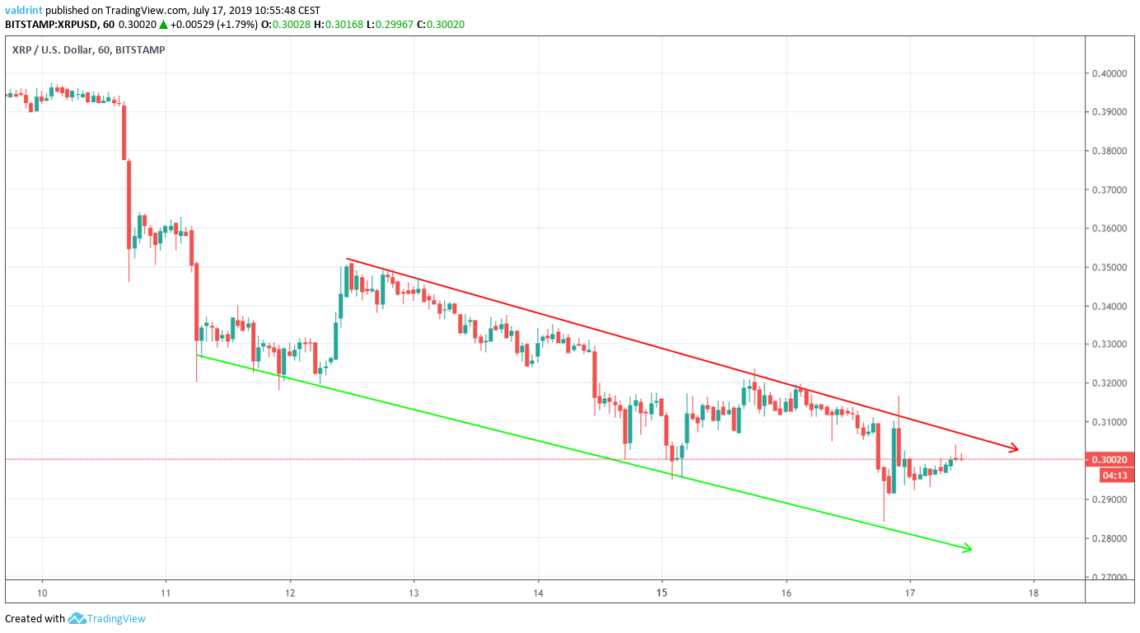
At the time of writing, it was trading close to the resistance line of the channel after making an unsuccessful attempt at a breakout the previous day.
Will it do so again?
A look at the RSI and the MACD suggests that this is likely.
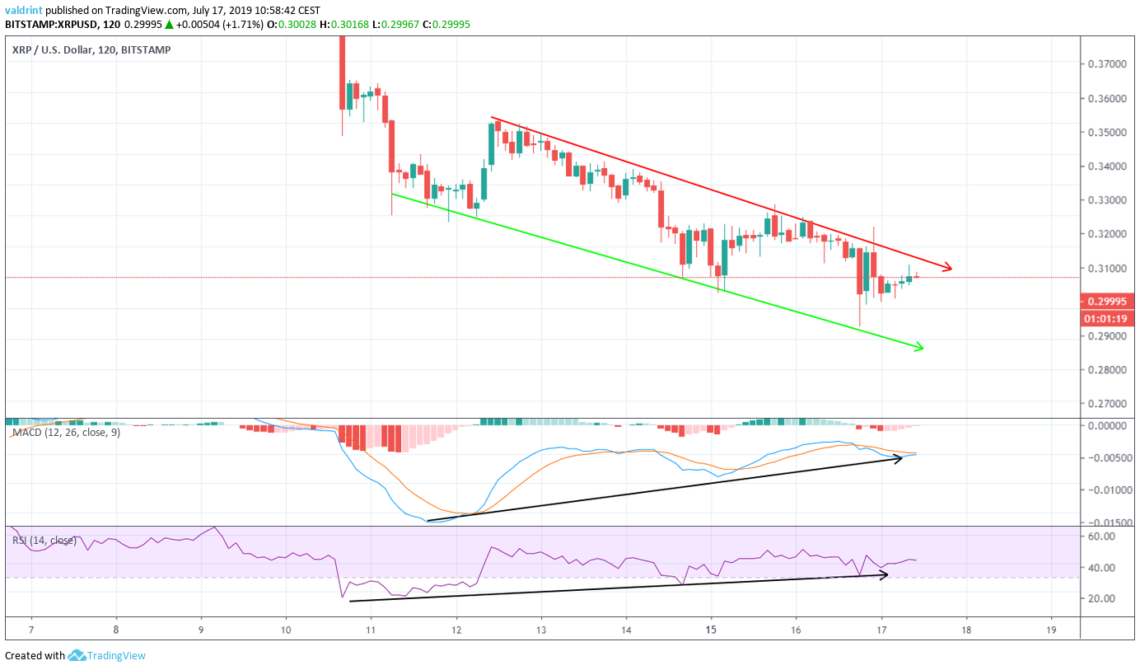
Both have been generating bullish divergence since the beginning of the channel on July 11.
While it is not present in time-frames longer than six-hours, the divergence is very significant and is visible in both indicators.
Therefore, momentum indicators suggest that the XRP price is likely to break out soon.
If it does, where will it find resistance?
Reversal Areas
If the XRP price breaks out, one resistance area is outlined below.
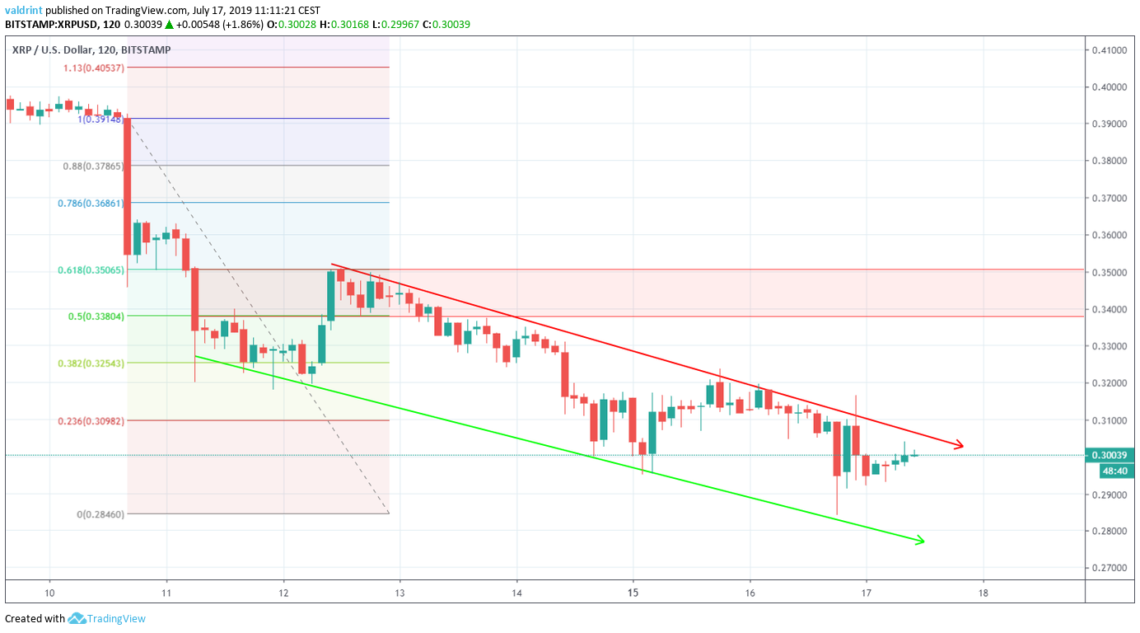
It is found between $0.34 and $0.35, between the 0.5 and 0.618 fib levels of the entire drop.
Also, this is the level which marked the beginning of the resistance line of the channel, further increasing its significance.
Long-Term
A look at a longer-term time-frame shows that the XRP price has been trading inside a symmetrical triangle since August 2018.
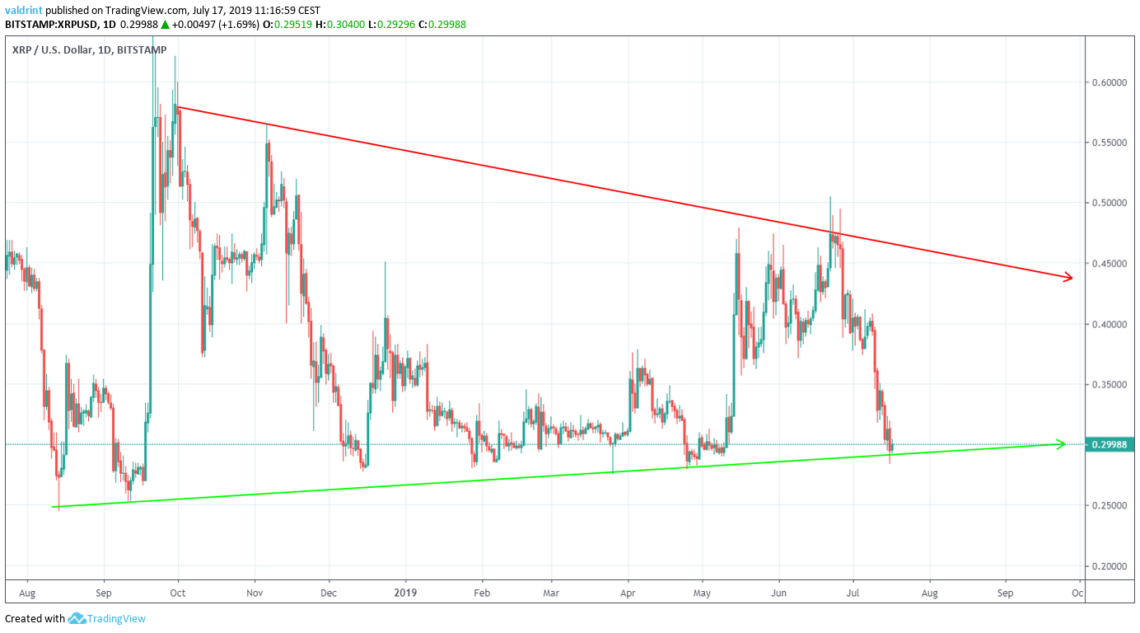
Additionally, the support line of the triangle coincides with that of the channel.
Therefore, a breakdown from the channel or even continued decreases at its rate would eventually cause a breakdown from the triangle.
We believe this to be unlikely.
Therefore, the presence of the triangle further supports the hypothesis that the XRP price will soon break out from the channel.
Summary
The XRP price has been decreasing since July 11, trading inside a descending channel.
According to our analysis, the XRP price is likely to break out from the channel and reach the resistance area outlined above.
Do you think that XRP will break out from the channel? Join our Telegram group.


