

On July 5, 2019, the XRP price reached a low of $0.374. An upward move ensued. The next day, XRP briefly spiked to $0.41. Since then, it has been gradually decreasing.
 Will XRP find support or will it continue to decrease? If you want to know the answer, keep reading below.
If you want to trade XRP (XRP) safely and securely on our partner exchange, follow this link to get set up on XCOEX.
For our previous analysis, click here.
Will XRP find support or will it continue to decrease? If you want to know the answer, keep reading below.
If you want to trade XRP (XRP) safely and securely on our partner exchange, follow this link to get set up on XCOEX.
For our previous analysis, click here.
XRP Price: Trends and Highlights for July 10
- XRP/USD is trading inside a symmetrical triangle.
- It is following a long-term ascending support line.
- Short-term moving averages are bearish.
- Long-term moving averages are bullish.
XRP Price in a Symmetrical Triangle
The XRP price has been trading inside a symmetrical triangle since reaching a high above $0.415 on July 1. The aforementioned low reached on July 5 marks the beginning of the support line of the triangle.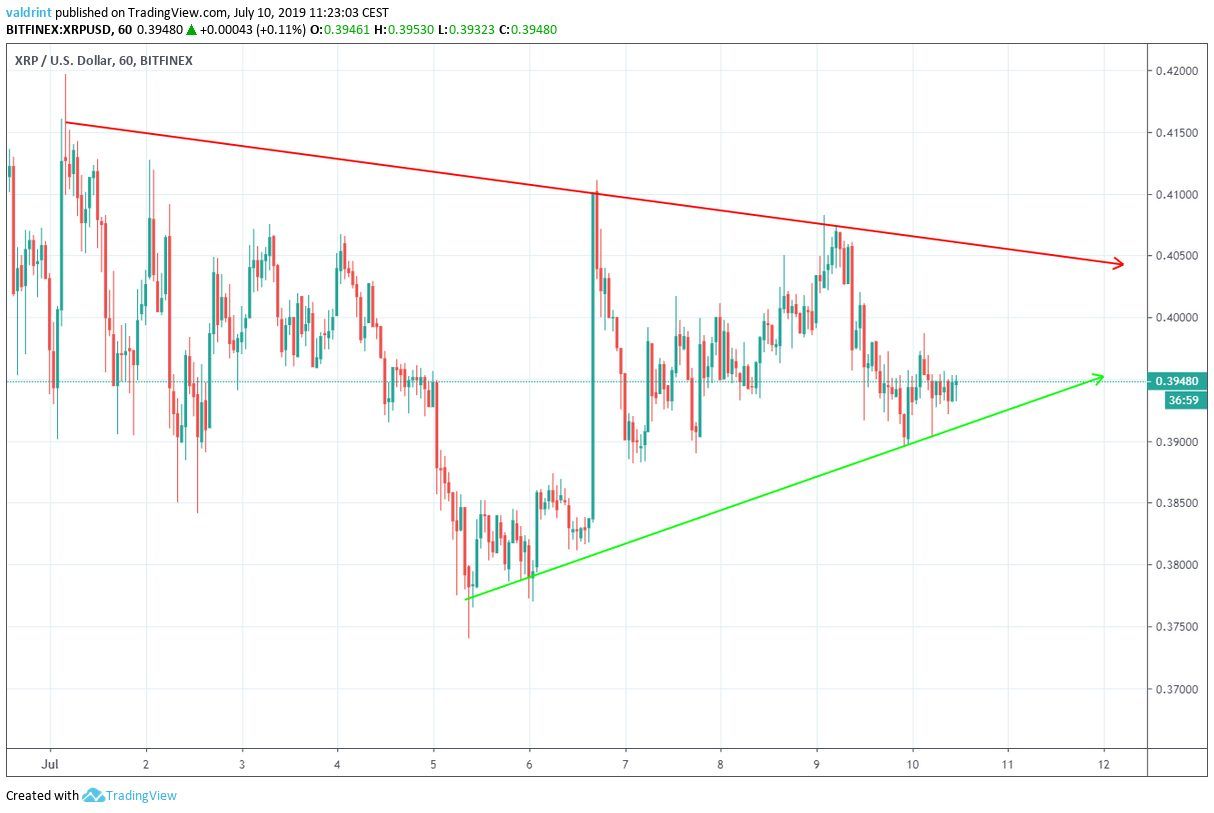 At the time of writing, XRP is trading slightly above the support line of the triangle.
The symmetrical triangle is a neutral continuation pattern.
Therefore, if it is occurring after a downward move, it usually means that the downtrend will continue.
At the time of writing, XRP is trading slightly above the support line of the triangle.
The symmetrical triangle is a neutral continuation pattern.
Therefore, if it is occurring after a downward move, it usually means that the downtrend will continue.
 However, this is only a general guideline for symmetrical triangles.
Depending on previous price movement and/or indicator readings, the symmetrical triangle can also initiate a reversal.
Let’s take a look at a different time-frame alongside technical indicators to see if that is likely.
However, this is only a general guideline for symmetrical triangles.
Depending on previous price movement and/or indicator readings, the symmetrical triangle can also initiate a reversal.
Let’s take a look at a different time-frame alongside technical indicators to see if that is likely.
Support Line
A look at the daily time-frame shows that the XRP price has been following an ascending support line since May 16.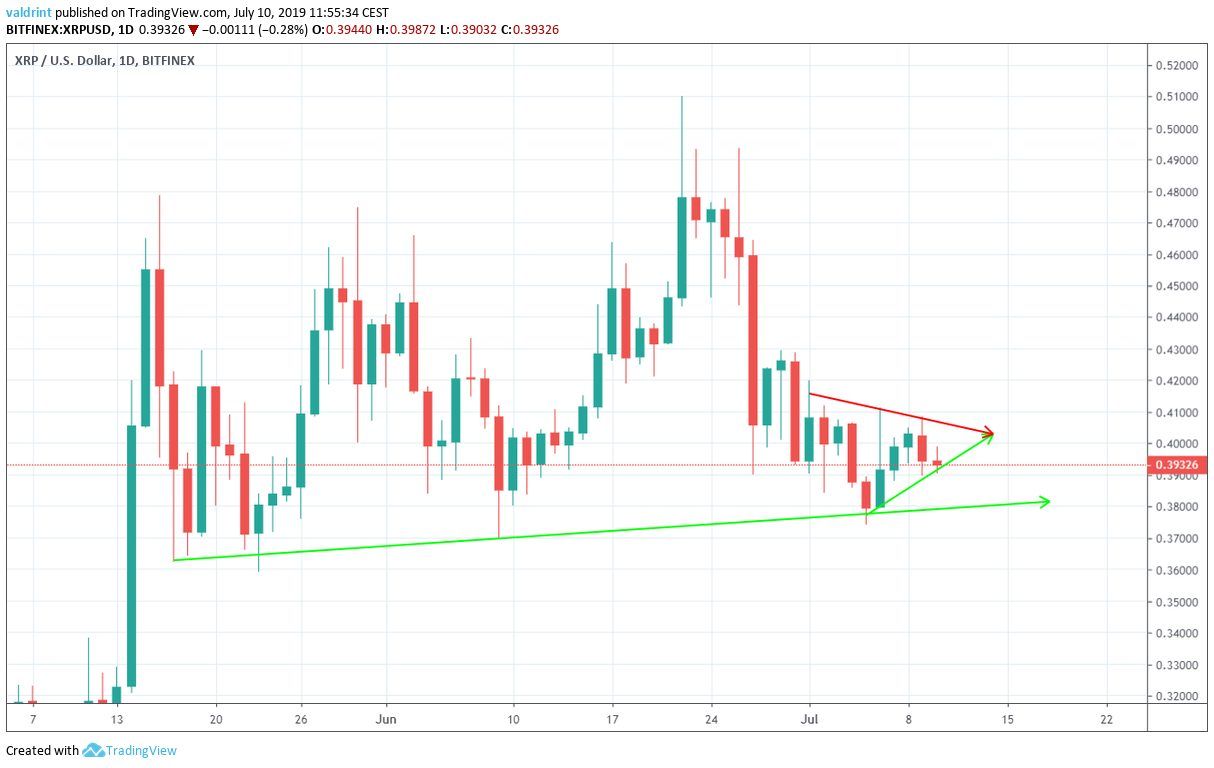 The beginning of the support line of the triangle coincides with this ascending support line.
The short-term moving averages (MA) support the price movement outline laid out in the first section.
The beginning of the support line of the triangle coincides with this ascending support line.
The short-term moving averages (MA) support the price movement outline laid out in the first section.
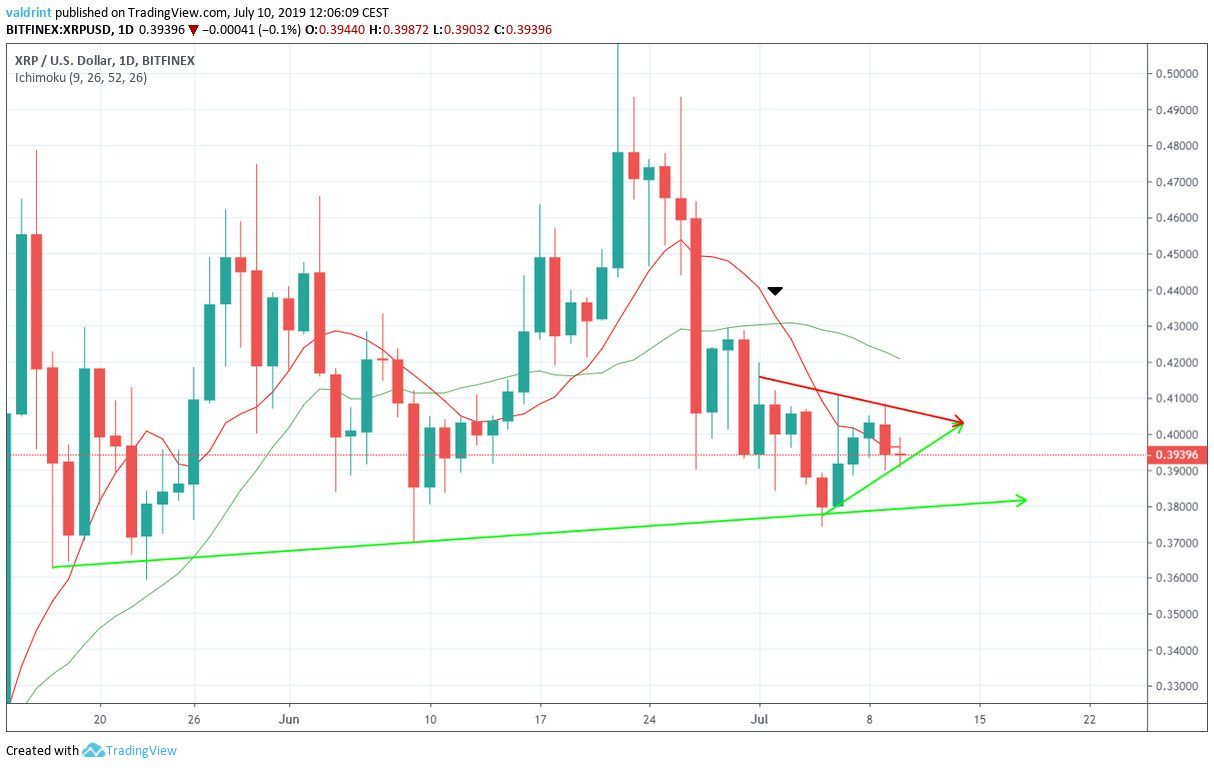 A bearish cross between the 10- and 20-day MAs transpired on July 3.
The XRP price has been trading below both of them since, facing close resistance from the 10-day MA.
However, a look at the 100- and 200-day MAs gives a different outlook.
A bearish cross between the 10- and 20-day MAs transpired on July 3.
The XRP price has been trading below both of them since, facing close resistance from the 10-day MA.
However, a look at the 100- and 200-day MAs gives a different outlook.
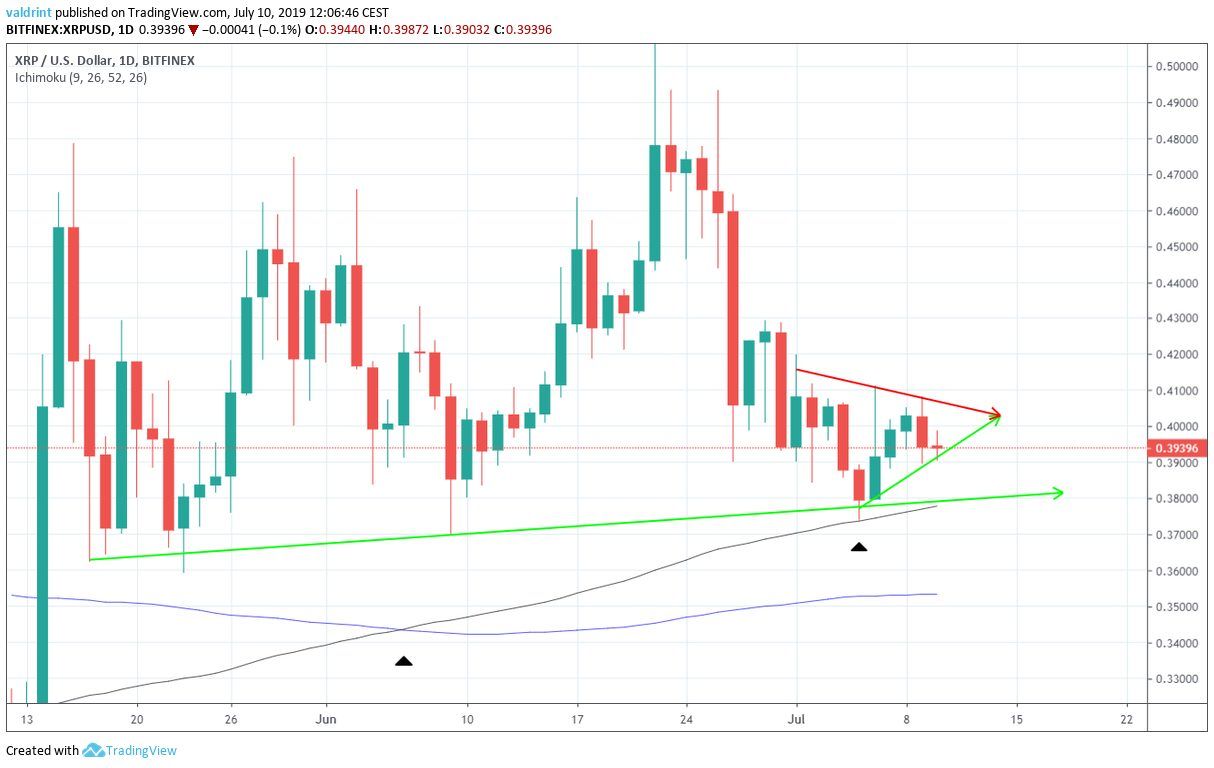 A bullish cross transpired between them on June 7.
Furthermore, on July 5, the XRP price found support above the 100-day MA, before beginning an upward move.
Since the 100- to 200-day MA cross is rarer, it has more significance than the relatively short-term 10- and 20-day one.
Furthermore, a decrease has already occurred as a result of the short-term cross.
Therefore, we do not believe that the price will decrease below the long-term support line unless a rapid breakdown occurs in the price of BTC — which could cause the same for XRP.
However, a breakdown from the triangle remains possible.
A bullish cross transpired between them on June 7.
Furthermore, on July 5, the XRP price found support above the 100-day MA, before beginning an upward move.
Since the 100- to 200-day MA cross is rarer, it has more significance than the relatively short-term 10- and 20-day one.
Furthermore, a decrease has already occurred as a result of the short-term cross.
Therefore, we do not believe that the price will decrease below the long-term support line unless a rapid breakdown occurs in the price of BTC — which could cause the same for XRP.
However, a breakdown from the triangle remains possible.
Summary
The XRP price is trading inside a short-term symmetrical triangle and is following a long-term ascending support line. The short-term moving averages are bearish, while long-term ones are bullish. According to our analysis, the price is not likely to break down from the long-term ascending support line. Do you think the XRP price will reach a new yearly high? Let us know in the comments below.Disclaimer: This article is not trading advice and should not be construed as such. Always consult a trained financial professional before investing in cryptocurrencies, as the market is particularly volatile. Images are courtesy of Shutterstock, TradingView.
Top crypto platforms in the US
Disclaimer
In line with the Trust Project guidelines, this price analysis article is for informational purposes only and should not be considered financial or investment advice. BeInCrypto is committed to accurate, unbiased reporting, but market conditions are subject to change without notice. Always conduct your own research and consult with a professional before making any financial decisions. Please note that our Terms and Conditions, Privacy Policy, and Disclaimers have been updated.

Valdrin Tahiri
Valdrin discovered cryptocurrencies while he was getting his MSc in Financial Markets from the Barcelona School of Economics. Shortly after graduating, he began writing for several different cryptocurrency related websites as a freelancer before eventually taking on the role of BeInCrypto's Senior Analyst.
(I do not have a discord and will not contact you first there. Beware of scammers)
READ FULL BIO
Sponsored
Sponsored