

On June 26, 2019, the XRP price reached a high of $0.493. A rapid decrease ensued, and lows below $0.4 were reached the next day.

XRP Price: Trends and Highlights for July 3
- XRP/USD is trading inside a descending wedge
- There is bullish divergence developing in the RSI and the MACD
- The daily moving averages have made a bearish cross
XRP Price in a Descending Wedge
Since June 27, the XRP price has been trading inside a descending wedge. The decrease has been gradual and both the resistance and support lines have been touched several times.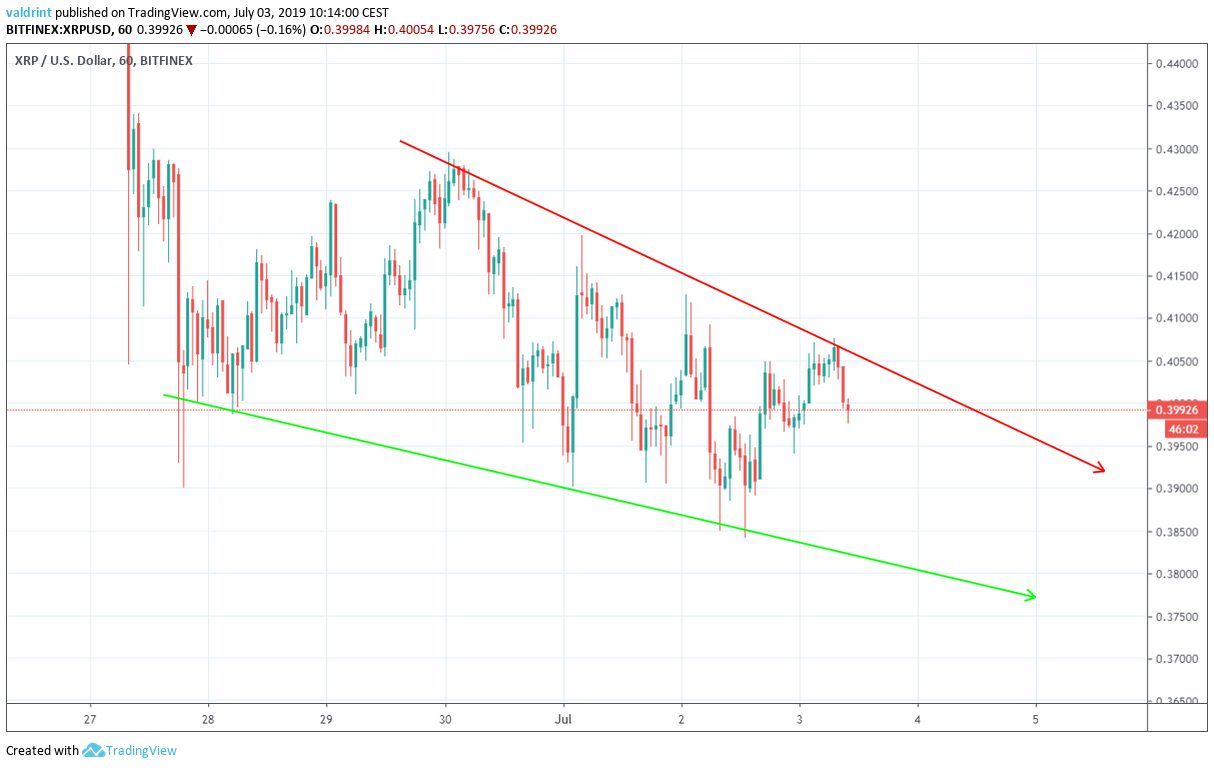 At the time of writing, the XRP price was trading slightly below the resistance line after a failed breakout attempt on July 3.
The end of the wedge is not projected to occur until July 7. Will there be a price breakout/breakdown before?
At the time of writing, the XRP price was trading slightly below the resistance line after a failed breakout attempt on July 3.
The end of the wedge is not projected to occur until July 7. Will there be a price breakout/breakdown before?
Possible Breakout
The price of XRP is analyzed at six-hour intervals alongside the RSI and the MACD
A look at the six-hour chart shows that besides being inside the wedge, the XRP price is trading very close to a significant support area near $0.39.
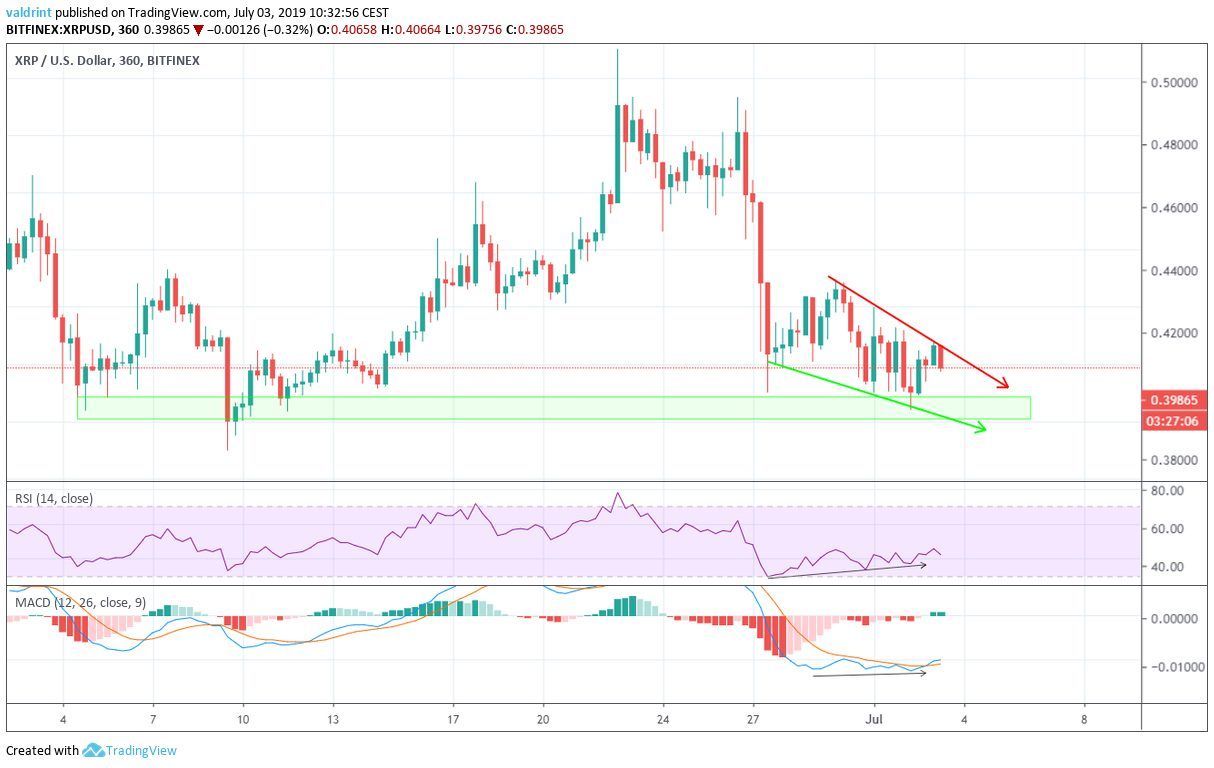 Furthermore, since the beginning of the wedge, the price has generated significant bullish divergence in both the RSI and the MACD. This divergence is more significant in the RSI.
Since the divergence is present in both indicators and inside a bullish pattern, we believe the price will eventually break out from the wedge.
However, it is possible that it will initially decrease to the support area outlined above, before initiating an upward move.
Furthermore, since the beginning of the wedge, the price has generated significant bullish divergence in both the RSI and the MACD. This divergence is more significant in the RSI.
Since the divergence is present in both indicators and inside a bullish pattern, we believe the price will eventually break out from the wedge.
However, it is possible that it will initially decrease to the support area outlined above, before initiating an upward move.
After the Breakout
The price of XRP is analyzed alongside the 10- and 20-day moving averages
A look at the daily chart gives us two events to watch:
- The bearish engulfing candle on June 30
- The bearish cross between the 10- and 20- day MAs.
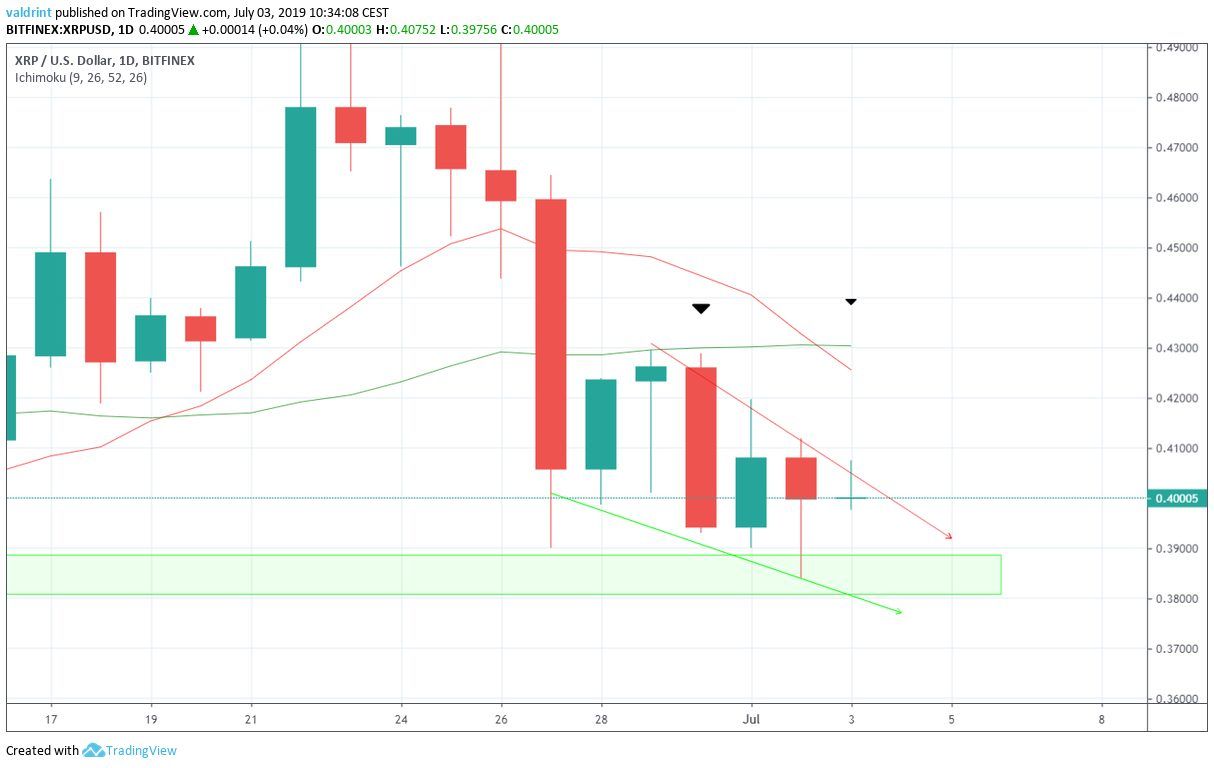 As is visible above, the recent increases are still contained within the body of the bearish candle on June 30, which is in turn contained inside the bearish candle on June 27.
Therefore, the recent increases are small relative to the massive decrease preceding them. They can be considered a retracement in response to the prior decrease.
A bearish cross has also occurred between the 10- and 20-day moving averages. This is a sign that a downtrend has begun, and they are likely to provide resistance to the XRP price.
A longer-term analysis shows that even though the price is likely to break out from the wedge, it will probably find resistance at around $0.43.
As is visible above, the recent increases are still contained within the body of the bearish candle on June 30, which is in turn contained inside the bearish candle on June 27.
Therefore, the recent increases are small relative to the massive decrease preceding them. They can be considered a retracement in response to the prior decrease.
A bearish cross has also occurred between the 10- and 20-day moving averages. This is a sign that a downtrend has begun, and they are likely to provide resistance to the XRP price.
A longer-term analysis shows that even though the price is likely to break out from the wedge, it will probably find resistance at around $0.43.
Summary
The price of XRP is trading inside a descending wedge. According to the analysis from the short-term indicators, it is likely to break out from the wedge soon. However, a longer-term look at the price shows that the increase will probably not last for very long. Do you think the XRp price will break out from the wedge? Let us know in the comments below.Disclaimer: This article is not trading advice and should not be construed as such. Always consult a trained financial professional before investing in cryptocurrencies, as the market is particularly volatile. Images are courtesy of Shutterstock, TradingView.
Top crypto platforms in the US
Disclaimer
In line with the Trust Project guidelines, this price analysis article is for informational purposes only and should not be considered financial or investment advice. BeInCrypto is committed to accurate, unbiased reporting, but market conditions are subject to change without notice. Always conduct your own research and consult with a professional before making any financial decisions. Please note that our Terms and Conditions, Privacy Policy, and Disclaimers have been updated.

Valdrin Tahiri
Valdrin discovered cryptocurrencies while he was getting his MSc in Financial Markets from the Barcelona School of Economics. Shortly after graduating, he began writing for several different cryptocurrency related websites as a freelancer before eventually taking on the role of BeInCrypto's Senior Analyst.
(I do not have a discord and will not contact you first there. Beware of scammers)
READ FULL BIO
Sponsored
Sponsored