
The price of XRP (XRP) has been increasing throughout May. After reaching a high of $0.51 on June 22, 2019, it began a downward move.
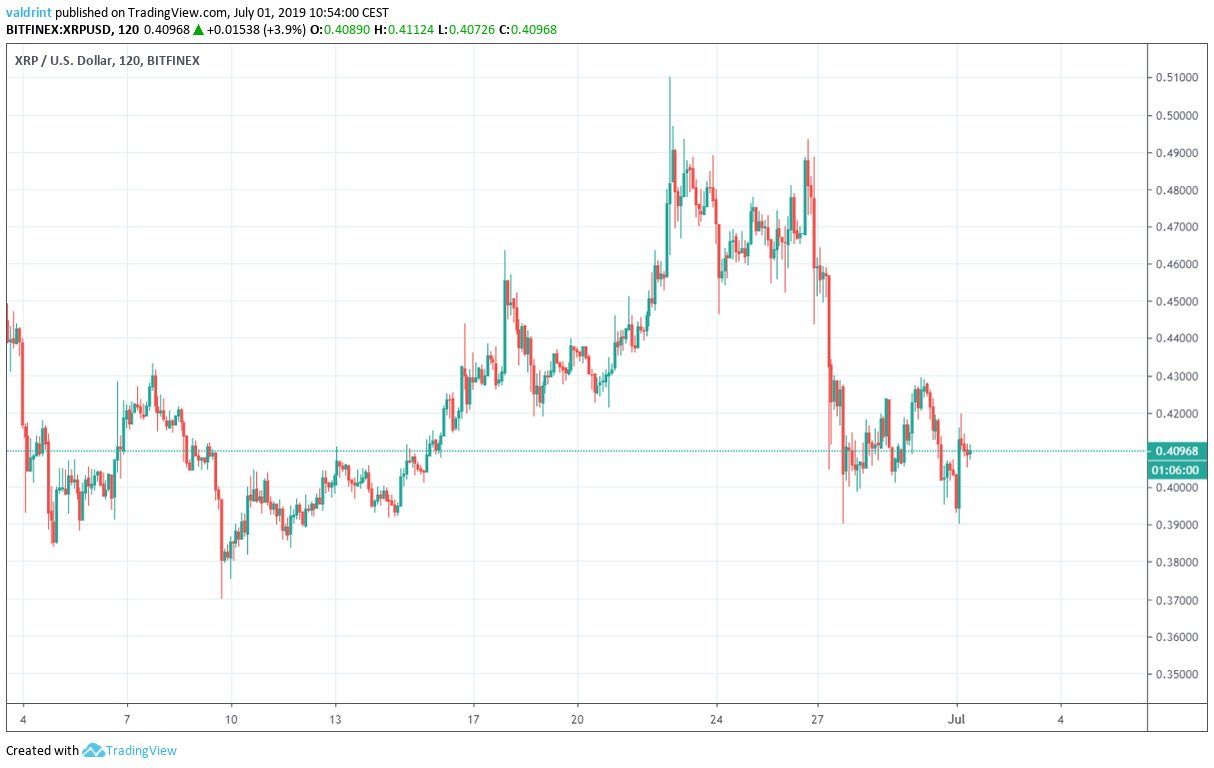
On June 27 and 30, it reached lows of close to $0.4.
Will the XRP price break down or is there upside potential? Below we are going to analyze the price of XRP in different time-frames in order to answer this question.
You can read our previous analysis here.
If you’re interested in trading XRP with our partner exchange, get set up on XCOEX by following this link.
XRP: Trends and Highlights for July 1
- The price of XRP is following a short-term descending support line.
- There is bullish divergence developing in the RSI and the MACD.
- There is support between $0.38 and $0.39.
- The XRP price is facing resistance from the daily moving averages.
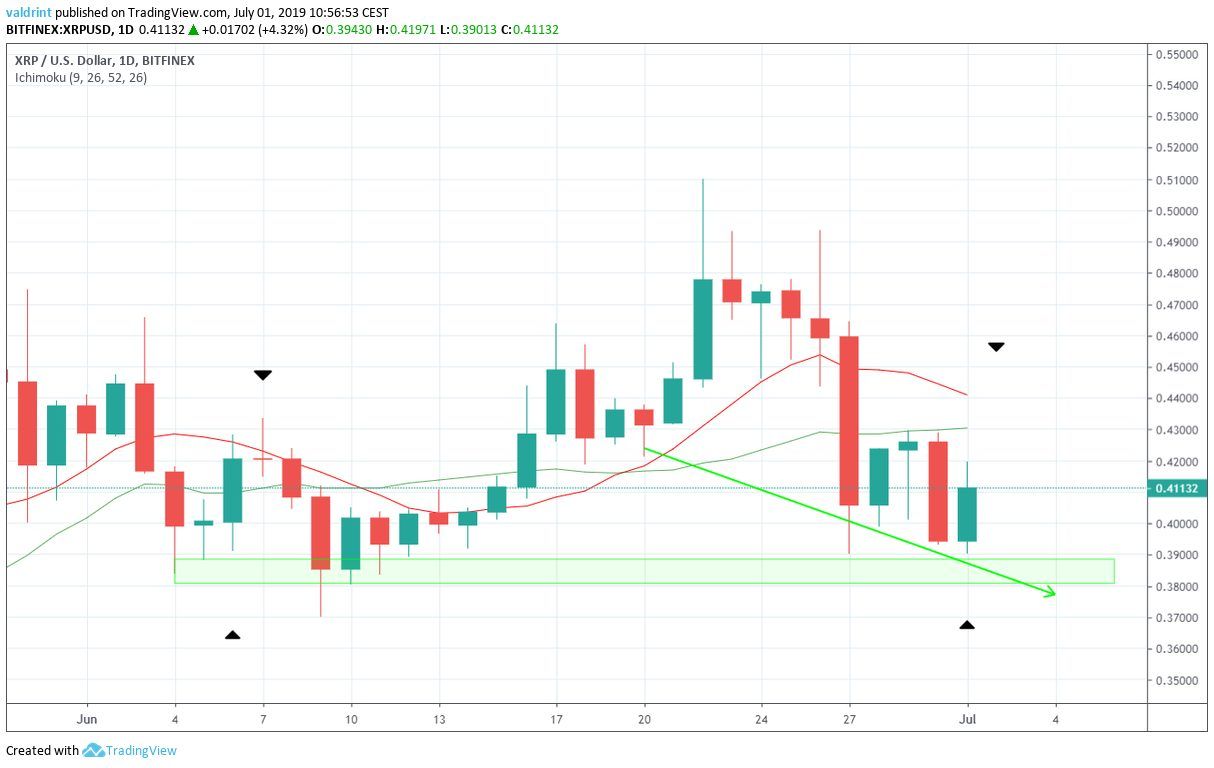
XRP Price Finding Descending Support
Since June 21, the XRP price has been following a descending support line. It was most recently validated on June 30.
Furthermore, there is a significant support area between $0.38 and $0.39.
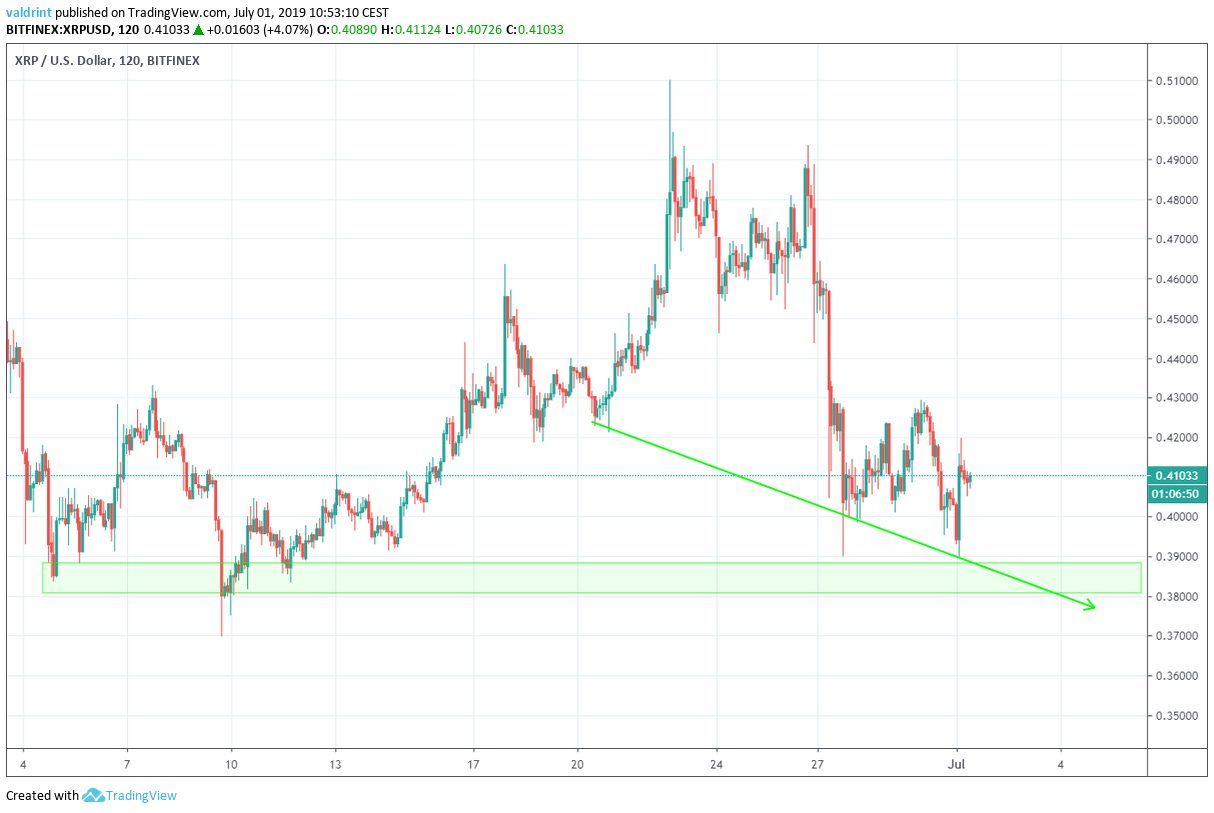
If the XRP price continues to decrease at the rate predicted by the lane, it should reach this area by June 4 the latest.
This would be a likely place to initiate a reversal.
An analysis of the RSI and the MACD support this possibility.
The support line touched on both June 27 and 30. Since the support line is descending, these were both lower lows.
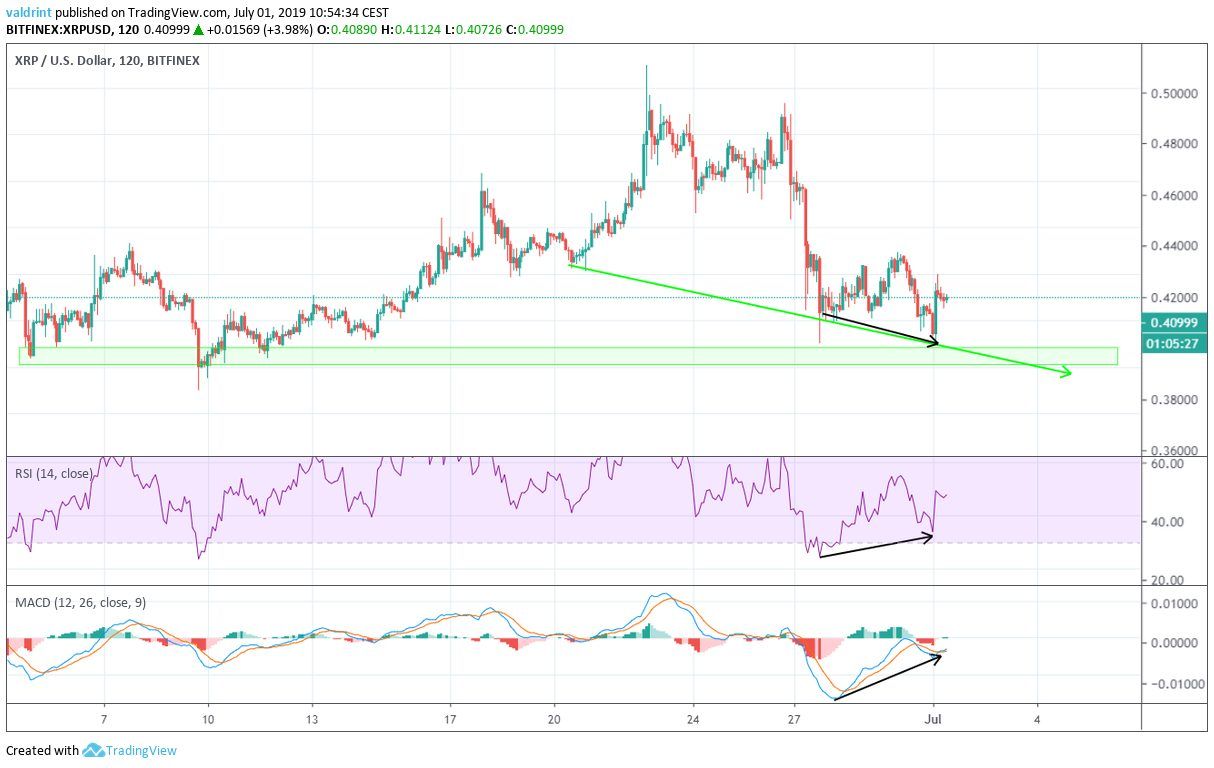
During this period, the RSI and the MACD have generated higher values. This is known as bullish divergence and often precedes price increases.
If the price begins a reversal, where will it find resistance?
Resistance Levels for the XRP Price
If the price begins to increase, it is likely to face resistance at $0.427 and $0.44, the 0.382 and the 0.5 fib level of the decrease.
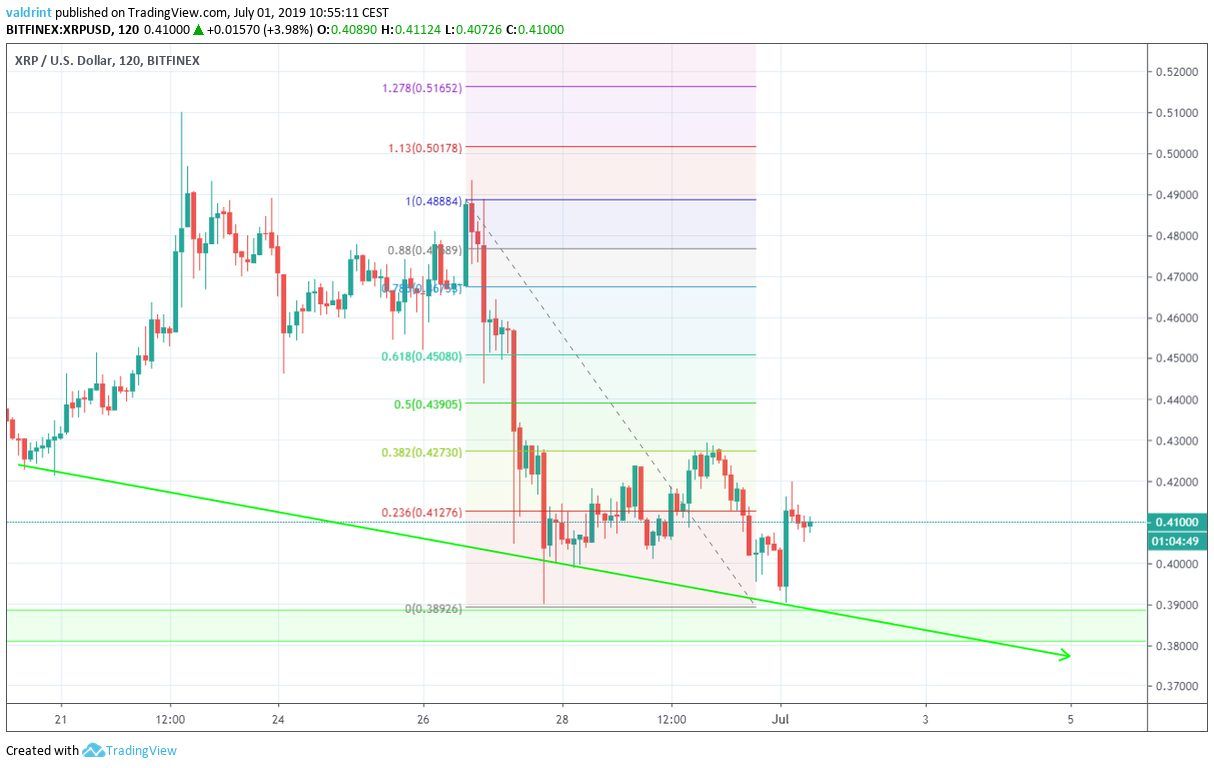
The XRP price reached the first level twice on June 29 and 30, before decreasing. It is currently in the process of beginning another upward move, which should take it to at least $0.44.
In a longer-term outlook, the price is trading below and facing resistance from both the 10- and 20-day moving averages.
The moving averages are close to making a bearish cross. The last time this occurred was June 10.
If the price follows a similar pattern to the days which preceded the previous cross, it will soon begin an upward move that will take it to the moving averages near $0.45.
Therefore, the short- and long-term indicators both support a short-term increase towards $0.45.
Summary
The price of XRP is following a short-term descending support line. An analysis of technical indicators supports a price increase towards one of the resistance areas outlined above.
Afterward, we believe the price is likely to decrease and reach the support area outlined above.
What do you think about the price of XRP? Let us know your thoughts in the comments below!
Disclaimer: This article is not trading advice and should not be construed as such. Always consult a trained financial professional before investing in cryptocurrencies, as the market is particularly volatile.
Images are courtesy of TradingView.
