
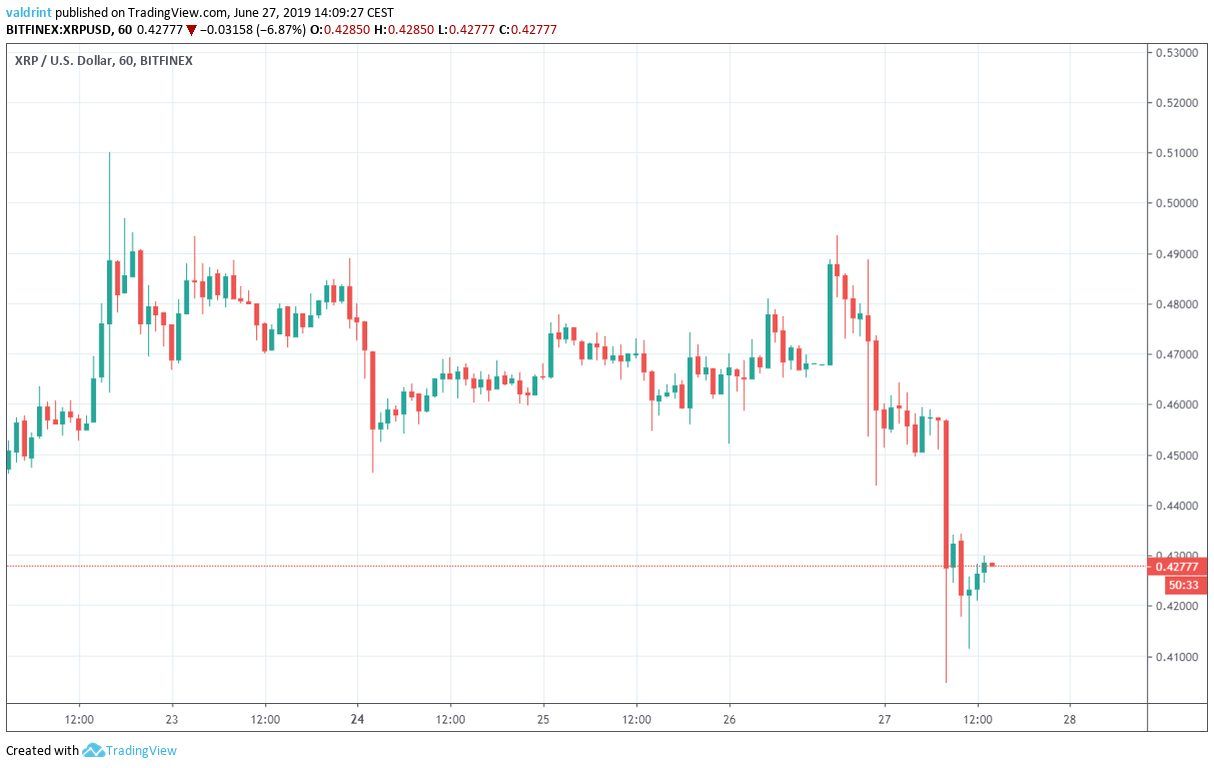
On June 22, 2019, the XRP price briefly reached a high above $0.50. After a slight decrease, it made another attempt at a breakout on June 26.

However, the attempt was unsuccessful and the price has been decreasing since.
Where will the price find support? Below, we will analyze the XRP price in different time-frames alongside technical indicators in order to answer this question.
You can read our previous analysis here.
XRP Price: Trends and Highlights for June 27
- The XRP price has failed to retrace past the 0.786 fib level of the previous drop.
- A bearish divergence has developed in the RSI and the MACD.
- The price is trading below the 10- and 20-day moving averages.
- There is support near $0.36.
XRP Price: Fibonacci Levels
In order to identify support and resistance levels, we drew a Fibonacci retracement from the high of $0.60 reached in September 2018 to the low of $0.29 reached in December of the same year. The most recent increases took the XRP price slightly above the 0.618 fib level at $0.48. Even though a breakout occurred, the price was unable to sustain it and immediately reversed.
Support levels to keep an eye on are found near $0.4, where the price is currently trading and near $0.36. The price of XRP has reacted to the $0.36 level both during highs at the beginning of April and lows during the end of May. Therefore, if the price continues to decrease, it is likely to find support there.
The most recent increases took the XRP price slightly above the 0.618 fib level at $0.48. Even though a breakout occurred, the price was unable to sustain it and immediately reversed.
Support levels to keep an eye on are found near $0.4, where the price is currently trading and near $0.36. The price of XRP has reacted to the $0.36 level both during highs at the beginning of April and lows during the end of May. Therefore, if the price continues to decrease, it is likely to find support there.
Technical Indicators
The XRP price is analyzed at daily intervals alongside the RSI and the MACD in the first graph and the 10- and 20-day moving averages (MA) in the second one
On May 14, the XRP price reached a high of $47.8. This was combined with a high in the RSI, while the MACD followed suit shortly after.
Since then, the price has created two higher highs.
Conversely, the RSI and the MACD have both generated lower highs. Furthermore, the latter is in the process of creating a bearish cross.
 These readings indicate that it is possible that the price will begin a reversal. They preceded the decrease from $0.5 to the current price.
Furthermore, the MAs are also starting to give a bearish outlook.
These readings indicate that it is possible that the price will begin a reversal. They preceded the decrease from $0.5 to the current price.
Furthermore, the MAs are also starting to give a bearish outlook.
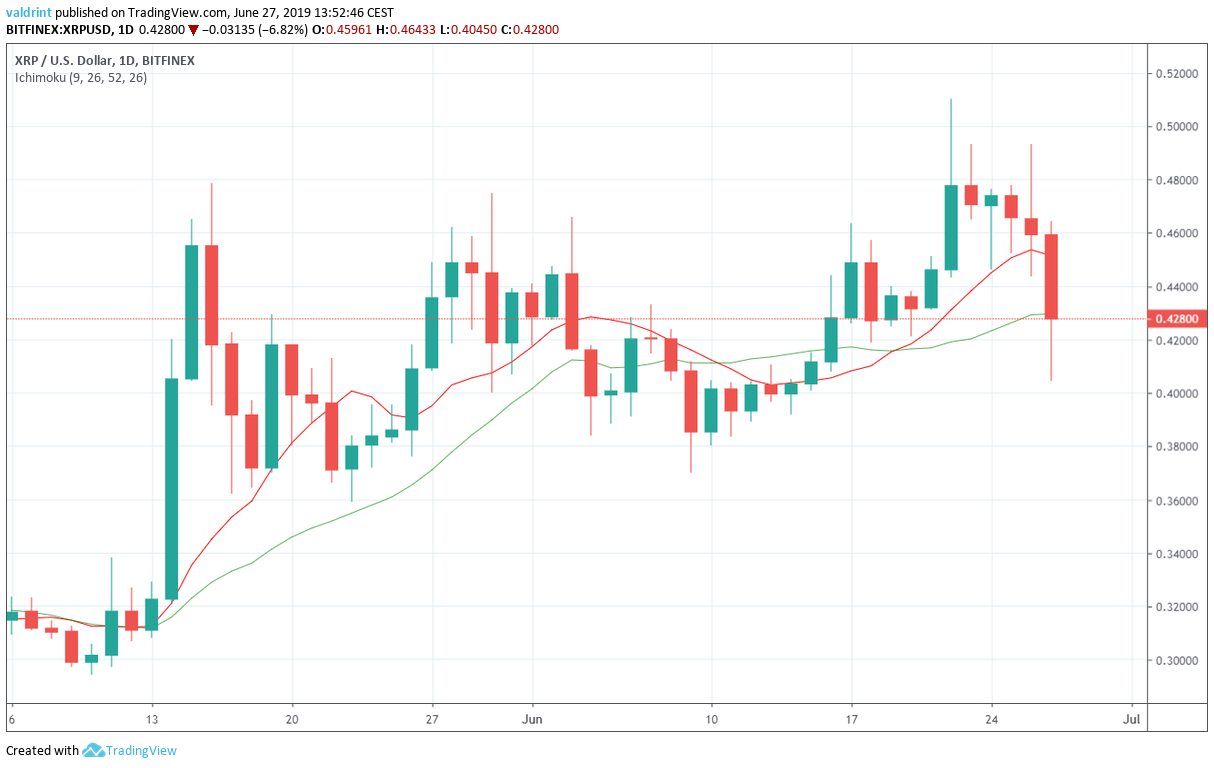 Today’s decrease brought the XRP price below both MAs, which are currently providing resistance. However, a bearish cross has yet to occur.
If the price closes below the 20-day MA and, especially, below $0.4, it would likely cause the price to reach the support level at $0.36.
Today’s decrease brought the XRP price below both MAs, which are currently providing resistance. However, a bearish cross has yet to occur.
If the price closes below the 20-day MA and, especially, below $0.4, it would likely cause the price to reach the support level at $0.36.
Short-Term
A closer look shows that the XRP price has been following an ascending resistance line since May 14. Furthermore, it is possible that it is following a steep ascending support line since reaching a low on June 10.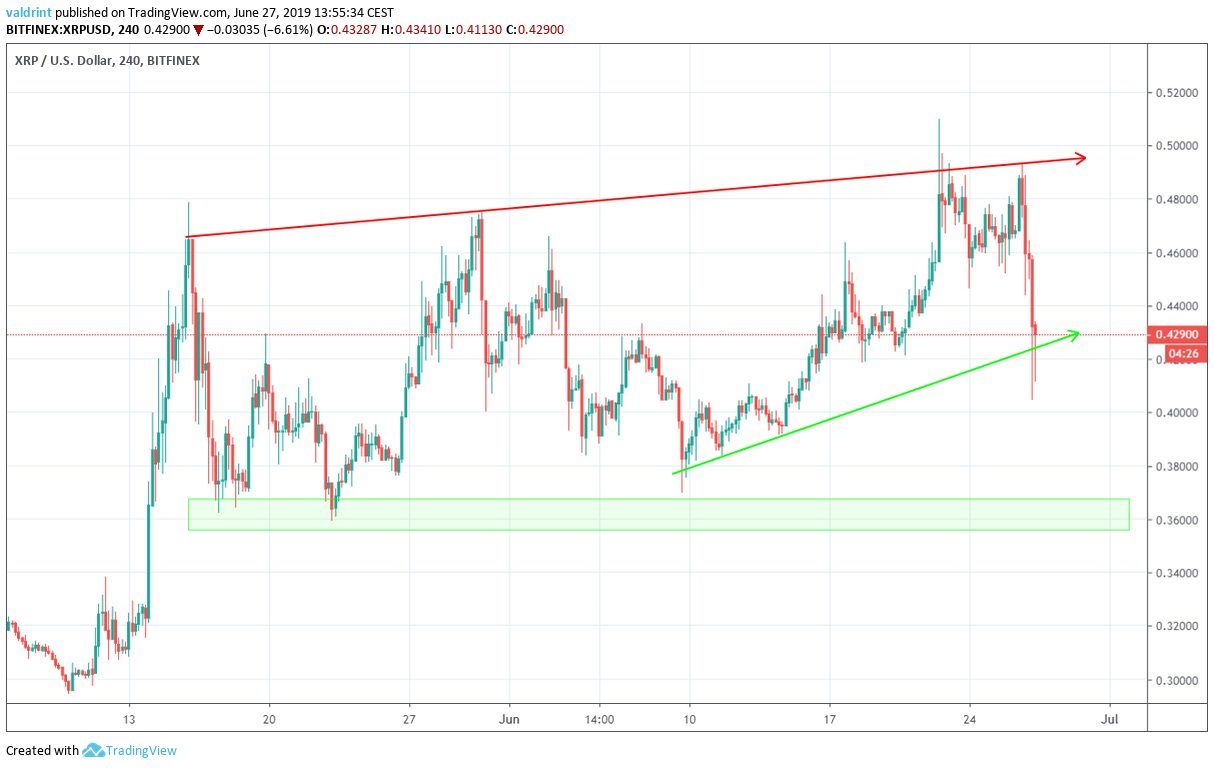 The recent decrease brought the price below this support line. However, it immediately sprung back up and has seemingly found support above it.
Continued increases at the rate predicted by the line would validate the support line, which when combined with the ascending resistance line creates an ascending wedge, which is a bearish pattern. If, however, the line is invalidated, the price is likely to find support near $0.36 — similar to what it did between May 17 and 23.
The recent decrease brought the price below this support line. However, it immediately sprung back up and has seemingly found support above it.
Continued increases at the rate predicted by the line would validate the support line, which when combined with the ascending resistance line creates an ascending wedge, which is a bearish pattern. If, however, the line is invalidated, the price is likely to find support near $0.36 — similar to what it did between May 17 and 23.
Summary
The XRP price briefly increased above $0.50 before a reversal ensued. Recently, it has begun to show signs of weakness. XRP/USD is possibly trading inside an ascending wedge, during a period in which it has developed significant bearish divergence. If the price continues to decrease, it is likely to find support near $0.36. What do you think about the price of XRP? Let us know your thoughts in the comments below!Disclaimer: This article is not trading advice and should not be construed as such. Always consult a trained financial professional before investing in cryptocurrencies, as the market is particularly volatile. Images are courtesy of TradingView.
Disclaimer
In line with the Trust Project guidelines, this price analysis article is for informational purposes only and should not be considered financial or investment advice. BeInCrypto is committed to accurate, unbiased reporting, but market conditions are subject to change without notice. Always conduct your own research and consult with a professional before making any financial decisions. Please note that our Terms and Conditions, Privacy Policy, and Disclaimers have been updated.

Valdrin Tahiri
Valdrin discovered cryptocurrencies while he was getting his MSc in Financial Markets from the Barcelona School of Economics. Shortly after graduating, he began writing for several different cryptocurrency related websites as a freelancer before eventually taking on the role of BeInCrypto's Senior Analyst.
(I do not have a discord and will not contact you first there. Beware of scammers)
READ FULL BIO
Sponsored
Sponsored