See More

XRP Price Analysis: Will XRP/USD Begin An Upward Move?

3 mins
Updated by Adam James
Join our Trading Community on Telegram
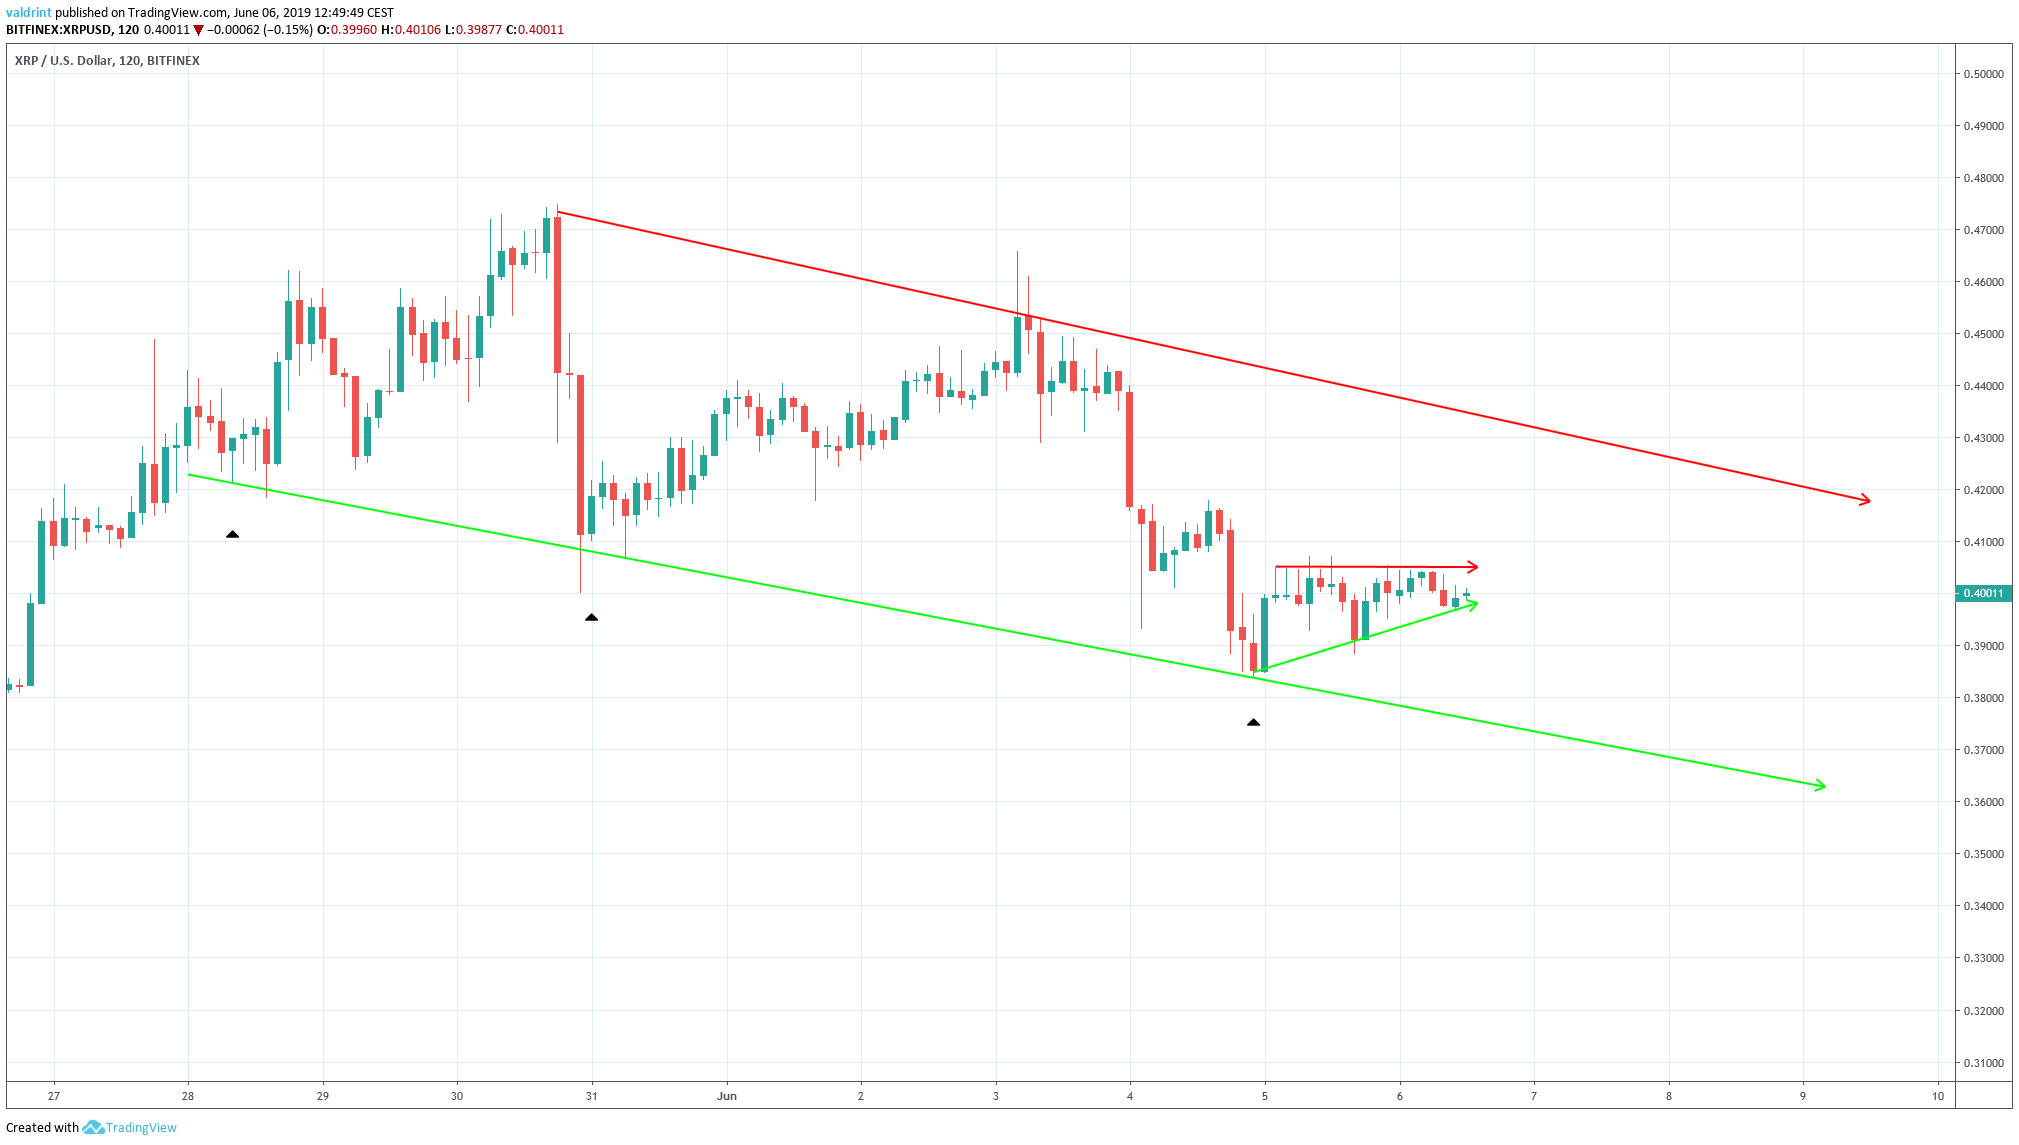
On May 30, the XRP price reached a high of $0.474. A rapid decrease ensued, which was followed by a gradual increase. On Jul 3, the price reached highs near $0.47. Another upward move began shortly after. xrp Outlook
The XRP price reached lows near $0.38 on Jul 5. It has been increasing since. Where will it go next? Keep reading below and find out.

XRP Price: Trends and Highlights for June 6

  • The XRP price reached a high on May 30.
  • It is trading inside a descending channel.
  • It is also trading inside a short-term ascending triangle.
  • The moving averages have made a bullish cross.
  • The MACD is close to doing the same.
  • There is resistance near $0.42 and support near $0.37.

Trading Pattern For XRP

The XRP price is analyzed at two-hour intervals from May 28 to June 6 in order to trace the current pattern.
On May 28, XRP/USD reached a low of $0.462. A gradual increase began and the XRP price reached a high of $0.474 on May 30. Since then, it has been trading inside the descending channel outlined below:
xrp Descending Channel On Jun 5, the XRP price touched the support line of the channel before beginning an upward move.
Since then, it has been possibly trading inside the ascending triangle outlined below:
Ascending Triangle
At the time of writing, the XRP price was trading close to the support line of the triangle. Furthermore, it is approaching the point of convergence between support and resistance at which time a decisive upward or downward move is likely to occur.
If previous movements are a predictor of what is going to happen, then the price is likely to begin an upward move:
Previous Movement
As seen from the graph above, the support line has been touched three times. During the previous two times, an upward move began shortly after and the price increased all the way towards the resistance line.
The last time the XRP price touched the support line was on Jun 5. It has yet to reach the resistance line.
Let’s take a look at some technical indicators to see if that is likely.

XRP Price: Technical Indicators

The XRP price is analyzed alongside the 10- 20- and 100-period moving averages (MA) and the MACD below:
On Jun 6, the 10-period MA crossed above the 20-period one. This is known as a bullish cross and often indicates that an uptrend has begun.
Moving Averages On the same day, the MACD is in the process of doing the same. Both these movements support an upward move which would cause the price to break out. The analysis from these technical indicators makes it likely that the price will break out from the triangle. If it does so, where will it begin to reverse?

Reversal Areas

One support area and one resistance area is traced for Ripple (XRP) below. Reversal 
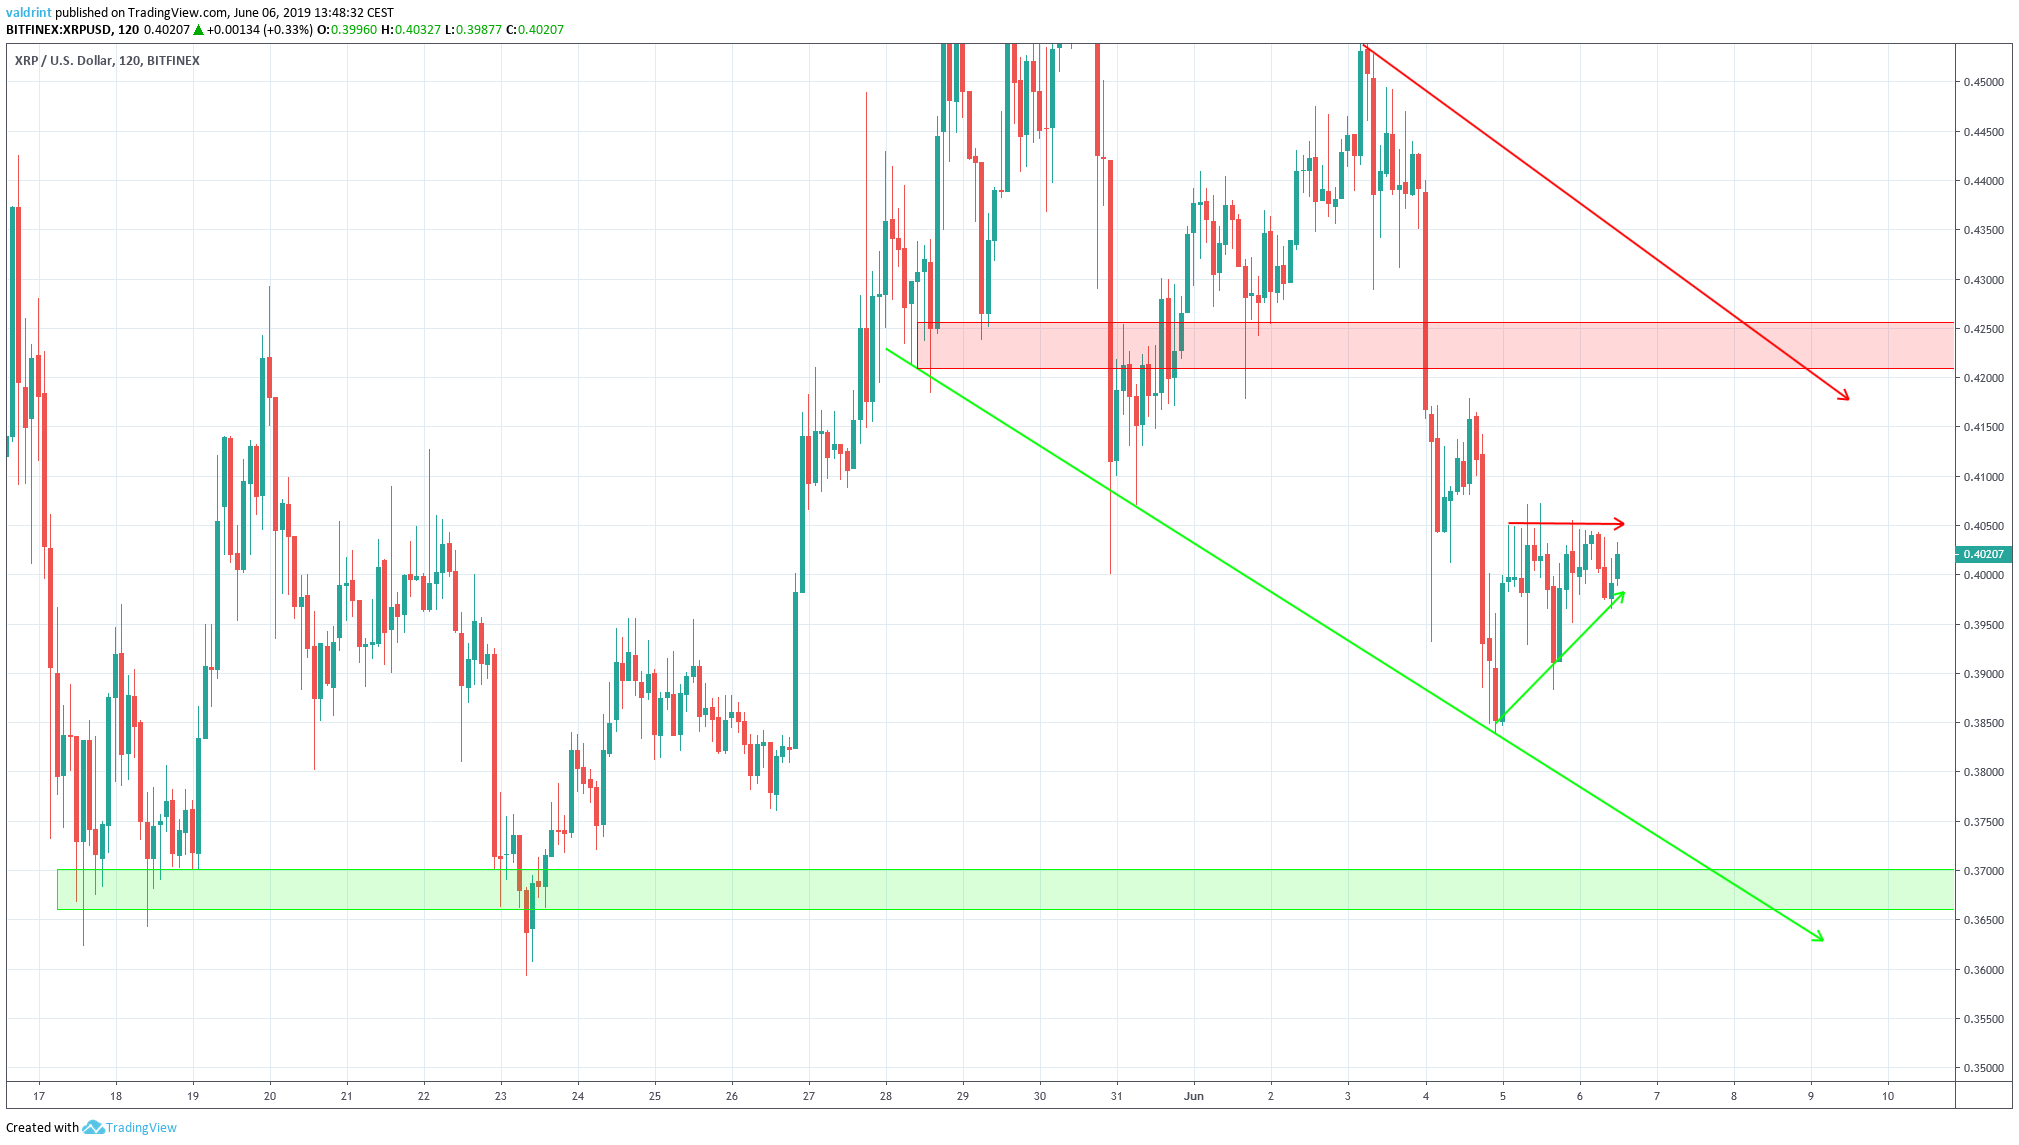
The closest support area is found near $0.37. If the XRP price breaks down the ascending triangle, it is likely to provide a reversal. The closest resistance area is found near $0.42. It coincides with the resistance line of the wedge. A breakout from the triangle would be required for the price to reach this area. An analysis of technical indicators supports this possibility. However, as stated in our previous analysis, the XRP price is likely in a long-term downtrend. This would only be a short-term upward move.

Summary

To conclude, the XRP price made a high on May 30 and is currently trading inside a descending channel. Furthermore, it is trading inside a short-term ascending triangle. The technical indicators support a breakout from this short-term pattern. What do you think will happen to XRP price? Let us know in the comments below. Disclaimer: This article is not trading advice and should not be construed as such. Always consult a trained financial professional before investing in cryptocurrencies, as the market is particularly volatile.
Top crypto projects in the US | April 2024

Trusted

Disclaimer

In line with the Trust Project guidelines, this price analysis article is for informational purposes only and should not be considered financial or investment advice. BeInCrypto is committed to accurate, unbiased reporting, but market conditions are subject to change without notice. Always conduct your own research and consult with a professional before making any financial decisions. Please note that our Terms and ConditionsPrivacy Policy, and Disclaimers have been updated.

Valdrin-Tahiri.jpg
Valdrin Tahiri
Valdrin discovered cryptocurrencies while he was getting his MSc in Financial Markets from the Barcelona School of Economics. Shortly after graduating, he began writing for several different cryptocurrency related websites as a freelancer before eventually taking on the role of BeInCrypto's Senior Analyst. (I do not have a discord and will not contact you first there. Beware of scammers)
READ FULL BIO
Sponsored
Sponsored