
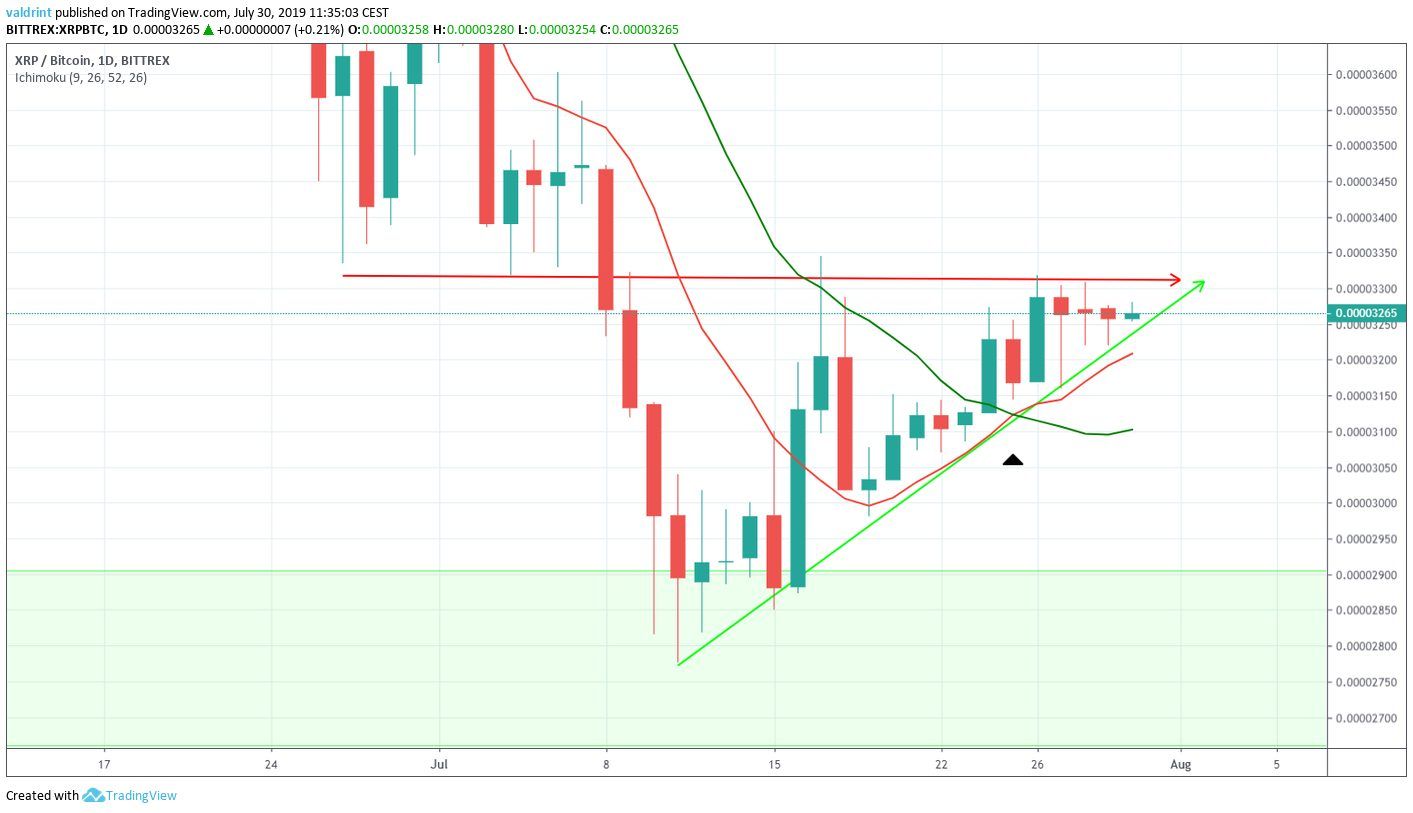
On July 11, 2019, the XRP (XRP) price reached a low of 2777 satoshis. An upward move ensued. On July 17, it reached highs of 3345 satoshis. After a slight decrease, the price reached similar highs on July 25.
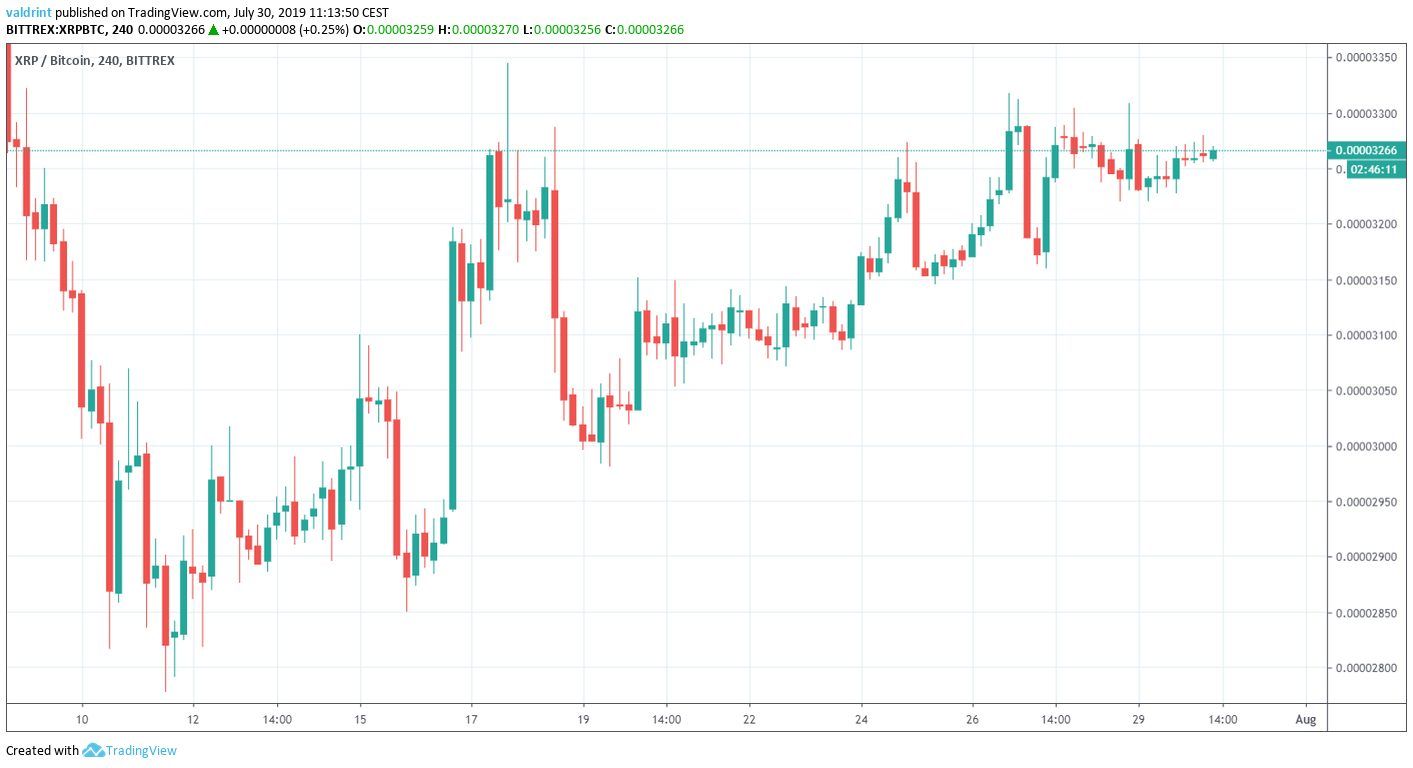
At the time of writing, the Ripple price was trading near 3300 satoshis.
Will XRP finally increase above this resistance? In order to answer this question, we will analyze the XRP price in different time-frame alongside technical indicators.
For our previous analysis click here.
If you are interested in trading XRP (XRP) with a multiplier of up to 100x on our new partner exchange with the lowest fees, follow this link to get a free StormGain account!
XRP Price: Trends and Highlights for July 30
- XRP/BTC is trading inside an ascending triangle.
- The RSI suggests that the price will break out.
- Daily moving averages have made a bullish cross.
- There is resistance at 4000 satoshis.
Ascending Triangle
A look at the two-hour time-frame shows that the XRP price is trading inside an ascending triangle.
The ascending triangle is considered a bullish pattern, making price breakouts more likely.
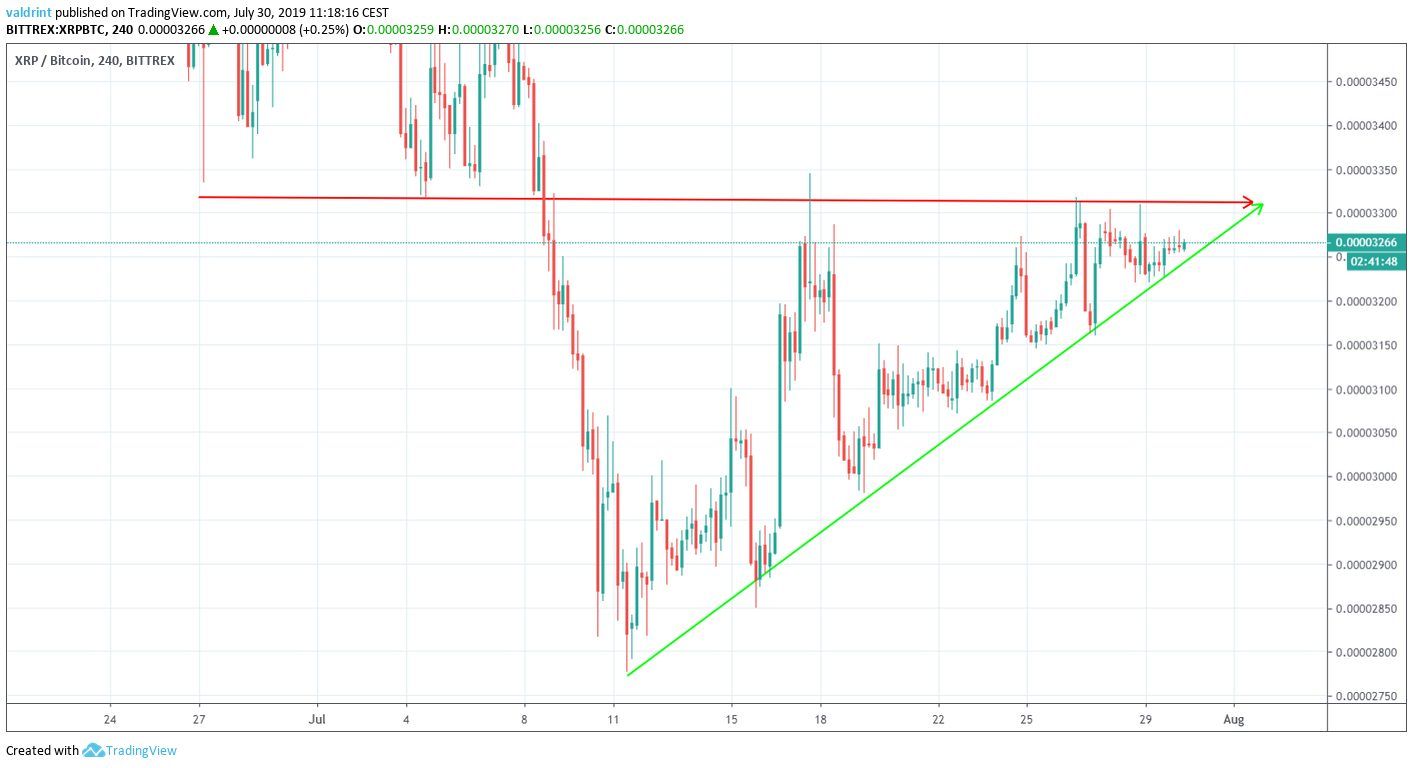
The resistance line is currently at 3400 satoshis.
Additionally, XRP is approaching the end of the triangle.
Once that occurs, either a breakdown or breakout is very likely to occur.
Will the Ripple price break out?
Long-Term
A look at the long-term shows that the beginning of the triangle’s support line coincides with a very significant support area.
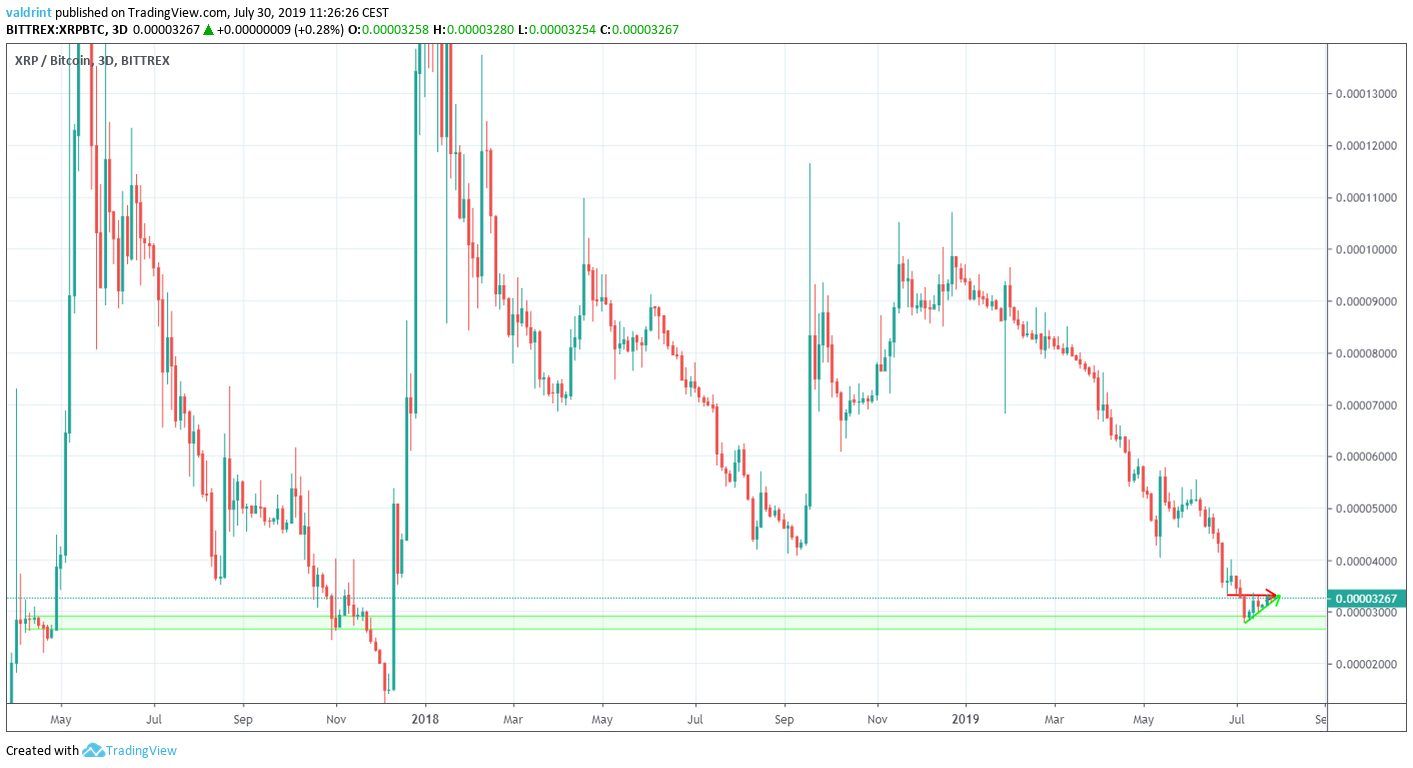
This support area is found near 2750 satoshis.
The XRP price has not traded below it since December 2017.
The fact that a bullish pattern was created inside a significant support area increases the possibility that it will initiate a reversal.
Technical Indicators
A look at the RSI gives us our first bullish sign.
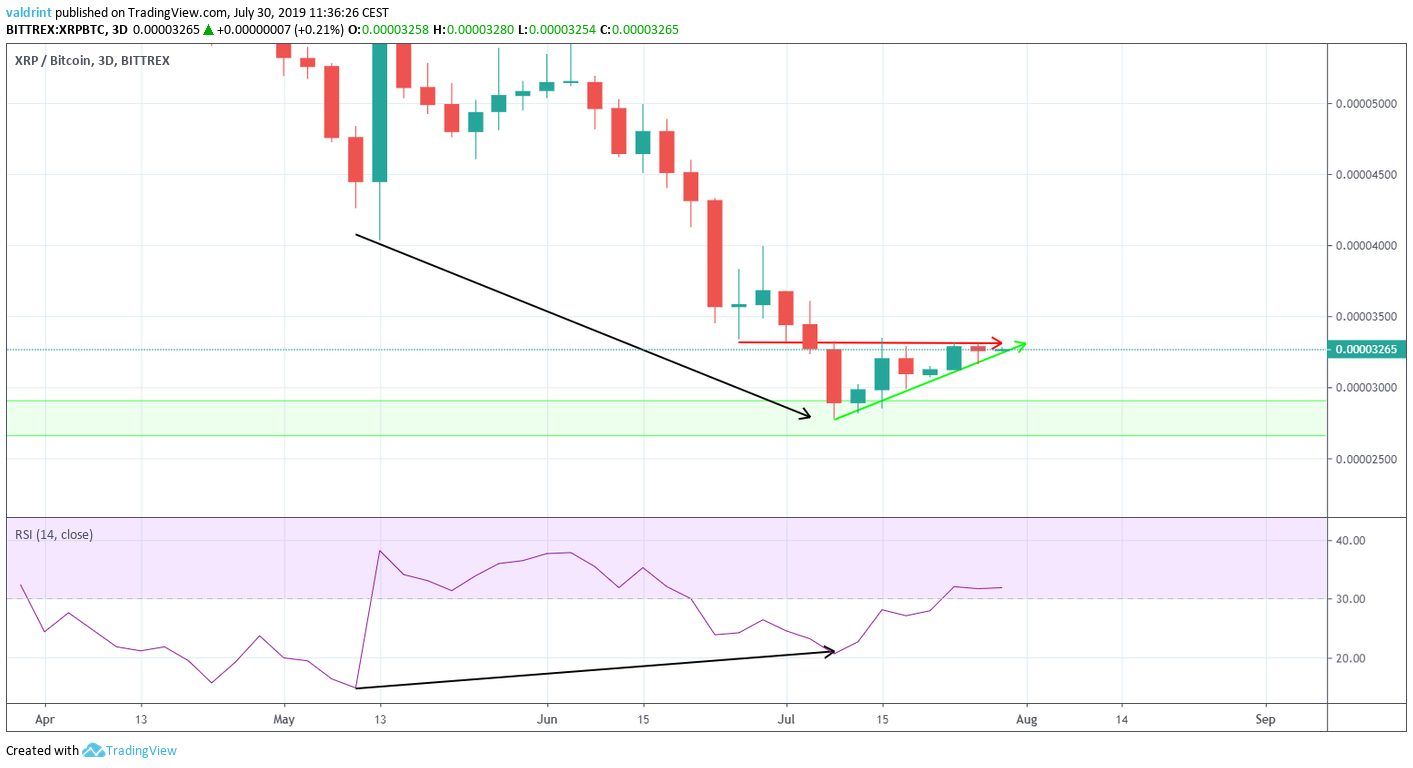
The RSI has been generating bullish divergence since May 10.
Additionally, the XRP price divergence is very significant and is visible in the three-day time-frame.
It is not common for the RSI to generate divergence at such long-term time-frames.
Furthermore, a look at the moving averages (MA) indicates that the price has likely already begun an uptrend.
A bullish cross transpired on July 25.
Since then, the Ripple price has been trading above both MAs.
The 10-day MA has been providing very close support to the price.
The use of these indicators suggests that XRP is likely to break out from the triangle.
If it does, where will it find resistance?
Reversal Areas
In case a breakout occurs, one resistance area is outlined below.
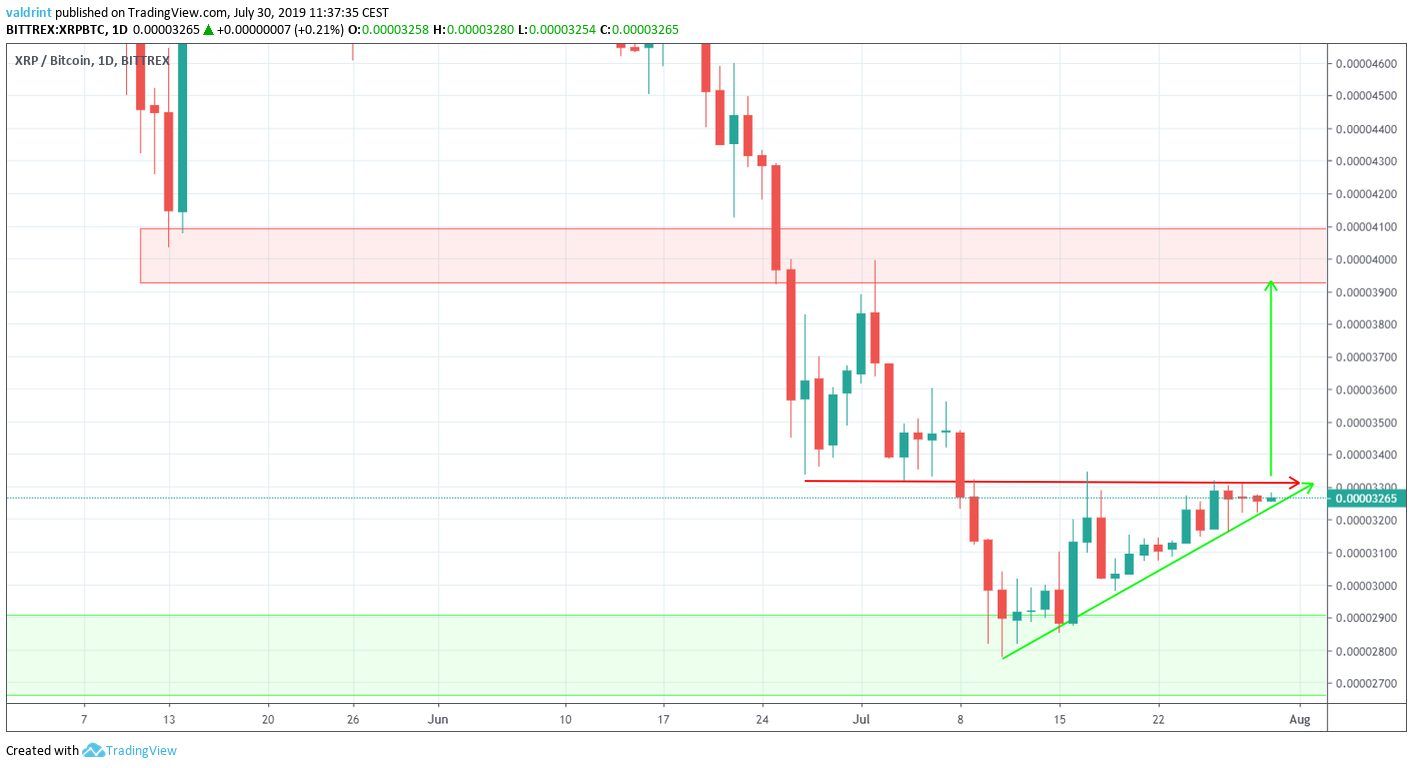
It is found near 4000 satoshis.
According to our analysis, it is likely that the XRP price will reach it.
Summary
The XRP price is trading inside an ascending triangle.
According to our analysis, it is likely to break out from the triangle and reach the resistance area outlined above.
Do you think XRP will break out from the triangle? Let us know in the comments below.
Disclaimer: This article is not trading advice and should not be construed as such. Always consult a trained financial professional before investing in cryptocurrencies, as the market is particularly volatile.
Images are courtesy of TradingView.
