


On July 11, 2-10, the XRP (XRP) price reached a low of 2777 satoshis. An upward move ensued. Price reached highs of nearly 3300 satoshis on two separate occasions, July 17 and 24.
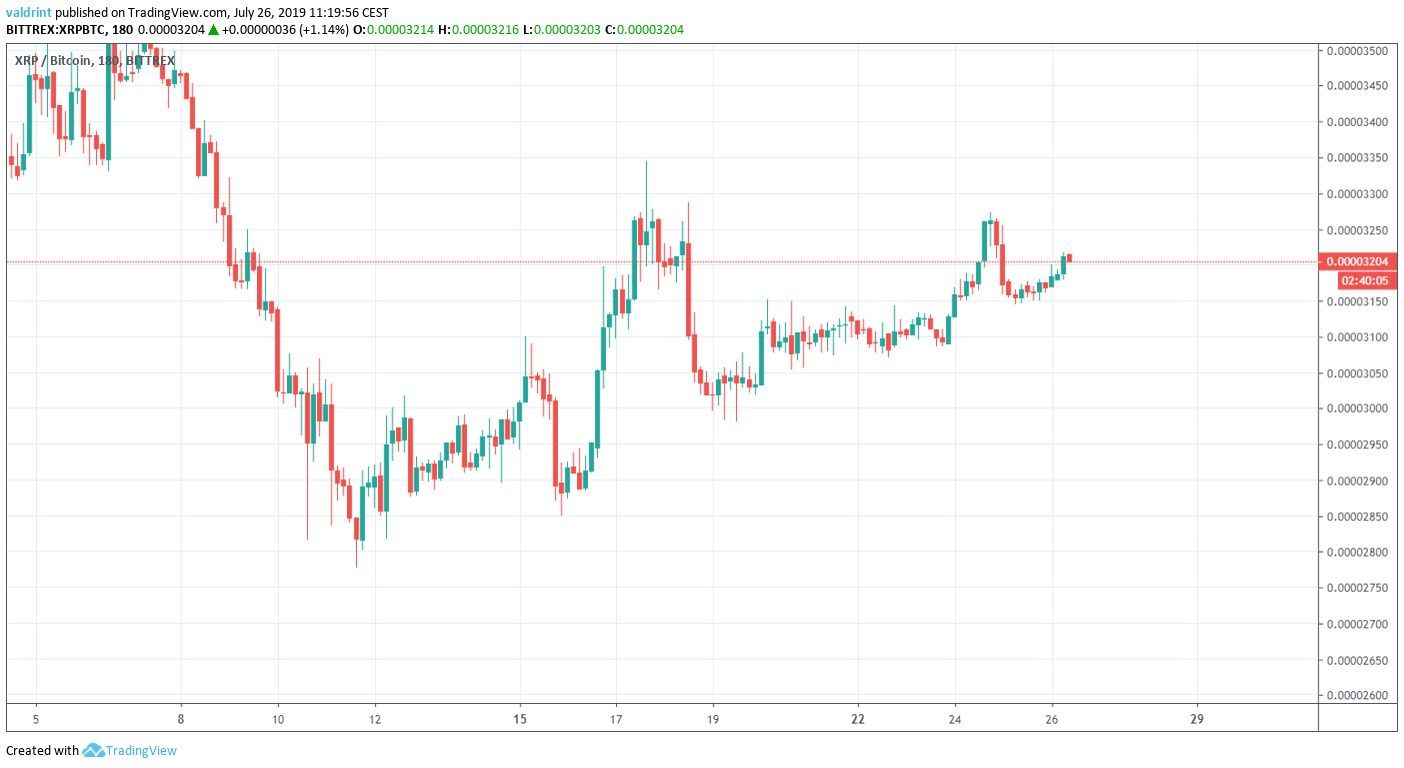
Where will XRP go next? If you want to find out, continue scrolling.
For our previous analysis click here.
If you are interested in trading XRP (XRP) with a multiplier of up to 100x on our new partner exchange with the lowest fees, follow this link to get a free StormGain account!
XRP Price: Trends and Highlights for July 26
- XRP/BTC is trading inside an ascending triangle.
- Daily moving averages have made a bullish cross.
- There is a very significant bullish divergence developing in the RSI & MACD.
- There is resistance at 4000 satoshis
Ascending Triangle
Since reaching the aforementioned low on July 11, the XRP price has been trading inside the ascending triangle outlined below.
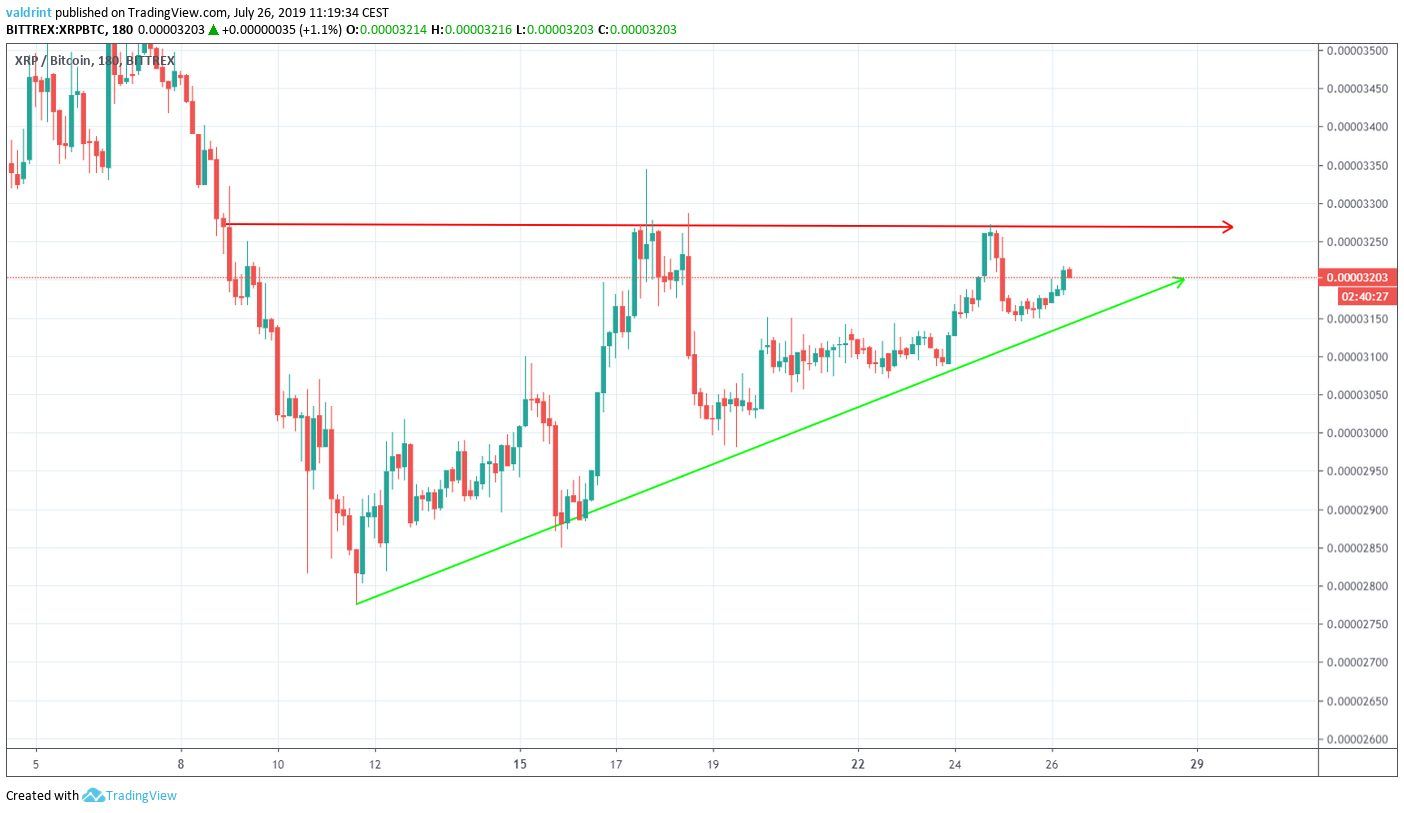
At the time of writing, it was approaching the end of the triangle.
At that point, a decisive move should occur.
Since the ascending triangle is a bullish pattern, it is more likely that it will breakout.
Let’s analyze this possibility thoroughly.
Beginning of The Ripple Price Uptrend
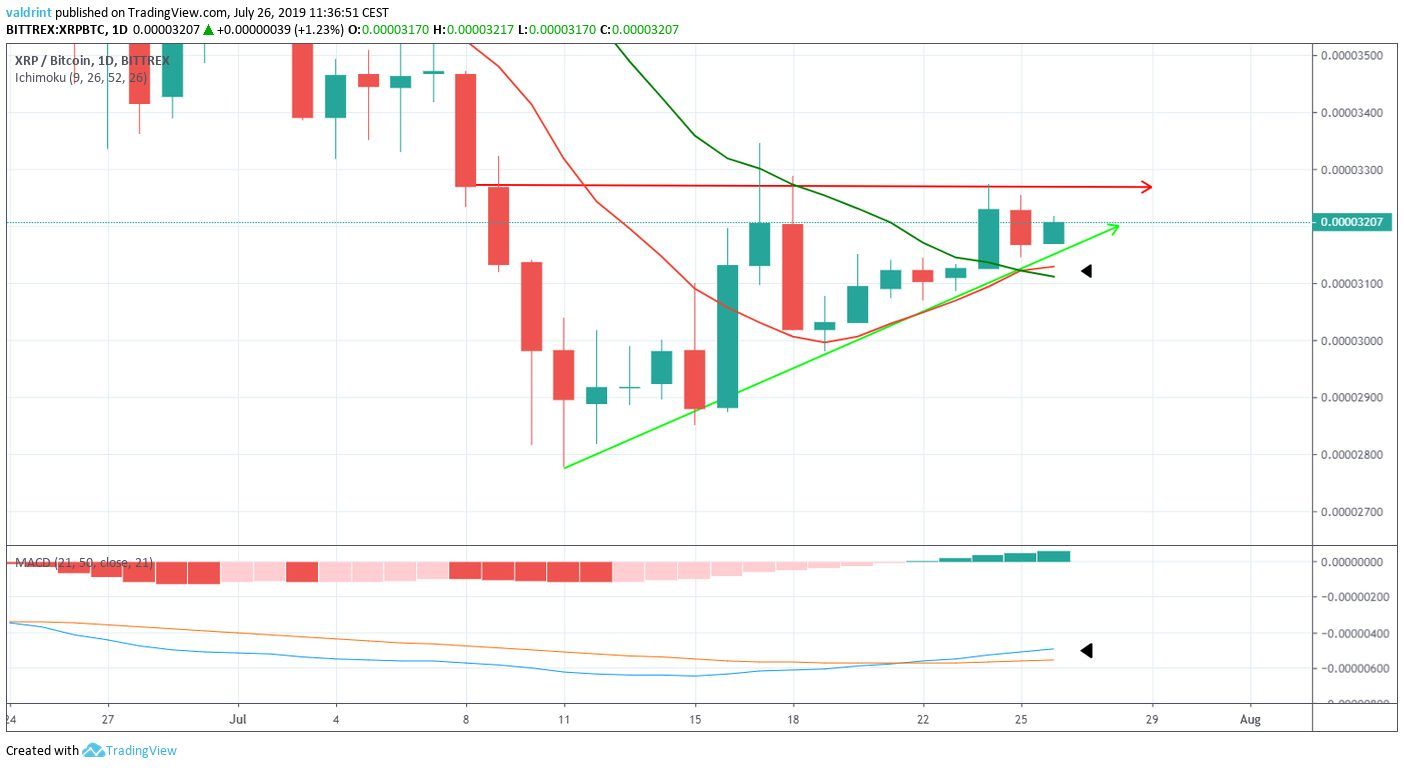
In our previous analysis, we stated that:
they (the MAs) are very close to making a bullish cross.
If that occurs, it can be considered a confirmation that an uptrend has begun.
On July 25, a bullish cross occurred between the 10- and 20-day MAs.
This was preceded by a bullish cross in the MACD on July 22.
At the time of writing, the Ripple price is trading above both.
Additionally, the creation of the triangle was preceded by a significant long-term bullish divergence.
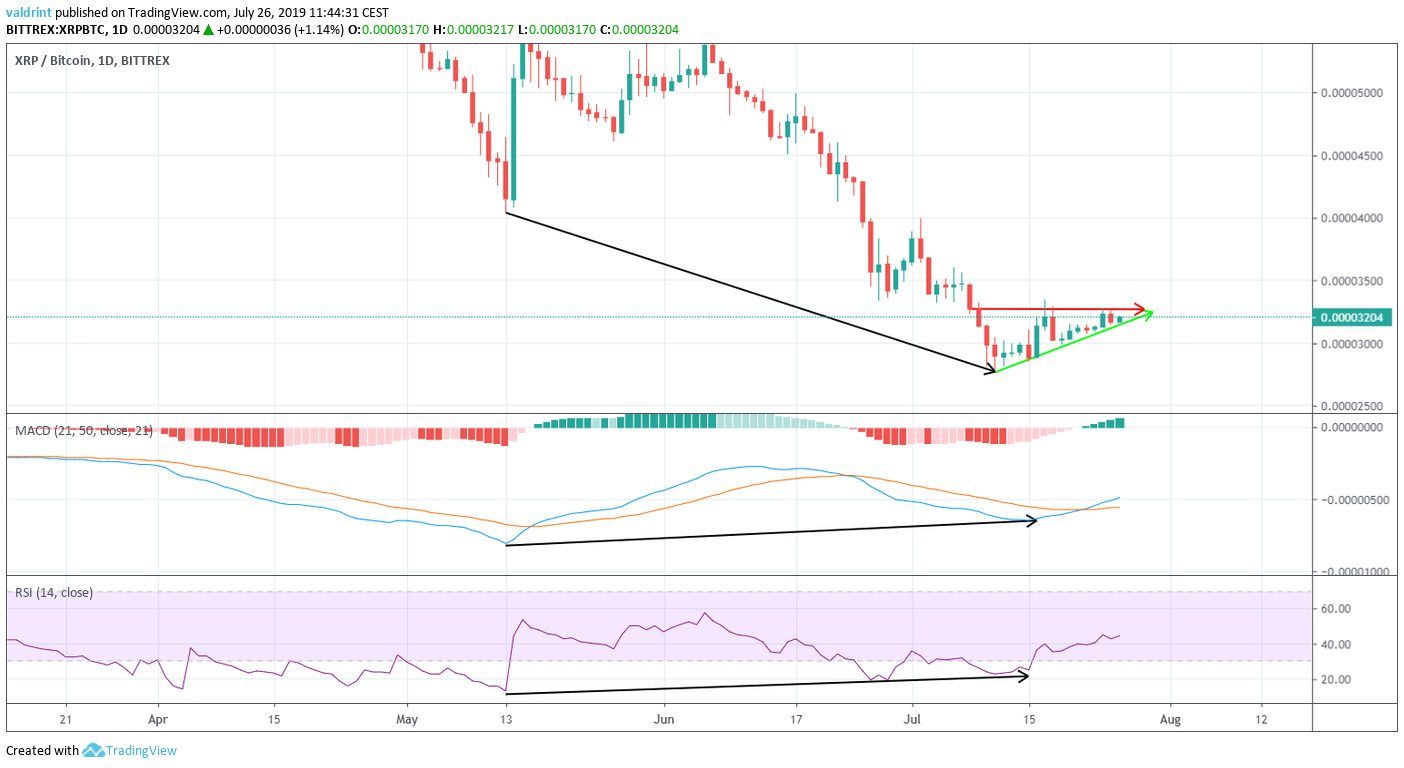
The divergence began on May 13. It is present in both indicators, greatly increasing its significance.
Furthermore, it is also visible in three-day time-frames, albeit less so.
The use of these indicators suggests that the price is going to break out from the triangle.
Reversal Areas
If it does, one area that can provide a reversal is outlined below.
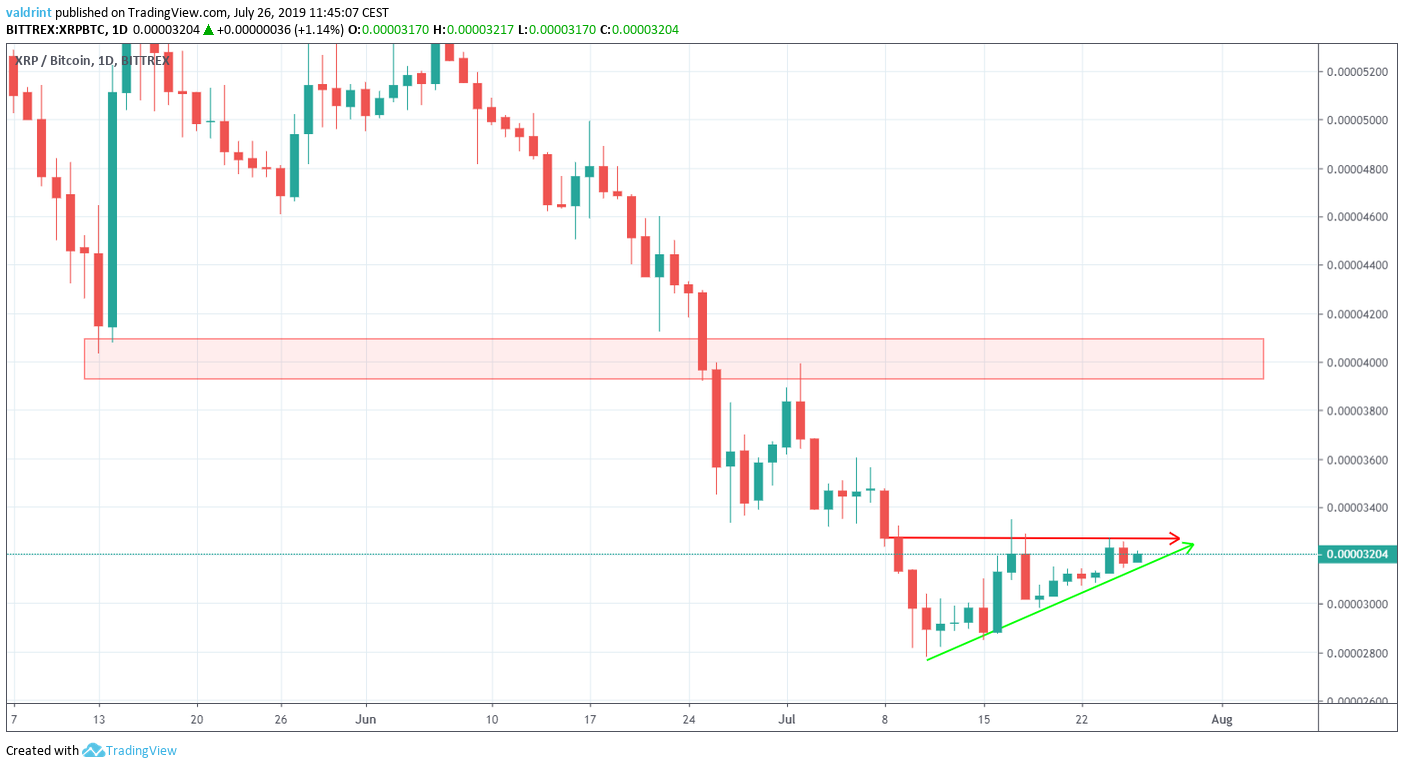
The closest resistance area is found near 4000 satoshis.
If the XRP price breaks out, it is very likely to reach it.
Summary
The Ripple price is trading inside an ascending triangle.
According to our analysis, it is likely to break out and reach the resistance area outlined above.
Do you think XRP will break out from the triangle? Let us know in the comments below.
Disclaimer: This article is not trading advice and should not be construed as such. Always consult a trained financial professional before investing in cryptocurrencies, as the market is particularly volatile.
Images are courtesy of Shutterstock, TradingView.


