
On September 6, 2019, the XRP price reached a low of 2366 satoshis. An upward move followed and the price reached a high of 2503 satoshis the next day. Since then, XRP has been gradually increasing, creating several higher highs.
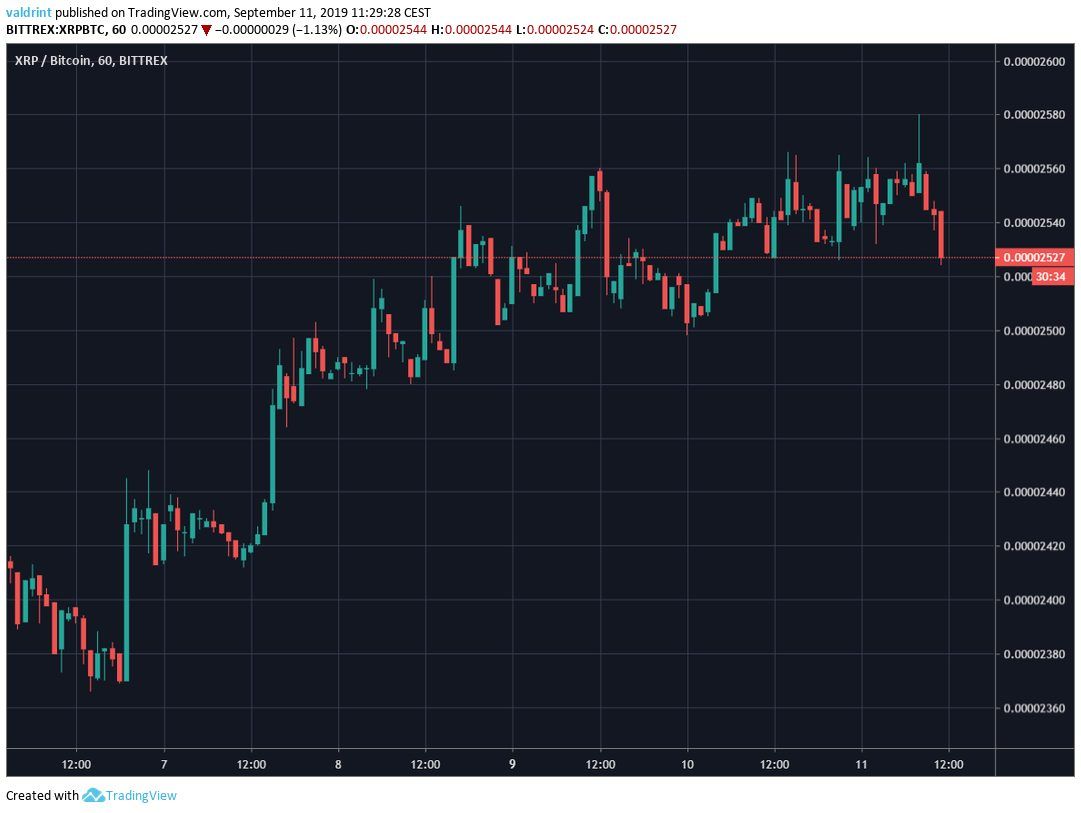
At the time of writing, it was trading close to 2530 satoshis.
How long will the increase continue for XRP? Continue reading below if you want to find out.
For our previous analysis, click here.
XRP Price: Trends and Highlights for September 11
- XRP/BTC is following a short-term ascending support line.
- There is resistance at 2580 satoshis.
- A bearish divergence has developed in the RSI & MACD.
- XRP has created a short-term bearish shooting star.
- It is facing resistance from the daily moving averages.
- There is support at 2490 satoshis.
Ascending Support
A look at the hourly time-frame shows that XRP has been following an ascending support line since September 7.
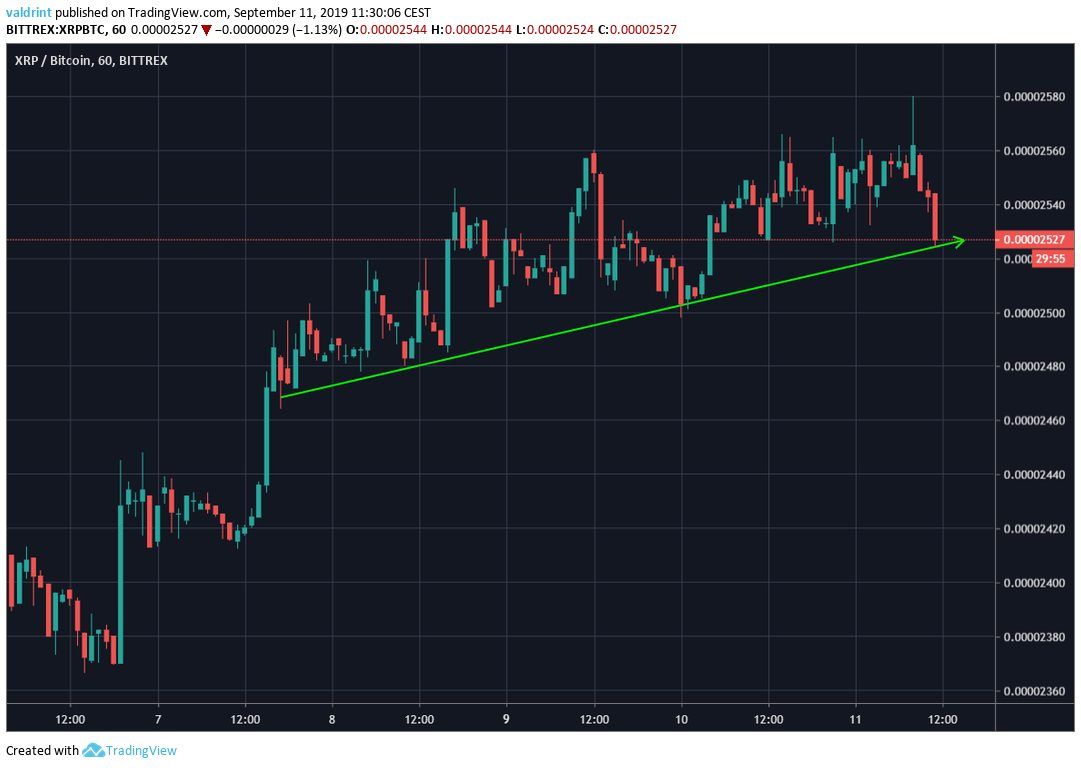
At the time of writing, the price was trading right on the support line.
XRP is not following any visible resistance lines.
Possible Reversal
Zooming out on the same chart, we can see that the price is currently inside a resistance area, which is found at 2580 satoshis.
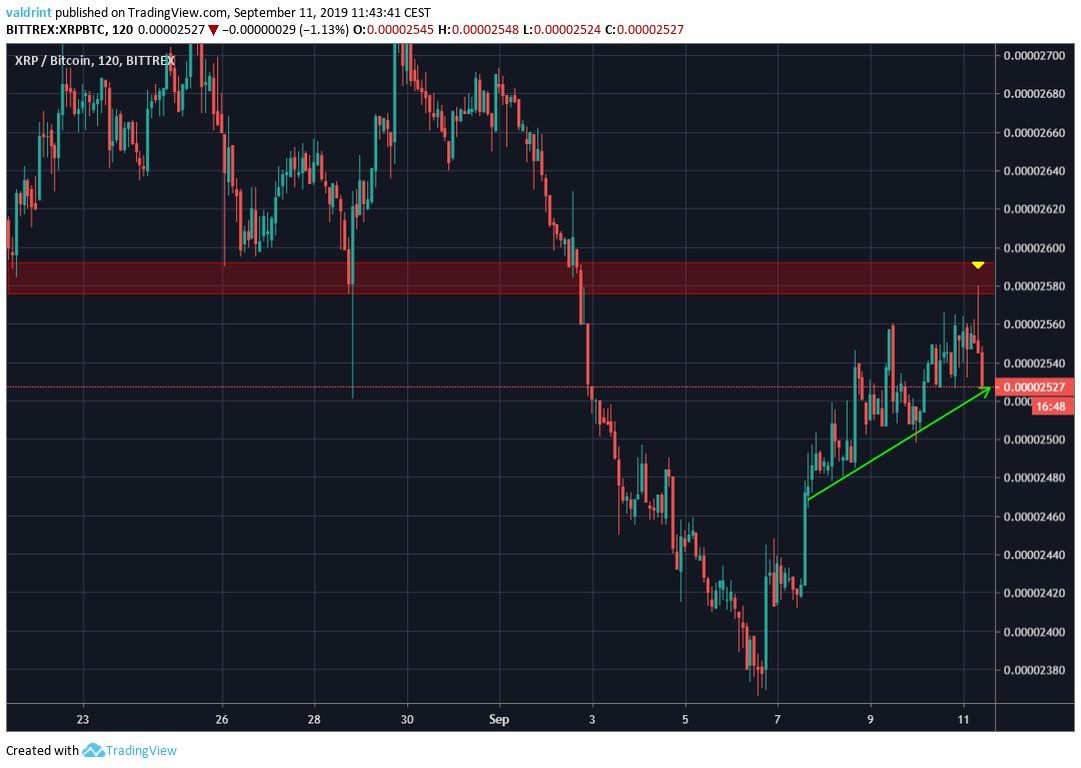
Additionally, the price has created a bearish shooting star, characterized by a long upper wick as soon as the price reached this area.
This increases the possibility that the price will break down below the support line.
Let’s take a look at some technical indicators to see if that is likely.
XRP Price Technical Indicators
A look at the RSI & MACD shows that both have been generating bearish divergence during the entire duration of the ascending support line.
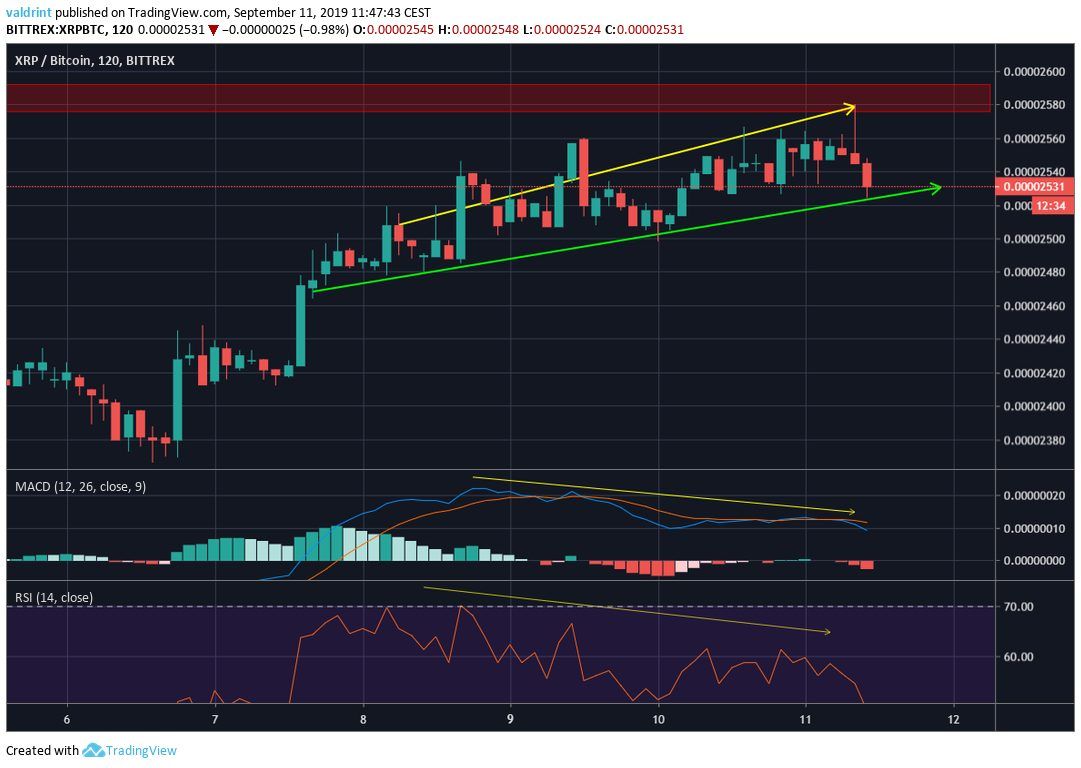
The divergence is significant. It gains more legitimacy by the fact that it is occurring inside a resistance area.
Additionally, the resistance area is further solidified once we incorporate daily moving averages (MA) into the analysis:
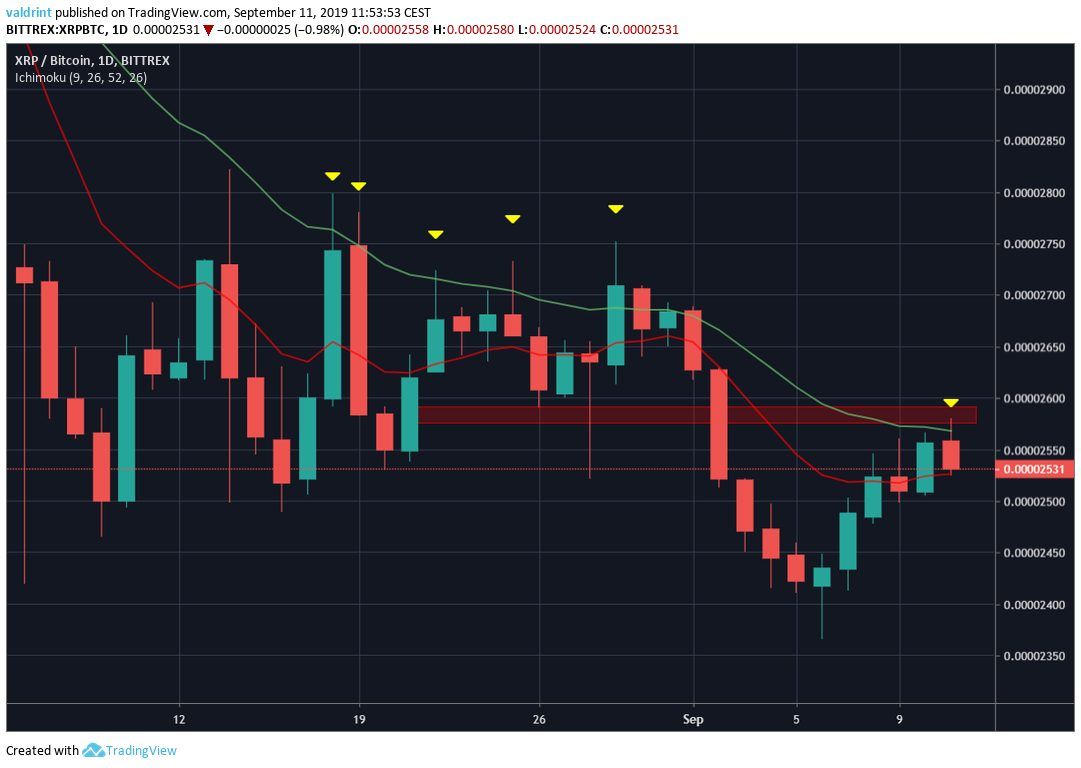
The price is currently facing resistance from the 20-day MA.
Previously, it has decreased every time it has reached it, initiating downward moves of different magnitudes.
Combined with the bearish divergence and previous price movement, this makes us believe that a breakdown is forthcoming.
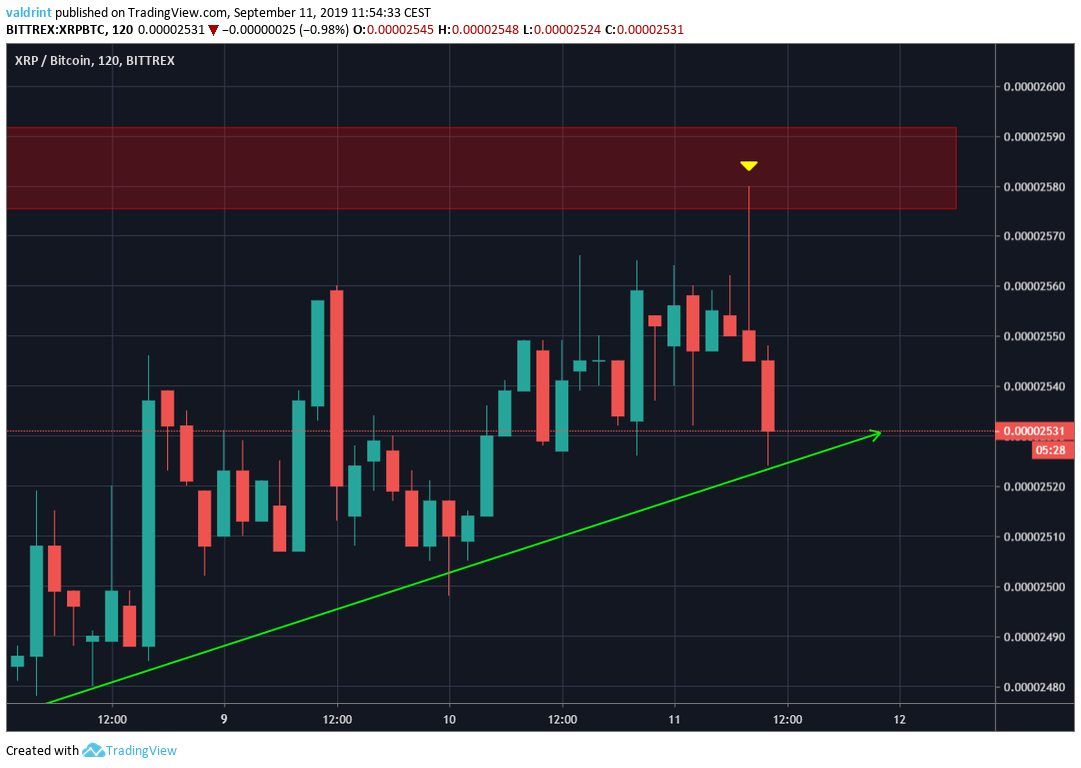
Future Movement
An outline of possible future price movement is given below:
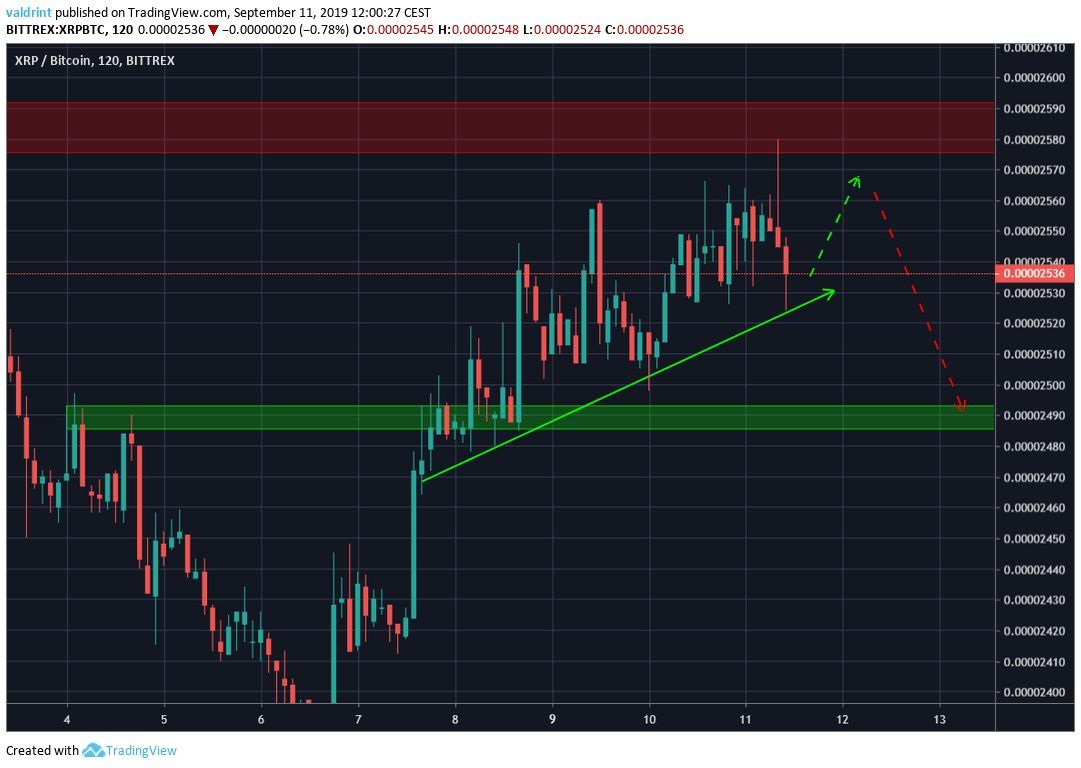
XRP is likely to eventually break down from the ascending support line and reach the support area outlined above.
The support area is found at 2490 satoshis.
XRP Price Summary
The XRP price is following an ascending support line.
According to our analysis, the price will break down and reach the support area outlined above.
For hypothetical trading purposes, we consider XRP a sell close to 2580 satoshis.
Do you think XRP will break down from the ascending support line? Let us know in the comments below.
Disclaimer: This article is not trading advice and should not be construed as such. It is for educational purposes only and represents the typical trades the author would make himself. Always consult a trained financial professional before investing in cryptocurrencies, as the market is particularly volatile.
Images are courtesy of Shutterstock, TradingView.
