
On September 14, 2019, the XRP price reached a high of 2575 satoshis. It traded around this level until September 17, when a rapid upward move began. XRP reached a high of 3205 satoshis the next day. It has been decreasing since.
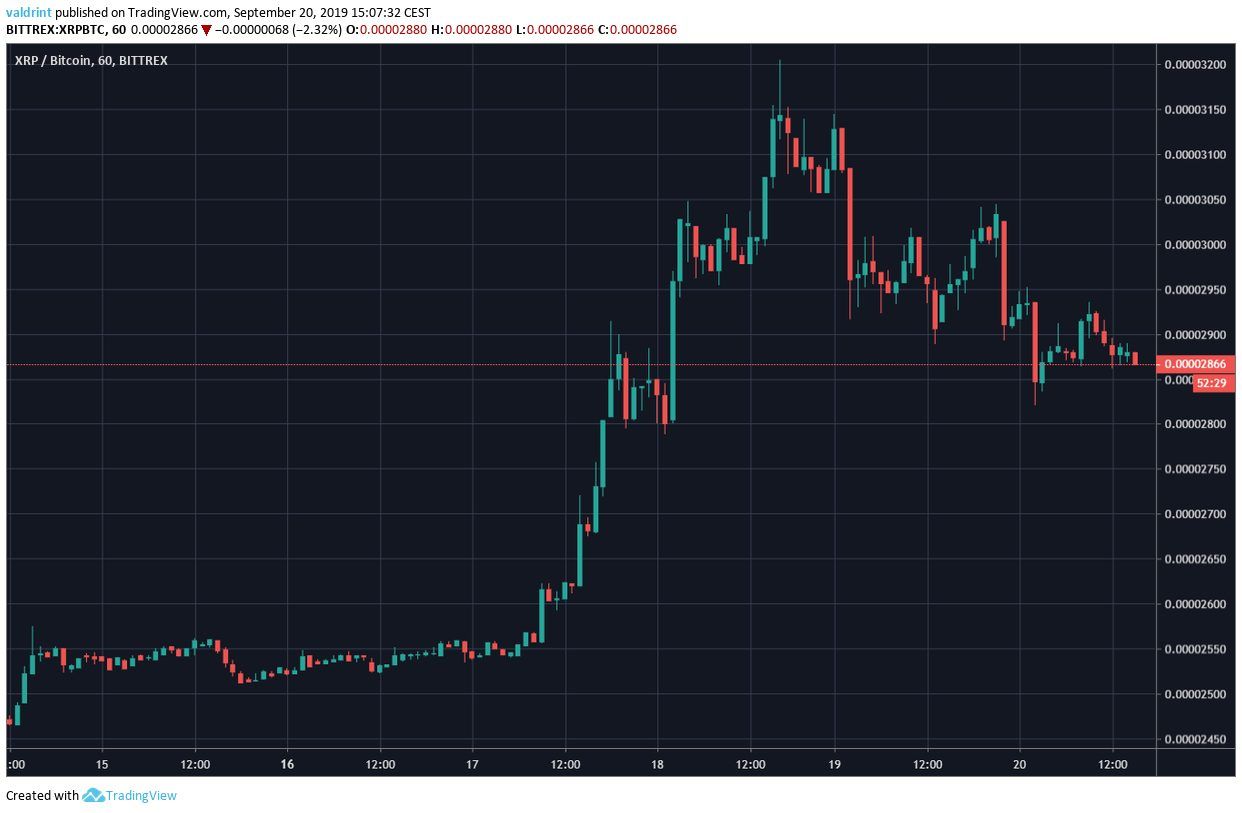
Will XRP continue to decrease or is there a reversal in store? Keep reading below in order to find out.
For our previous analysis, click here.
XRP Price: Trends and Highlights for September 20
- XRP/BTC is trading inside a descending wedge.
- The 10- and 20-day moving averages have made a bullish cross.
- One resistance area is found at 3350 satoshis.
- There is support at 2800 satoshis.
Descending Wedge
Looking closer at the hourly chart we can see that XRP has been trading inside a descending wedge since reaching the aforementioned high on September 18.
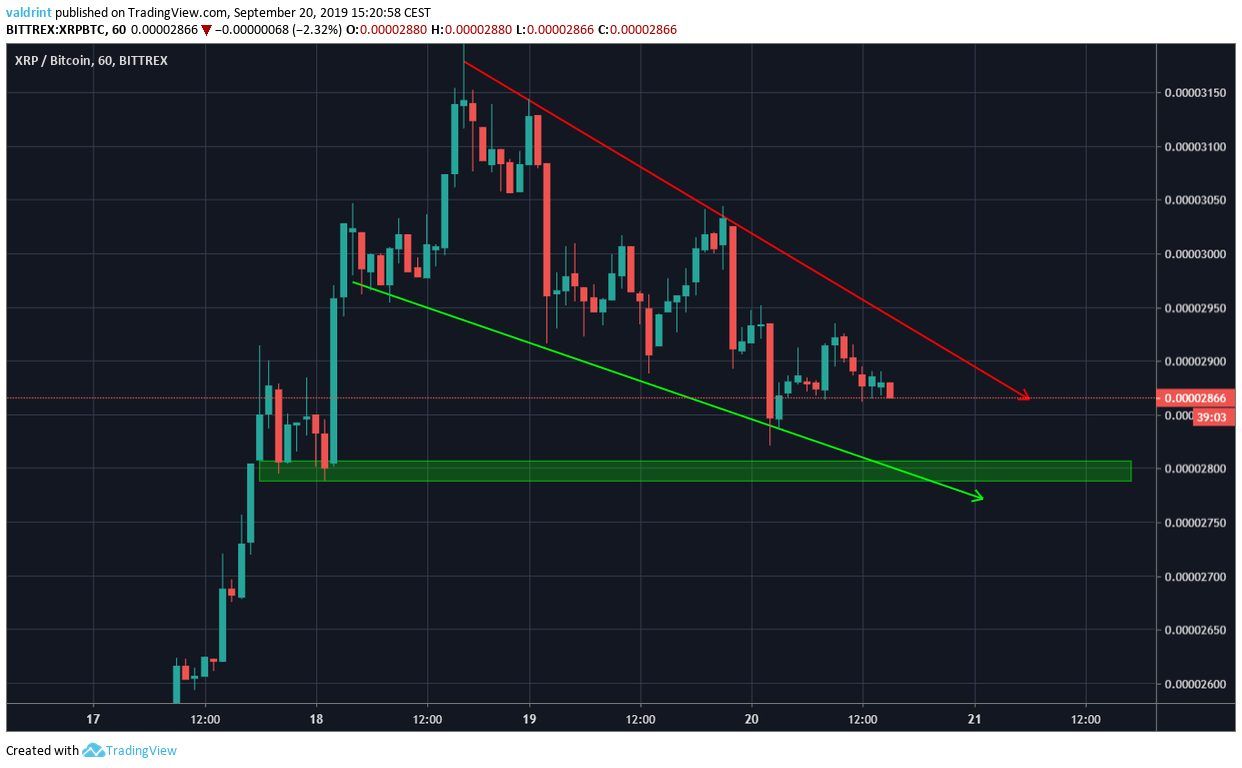
The descending wedge is considered a bullish pattern, making a price breakout more likely.
However, there is no bullish divergence in development yet.
Additionally, the price has not yet reached the support area at 2800 satoshis.
Therefore, we will take a look at a different time-frame in order to come to a conclusion on whether XRP will break out.
XRP Price Current Uptrend
Looking at the daily chart, we can see that the current upward move has been rapid, combined with very significant volume.
The price has created two bullish engulfing candlesticks in a row, before retracing slightly.
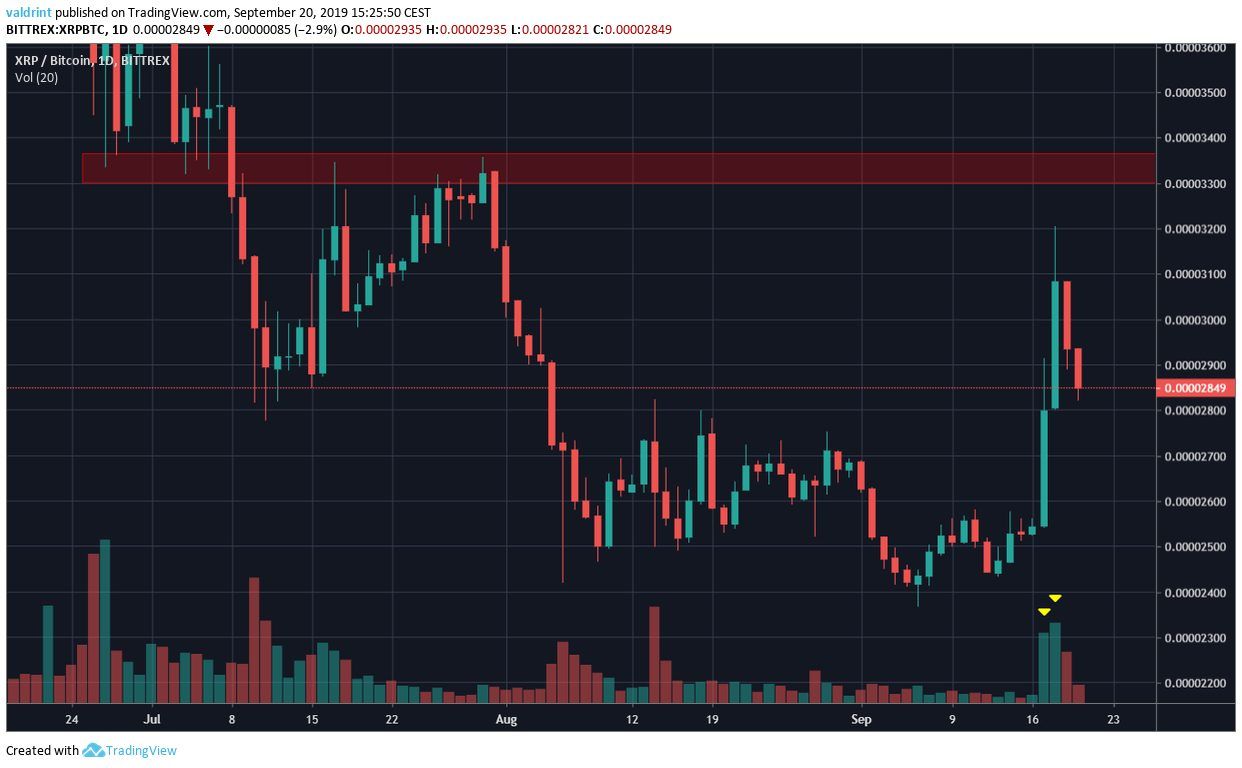
However, we can see that the closest resistance area is found at 3350 and the price has not yet reached it.
This could indicate that the price is not yet done increasing.
This view is supported by the daily moving averages (MA).
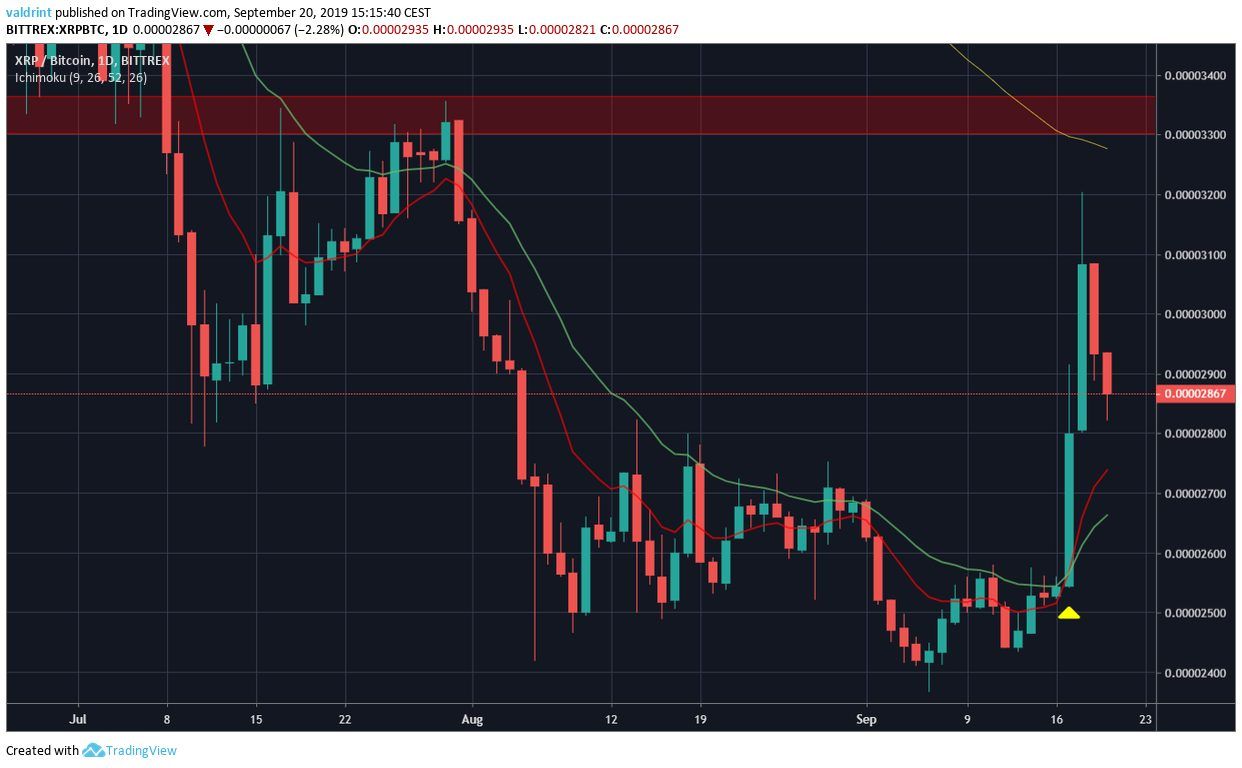
The 10- and 20-day moving averages have made a bullish cross on September 17.
Previously, XRP made two unsuccessful attempts at doing so on July 30 and August 30, before decreasing.
The current bullish cross indicates that an uptrend may have begun.
Additionally, we can see that the 100-day MA is slightly below the resistance area of 3350 satoshis.
This reiterates the fact that XRP has not yet reached a significant resistance level and may continue to increase.
Future Movement
An outline of possible future price movement is given below.
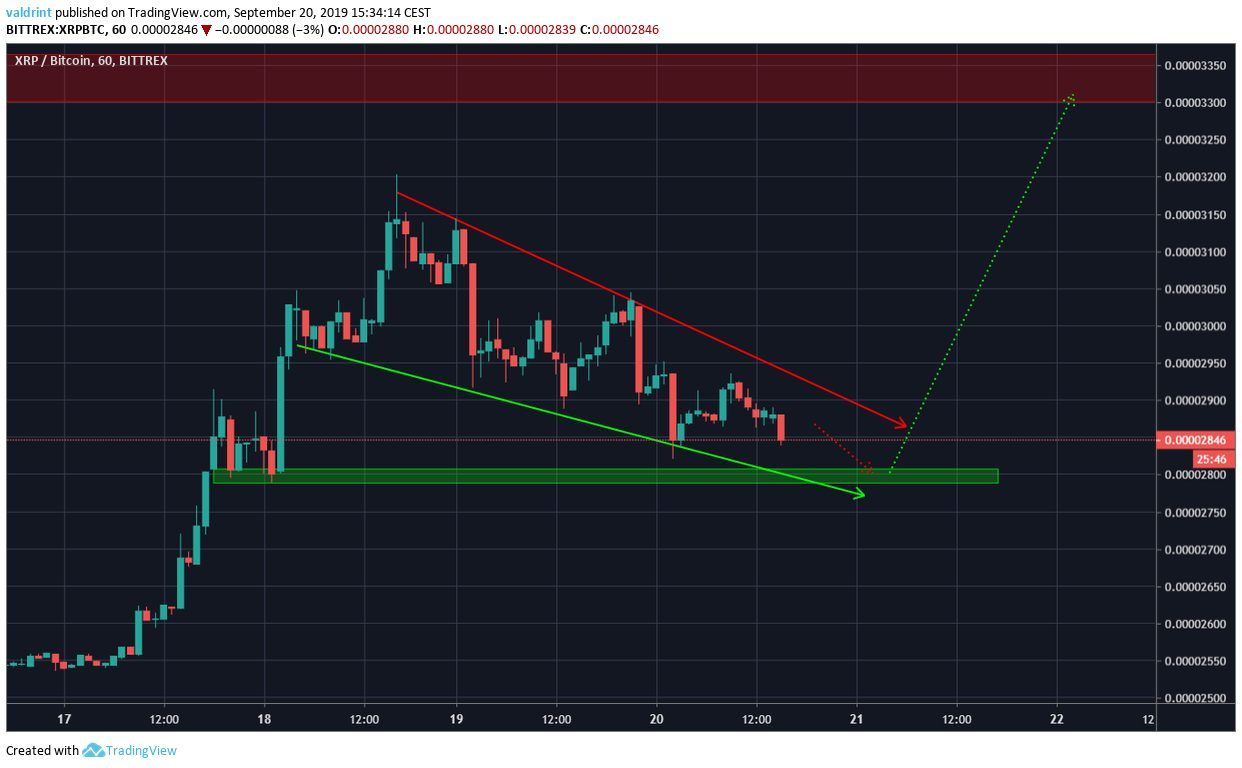
XRP is likely to continue trading inside the wedge until it reaches the support area.
Afterward, it should break out and reach the resistance area of 3350 satoshis.
XRP Price Summary
The XRP price is trading inside a descending wedge.
According to our analysis, it is likely to break out and reach the resistance area at 3350 satoshis.
For hypothetical trading purposes, we consider XRP a buy near 2800 satoshis.
Do you think XRP will break out from the descending wedge? Let us know in the comments below.
Disclaimer: This article is not trading advice and should not be construed as such. Always consult a trained financial professional before investing in cryptocurrencies, as the market is particularly volatile.
Images are courtesy of Shutterstock, TradingView
