
On July 11, 2019, the XRP price reached a low of 2777 satoshis. A gradual increase ensued. On July 17, it reached a high of 3345 satoshis. Since then, it has been trading inside a range between 3000 and 3150 satoshis.
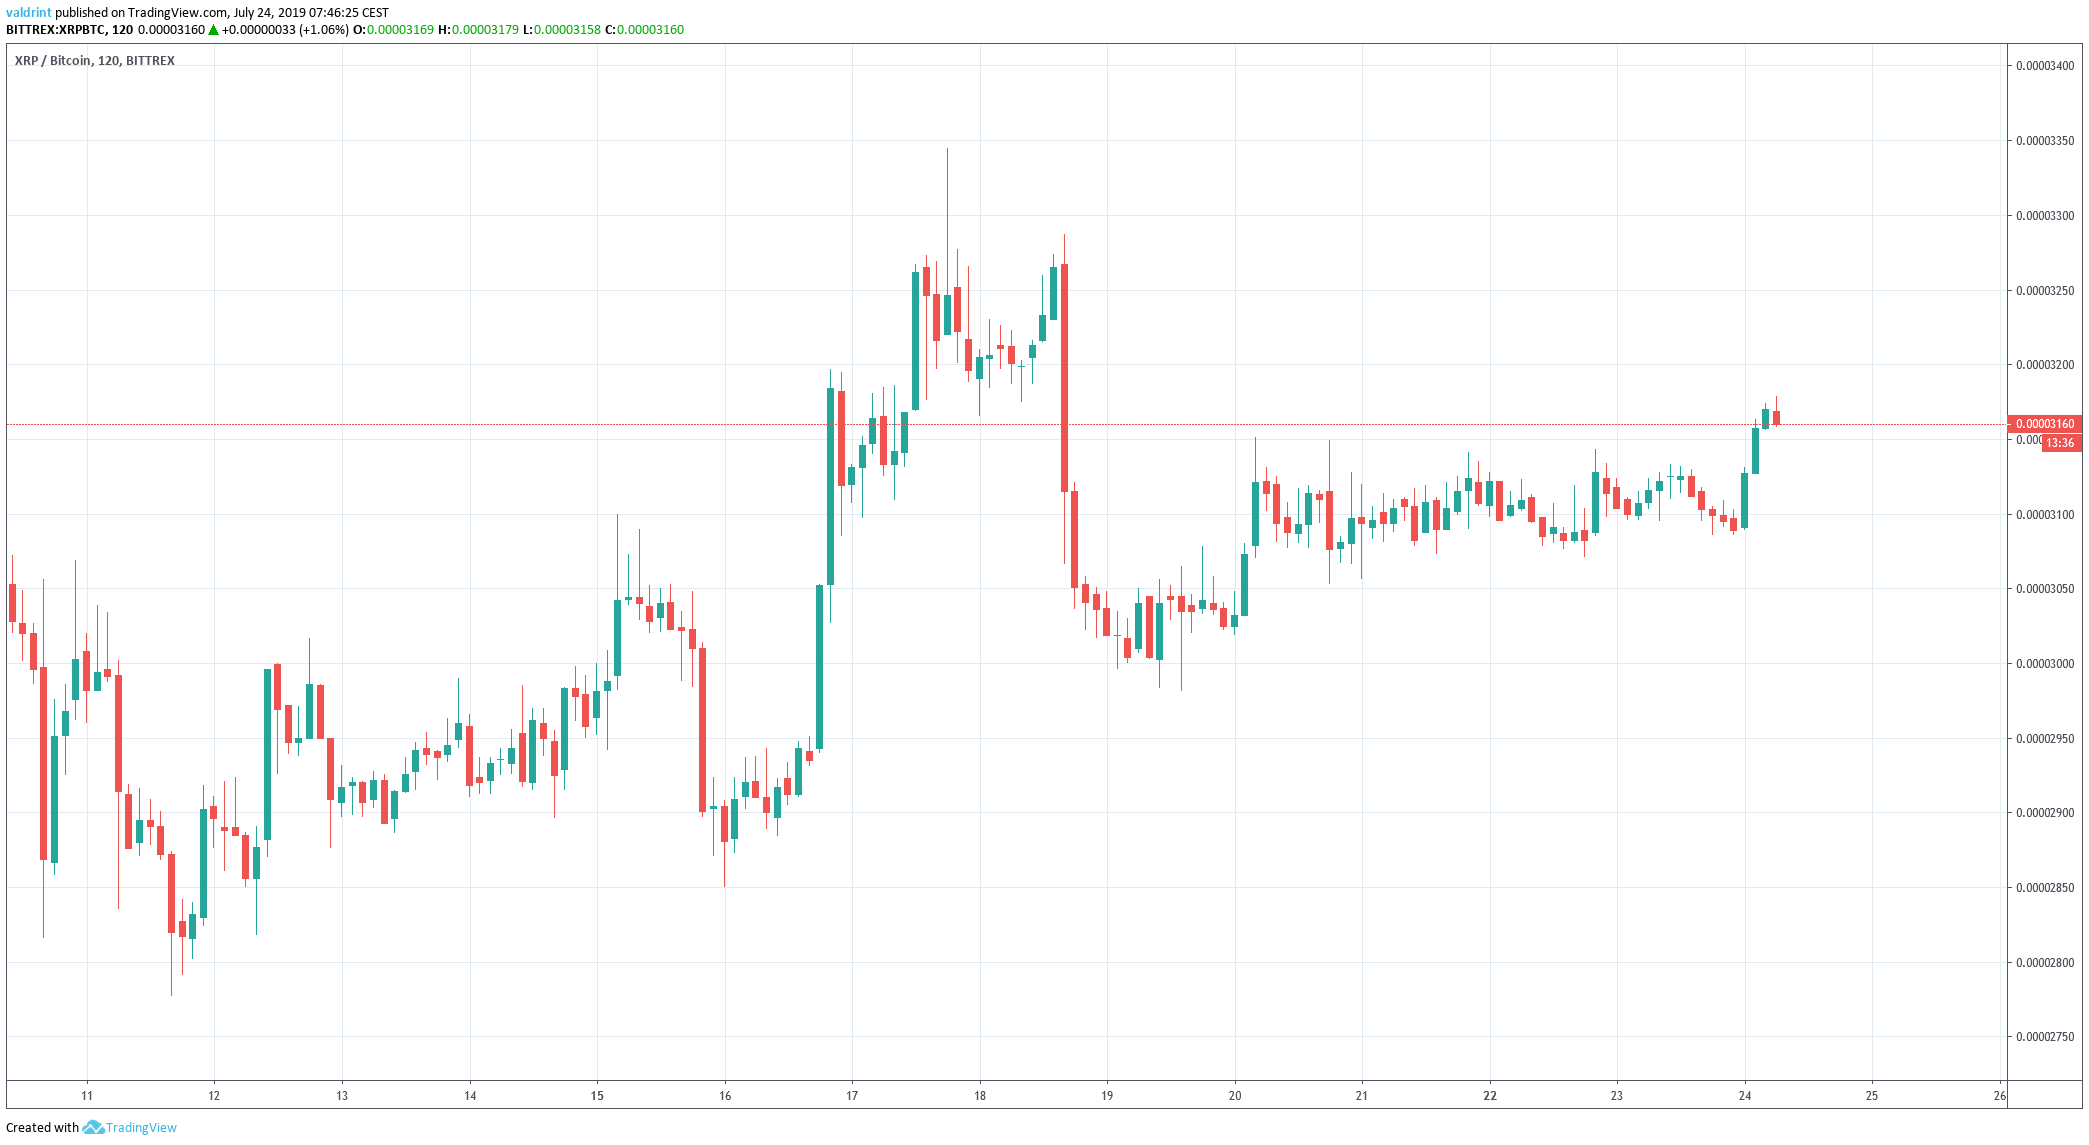
Will XRP break out of its trading range? In order to answer, we are going to analyze the XRP price in different time-frames alongside technical indicators.
For our previous analysis click here.
If you are interested in trading XRP (XRP) with a multiplier of up to 100x on our new partner exchange with the lowest fees, follow this link to get a free StormGain account!
XRP Price: Trends and Highlights for July 24
- XRP/BTC is possibly trading inside an ascending triangle.
- There is support at 2650 satoshis.
- A significant bullish divergence has developed in the RSI & MACD.
- Daily moving averages are close to making a bullish cross.
- There is resistance at 4000 satoshis.
Ascending XRP Price Support
Since reaching the aforementioned low on July 11, the XRP price has been following the ascending support line outlined below:
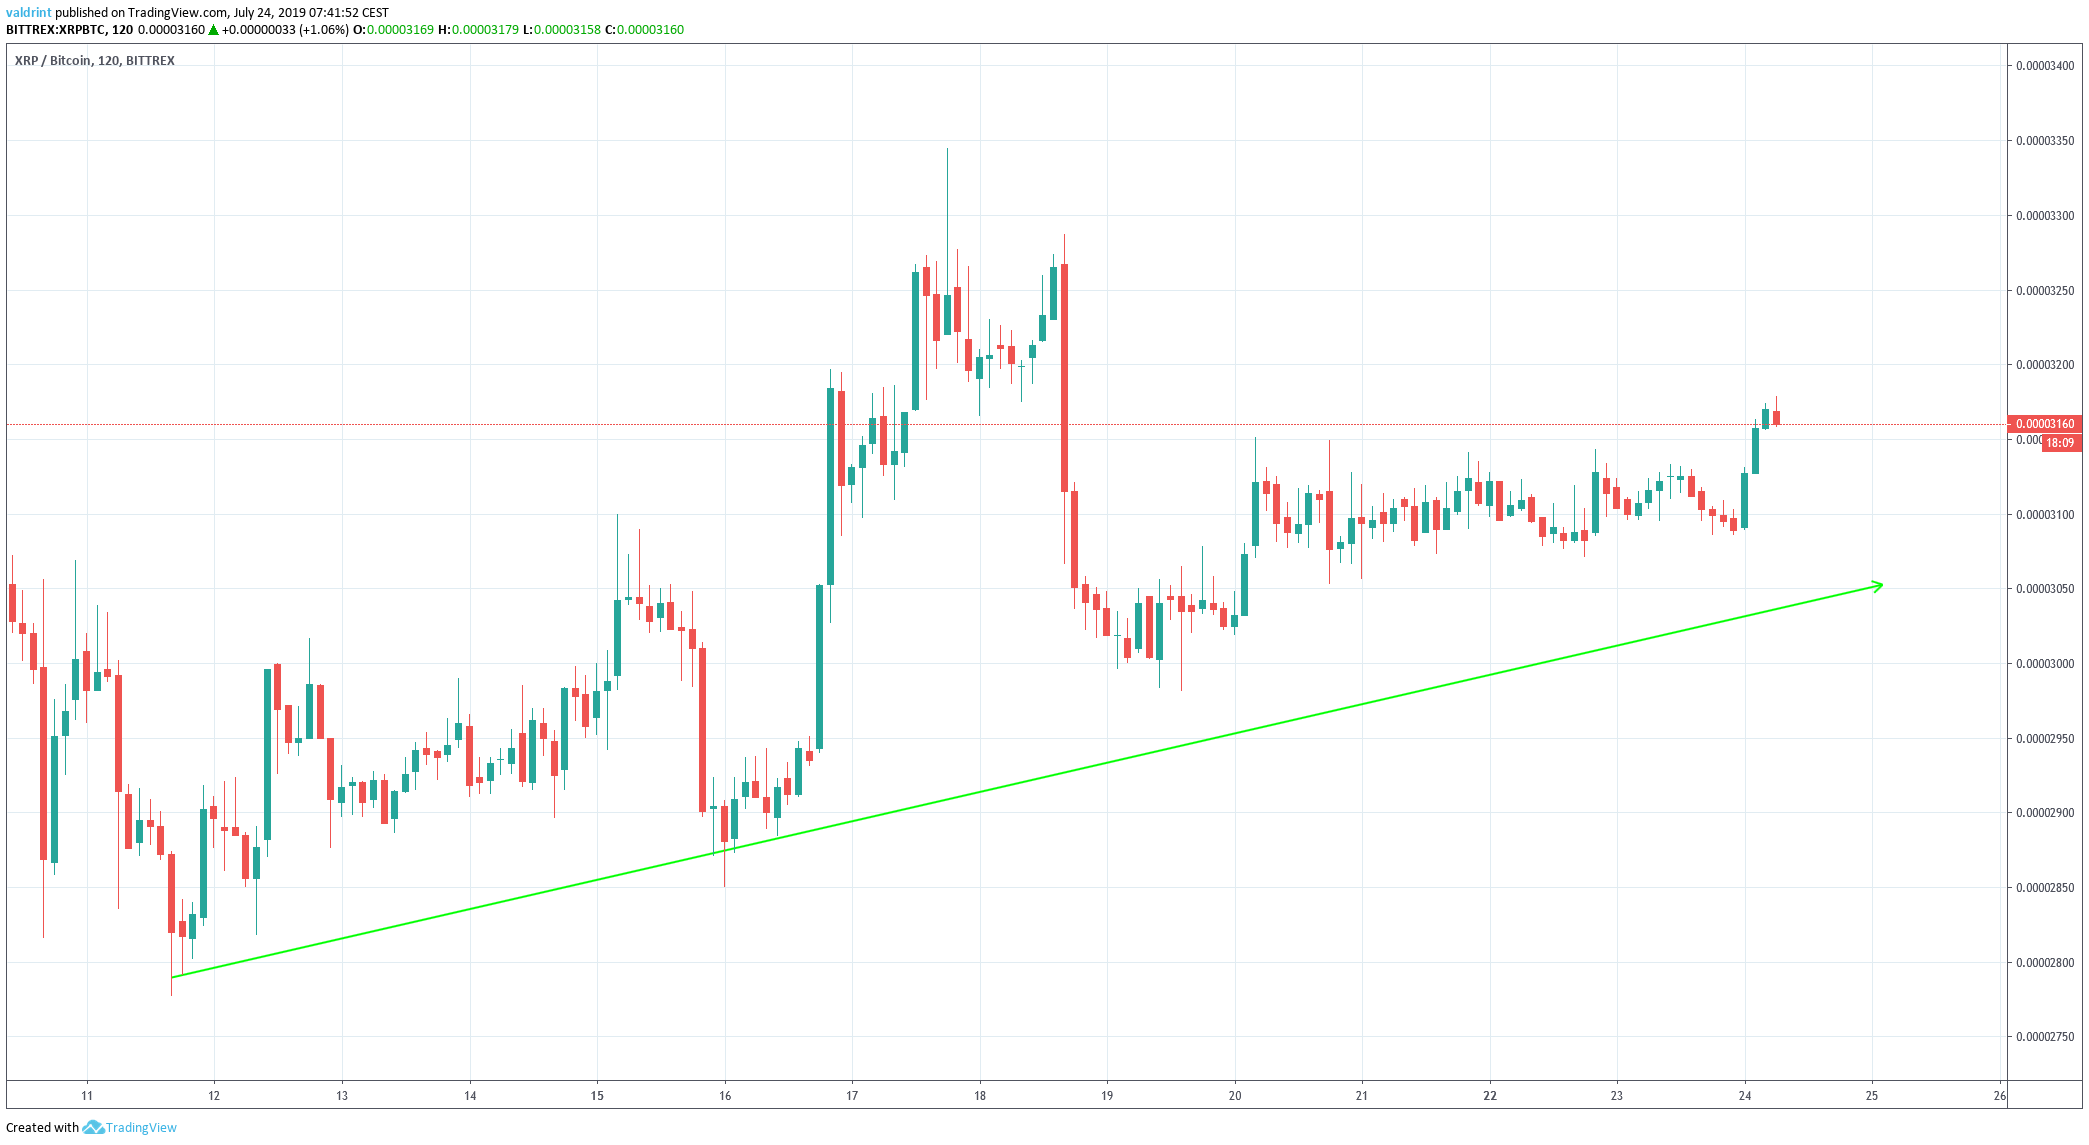
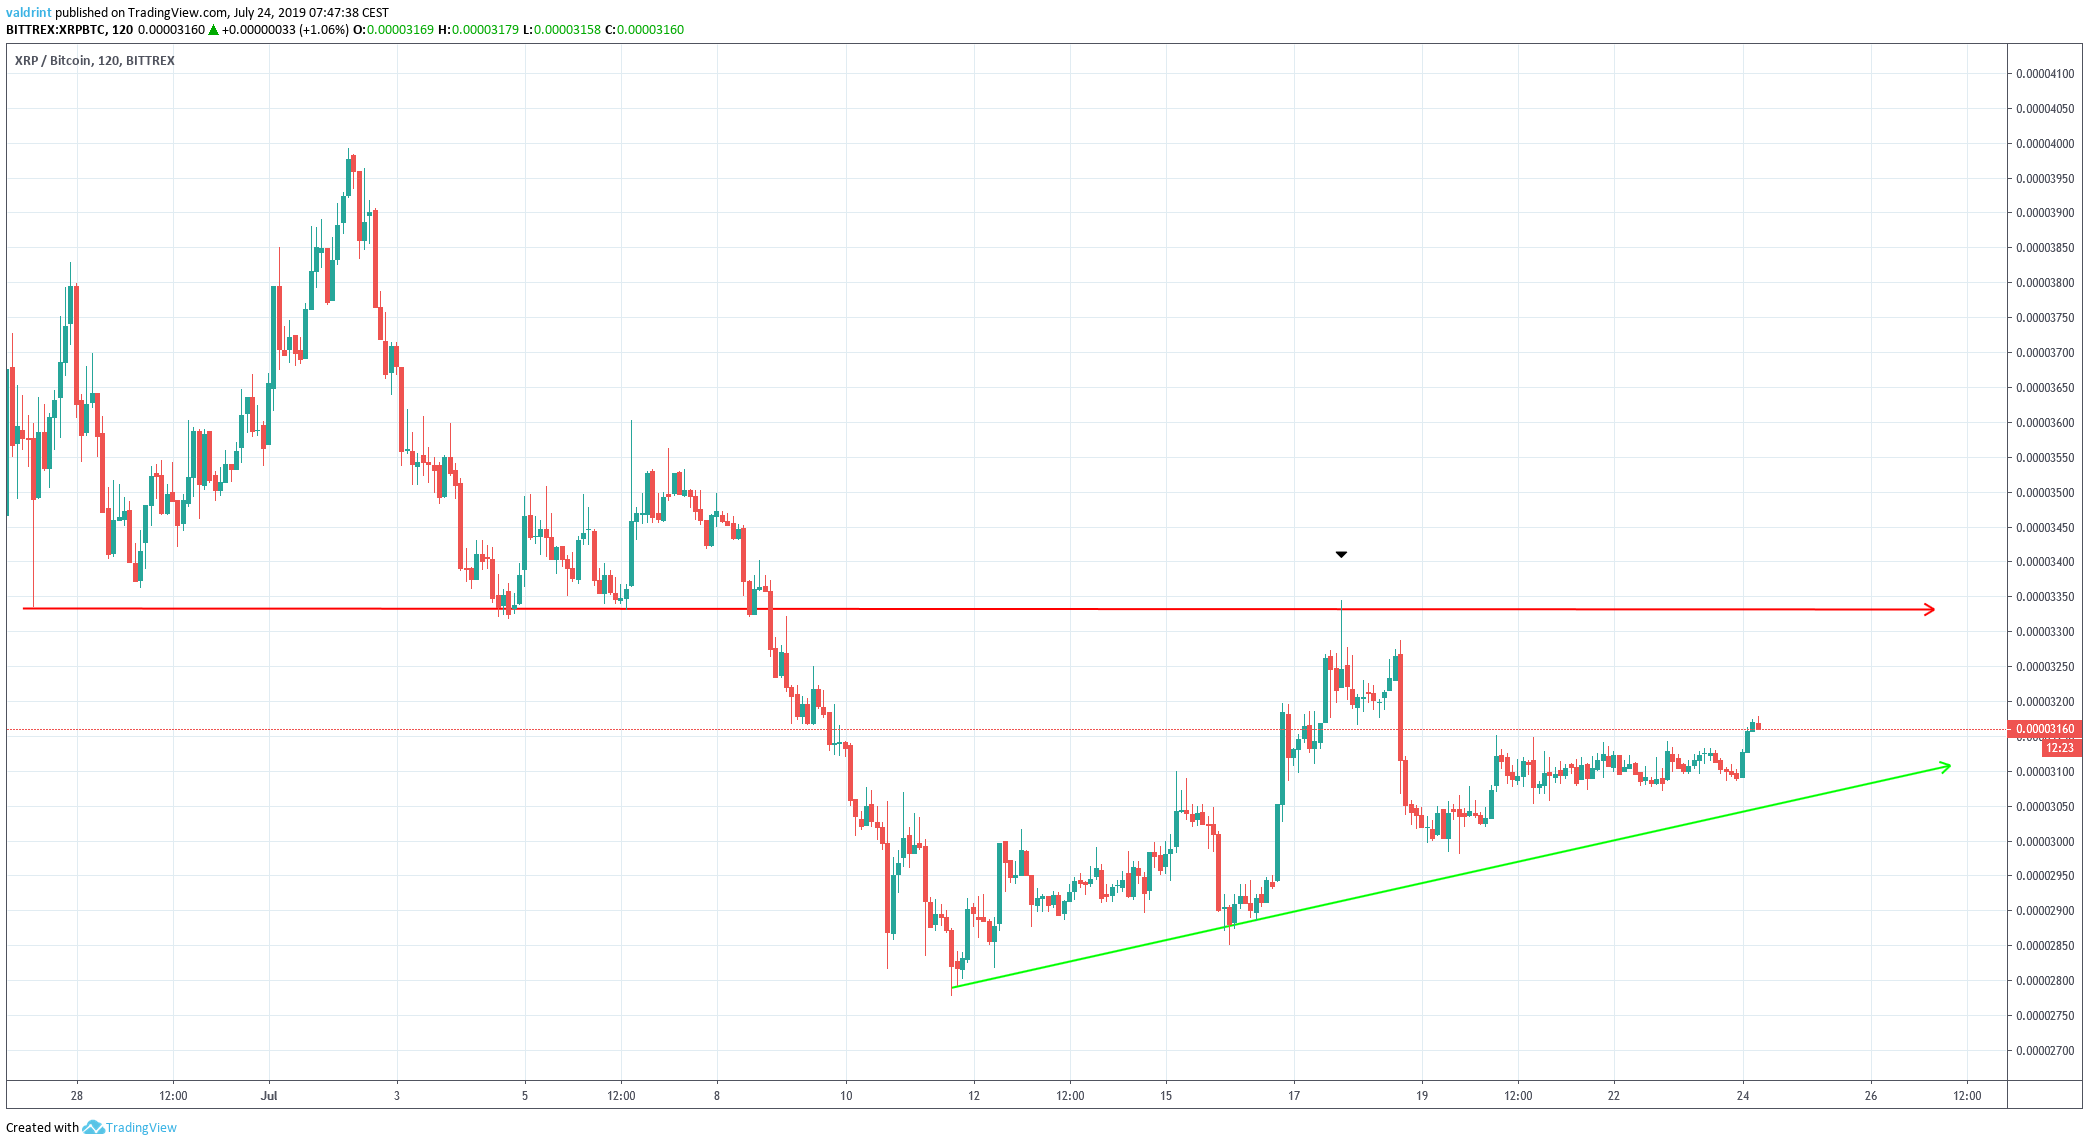
While it is not clearly following any resistance lines, it is possible that it is trading inside an ascending triangle.
The resistance line previously served as support in the period from June 27-July 7 before the XRP price broke down from it.
When the price touched it on July 17, it immediately reversed and created a long upper wick.
The ascending triangle is considered a bullish pattern, making a potential breakout more likely.
Long-Term XRP Price Support
A longer-term view shows that the ascending triangle originated inside a support area.
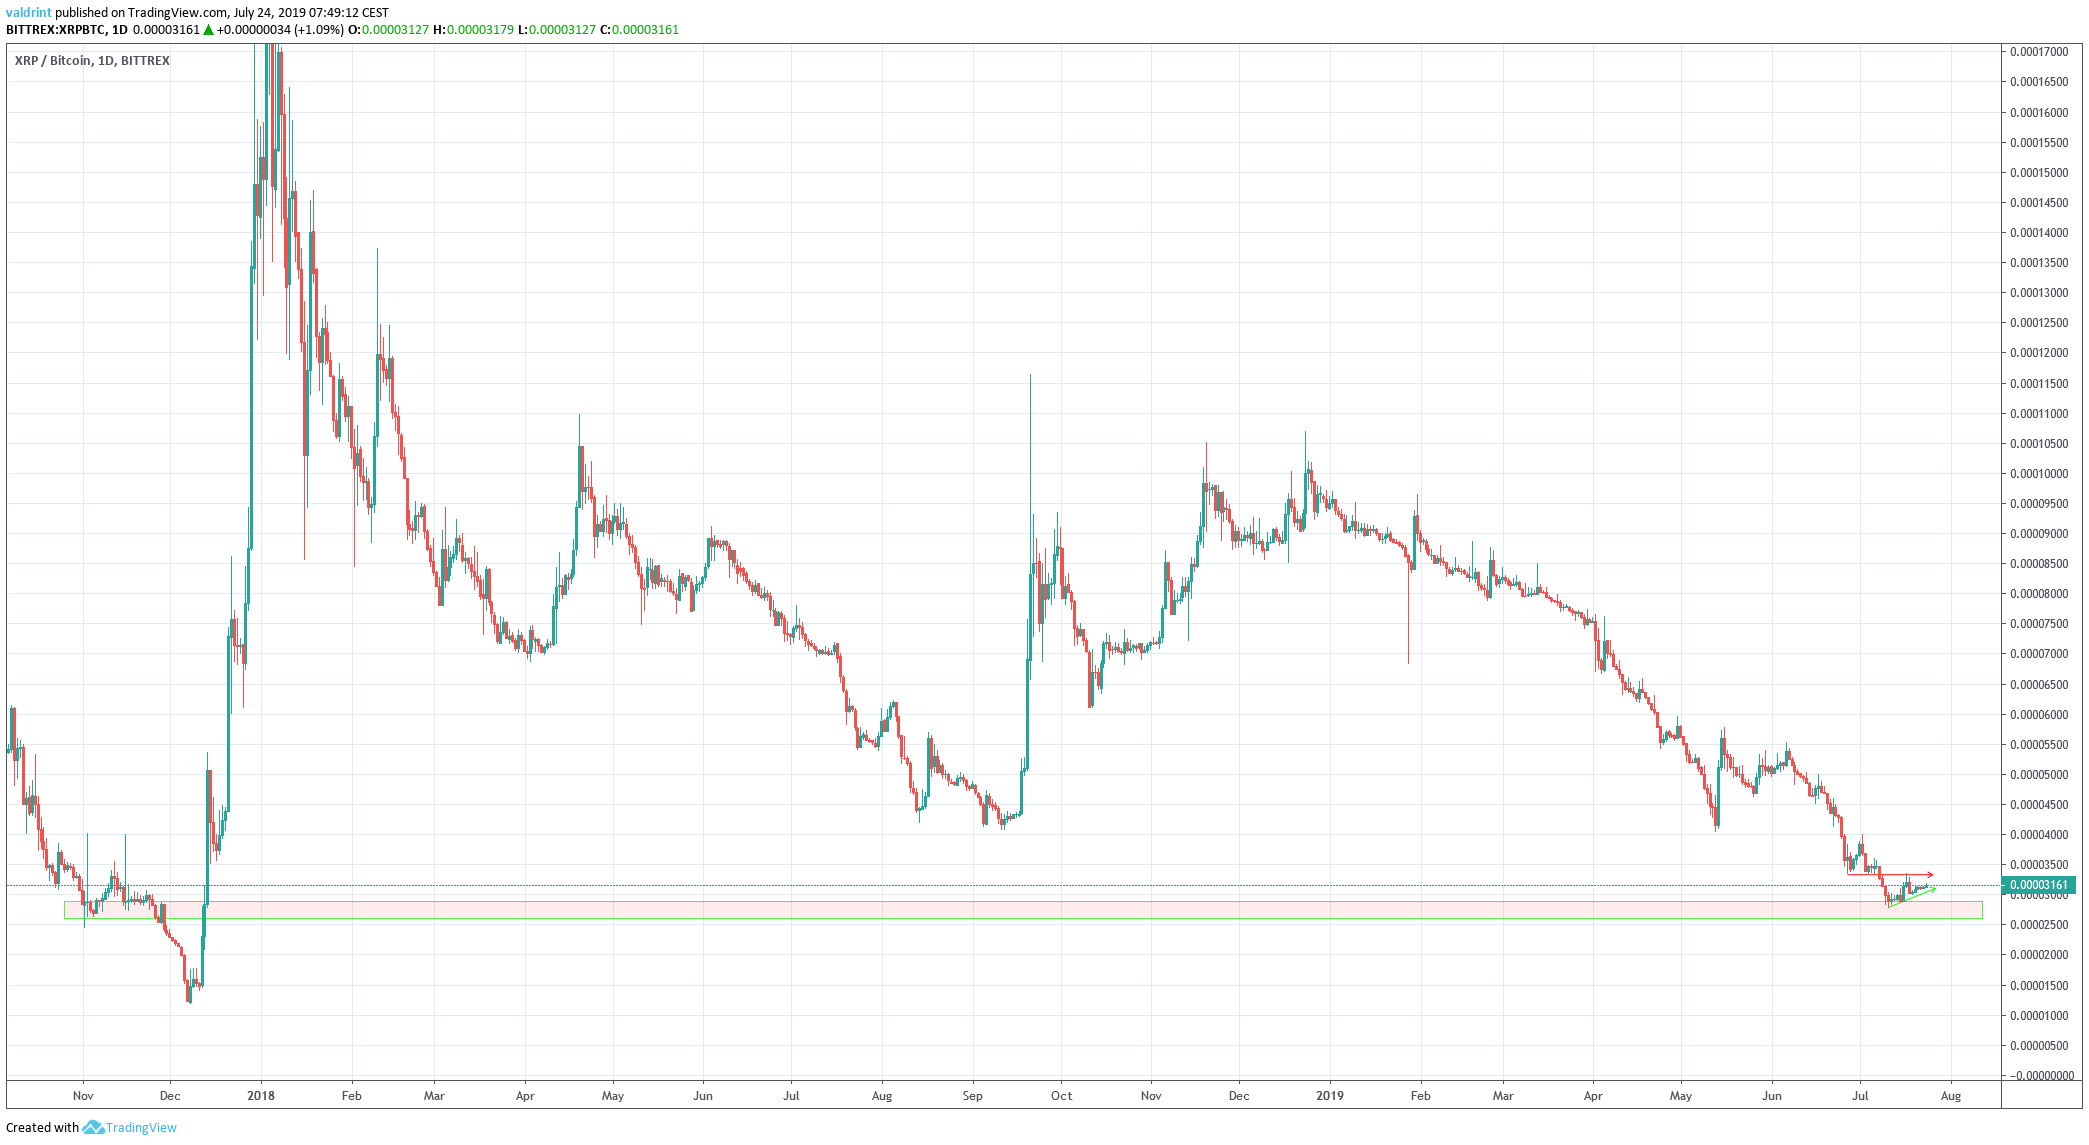
The support area is found near 2650 satoshis.
A breakdown below this area could trigger a rapid price decrease towards 1300 satoshis, levels at which the 2017 bull run began.
Technical Indicators
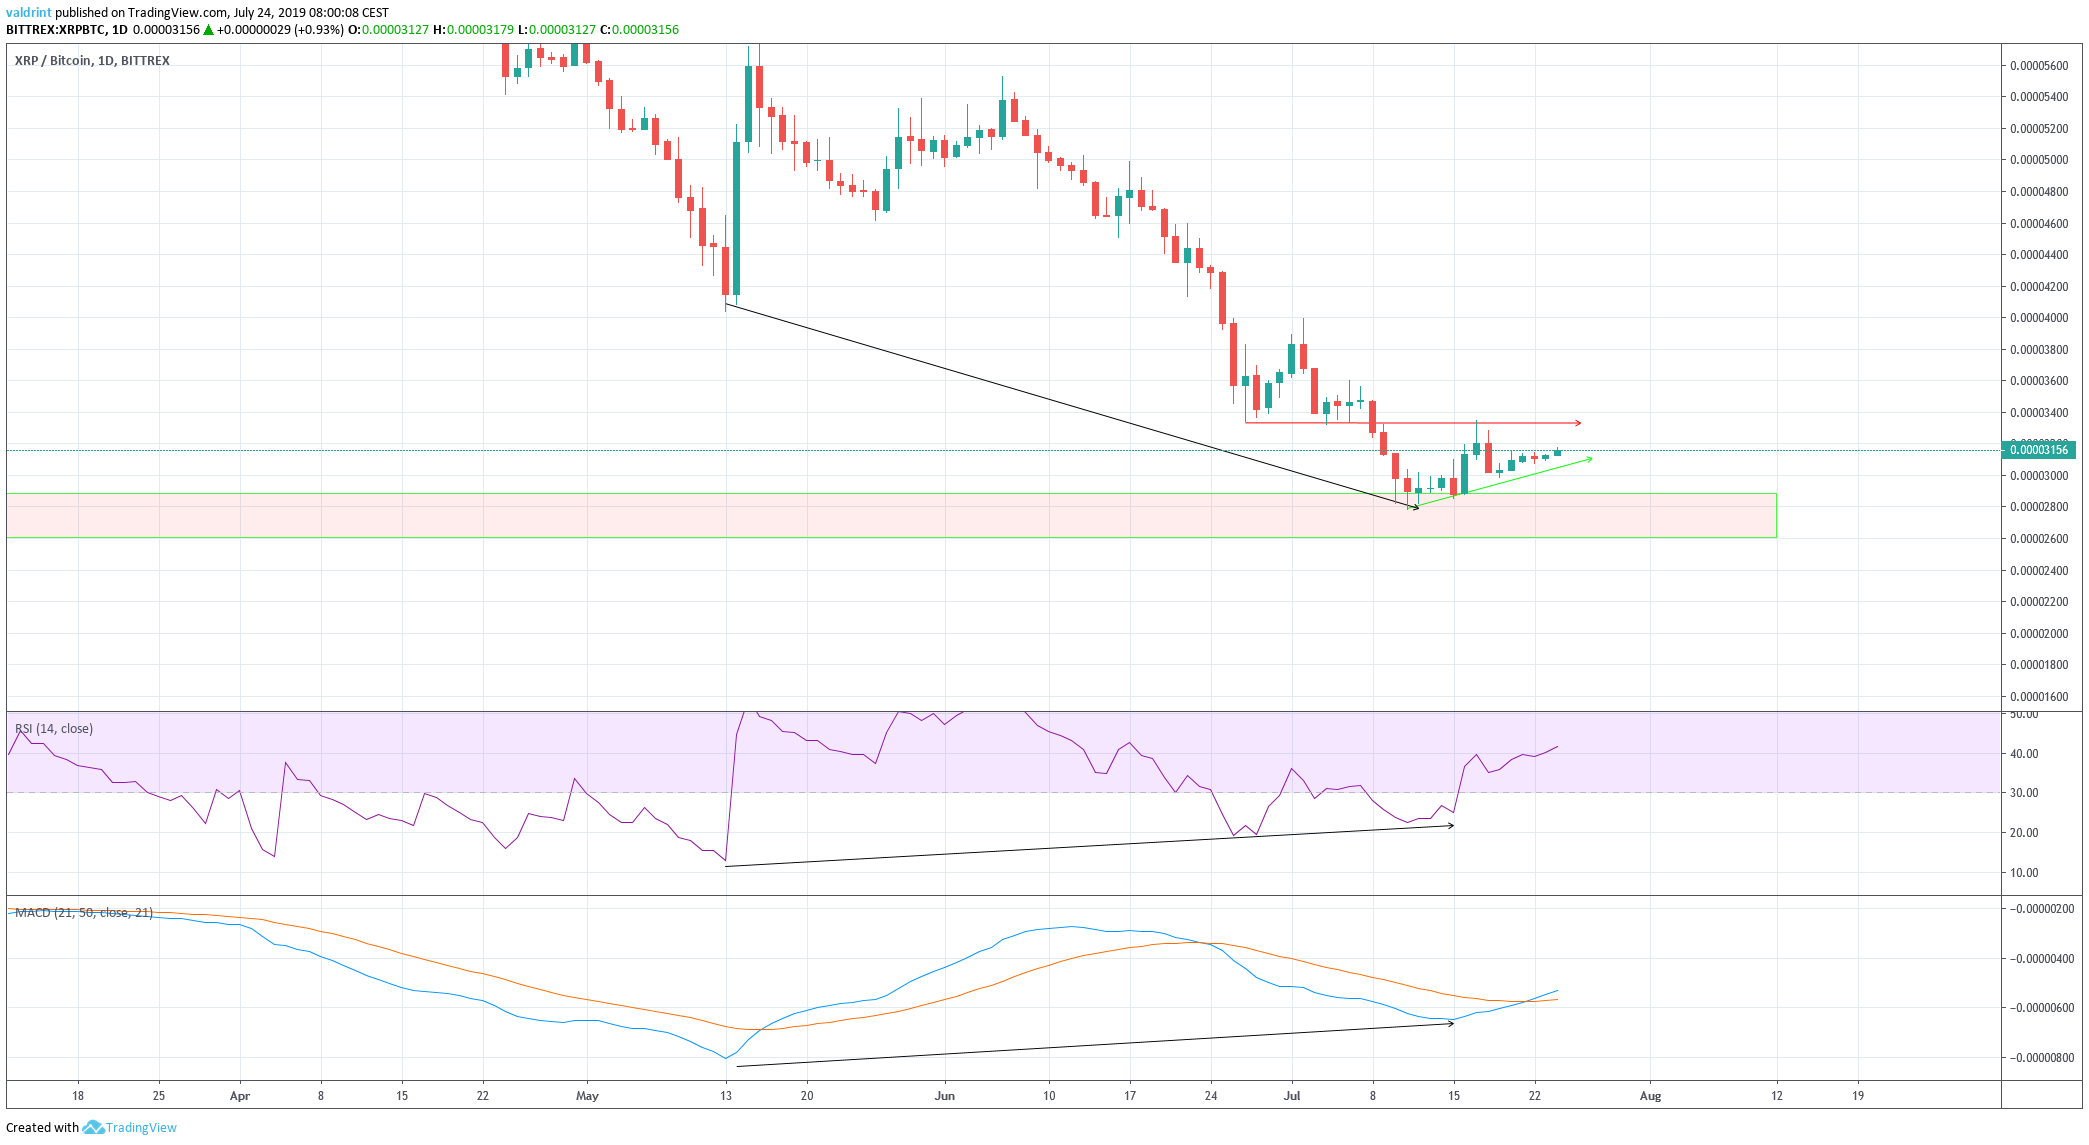
Both the RSI and the MACD have been generating very significant bullish divergence since May 13.
In the RSI, this divergence is especially pronounced in July.
Additionally, the XRP price has moved above both the 10- and 20-day moving averages.
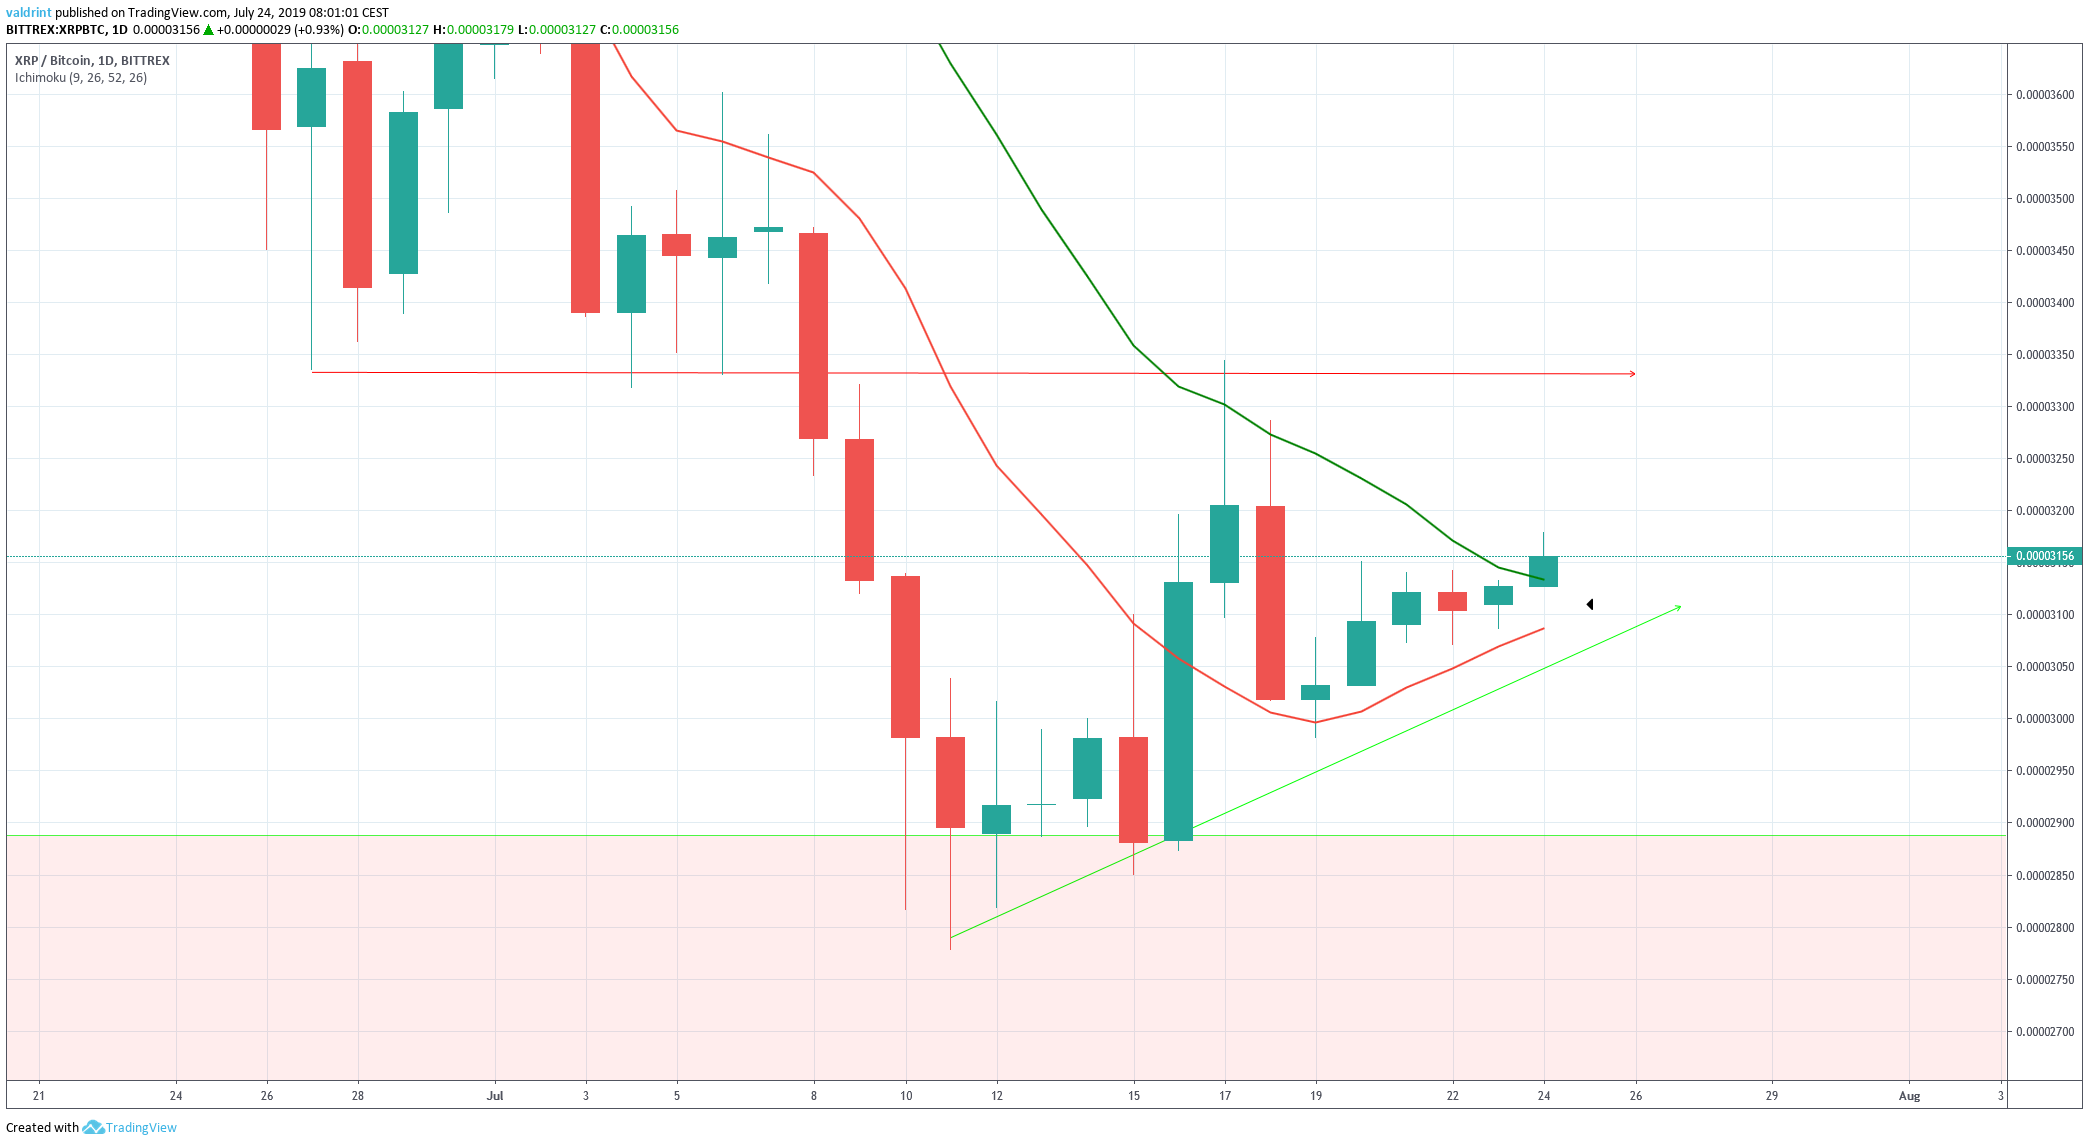
Furthermore, they are very close to making a bullish cross.
If that occurs, it can be considered a confirmation that an uptrend has begun.
According to these indicators, it is likely that the XRP price will break out of the triangle.
Resistance Areas
In case the price breaks out, one resistance area is outlined below:
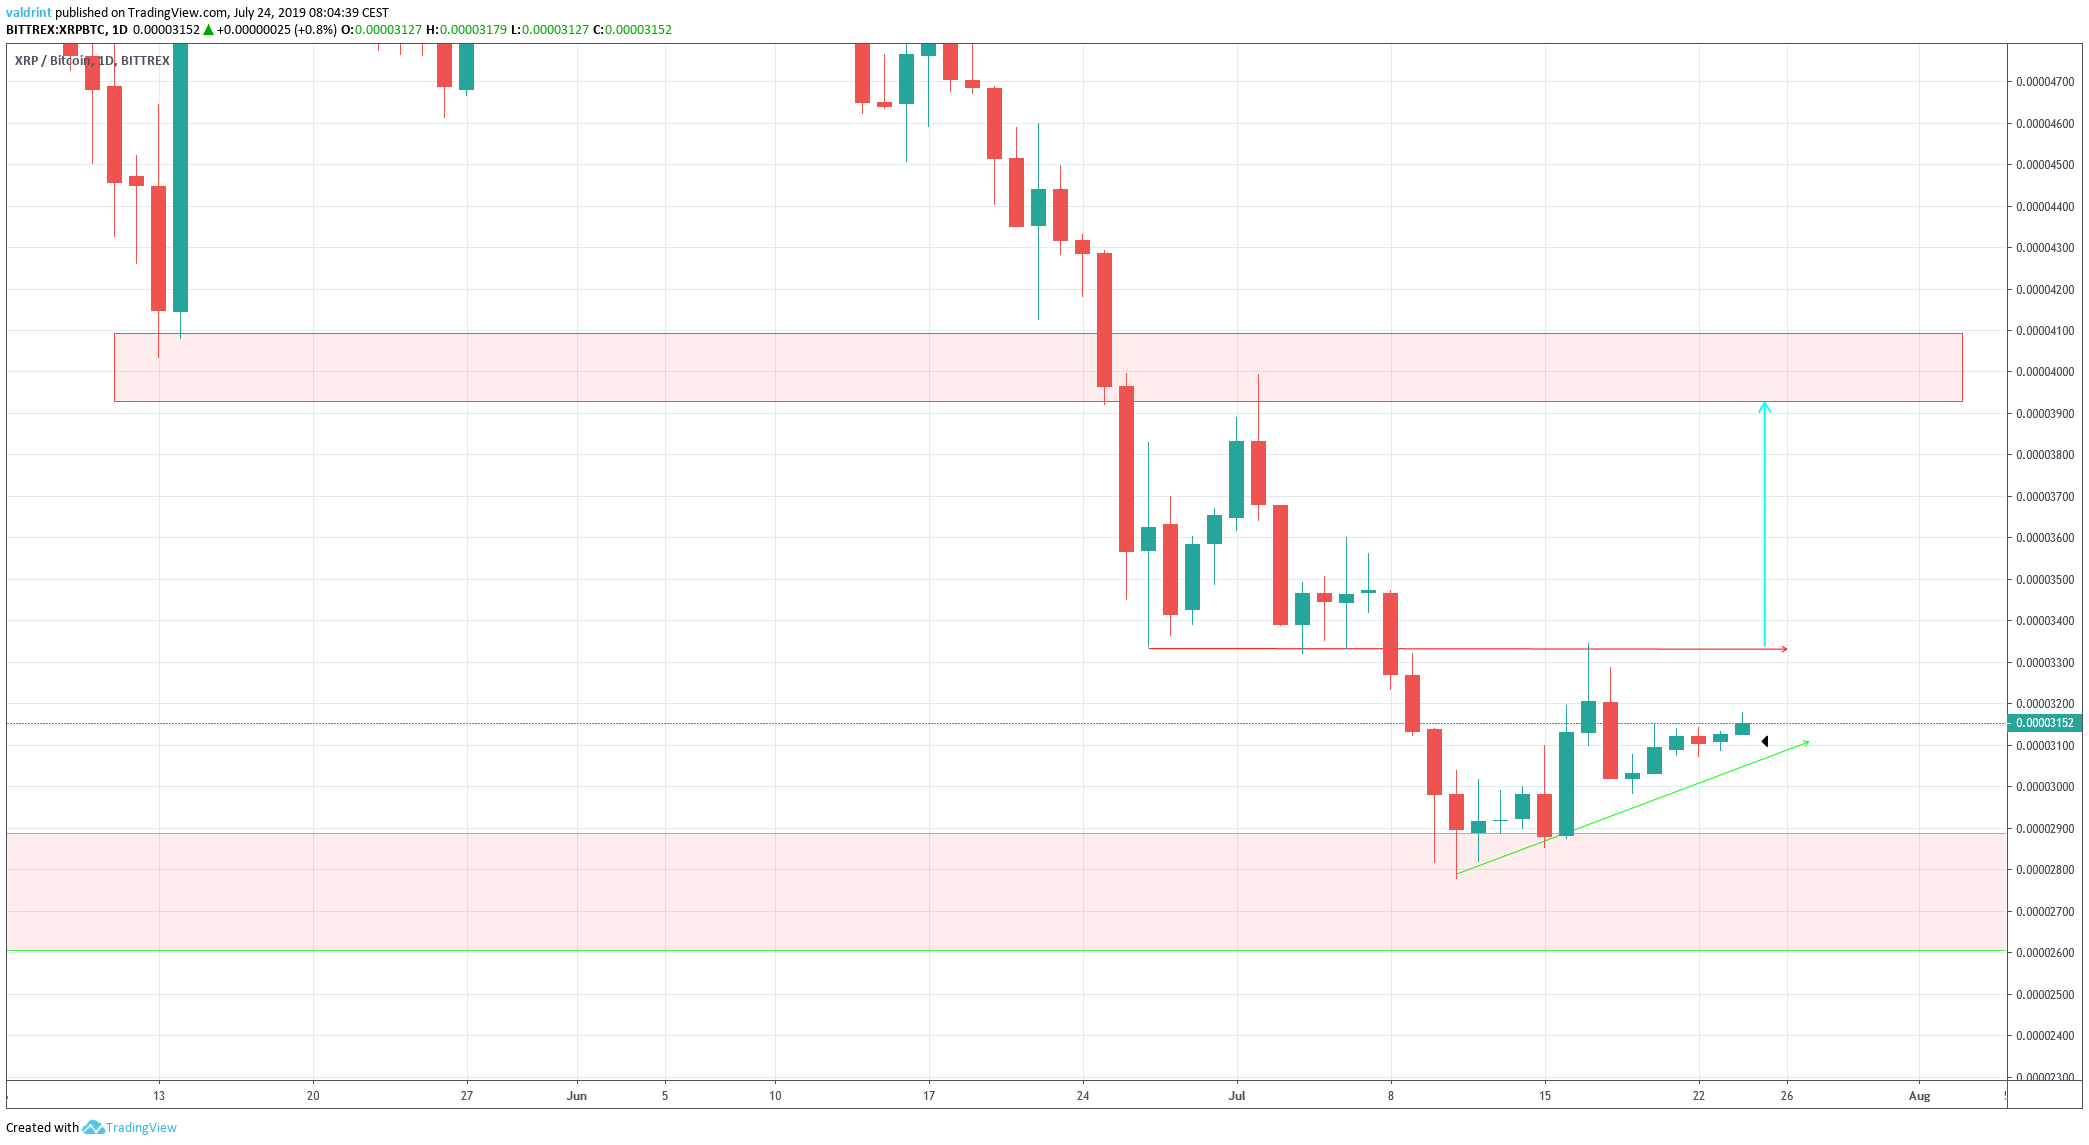
The resistance area is found at 4000 satoshis.
A similar target is given by projecting the height of the triangle to the breakout point.
Summary
The XRP price is trading inside an ascending triangle.
According to our analysis, it is likely to break out from the triangle and reach the resistance area outlined above.
Do you think XRP will break out from the triangle? Let us know in the comments below.
