
In September 2018, the XRP price made a low of 4100 satoshis. A rapid upward move ensued, and the price made highs above 11500 satoshis during the same month. The price has been on a downtrend since. Lows of nearly 4000 satoshis were reached in May, 2019. The price dropped below this level on June 26.
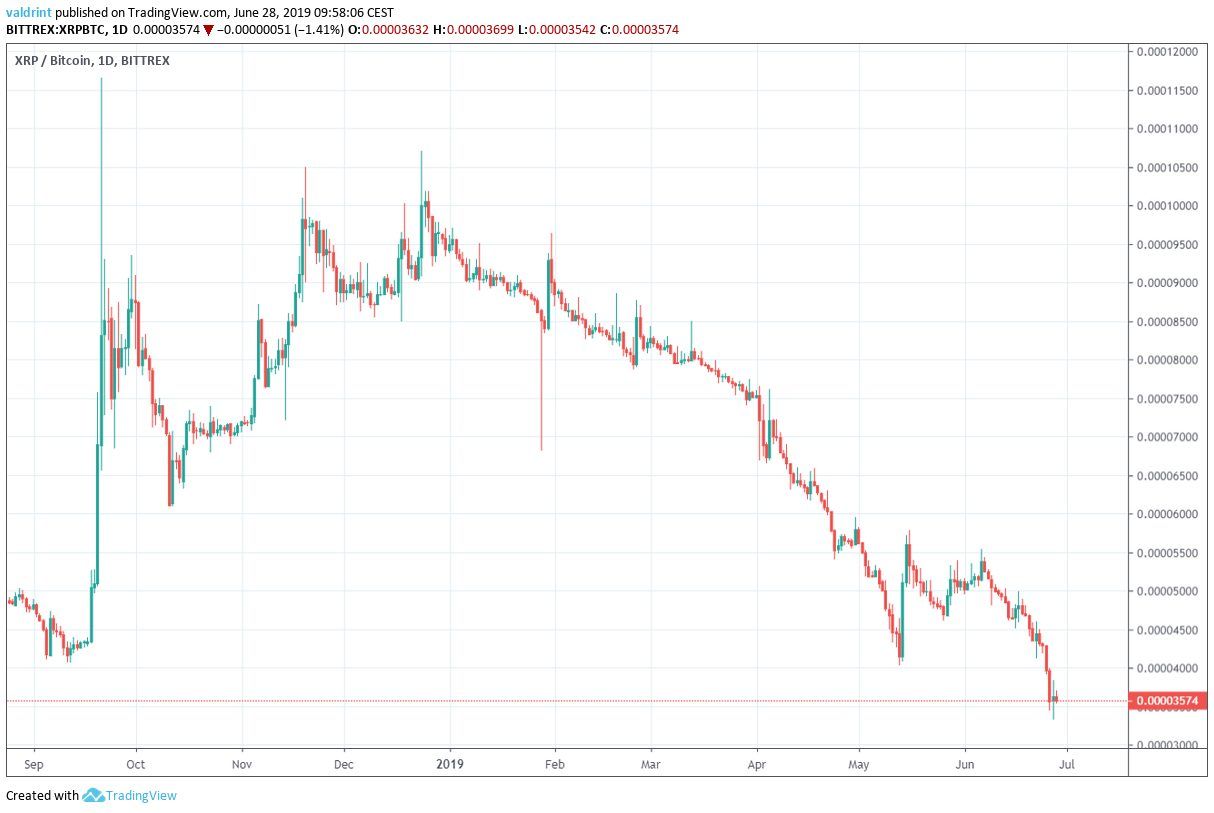
Where will the XRP price find support? Below we will analyze the price of XRP in different time-frames alongside technical indicators in order to answer this question.
XRP Price: Trends and Highlights for June 28
- The XRP price recently broke down below a significant support area.
- It has been trading inside a descending channel.
- There is bullish divergence developing in the RSI and the MACD.
- The daily and weekly moving averages are providing resistance.
XRP Price in a Descending Channel
Since reaching highs of 6000 satoshis on Apr 30, the XRP price has been gradually decreasing — creating the descending channel outlined below.
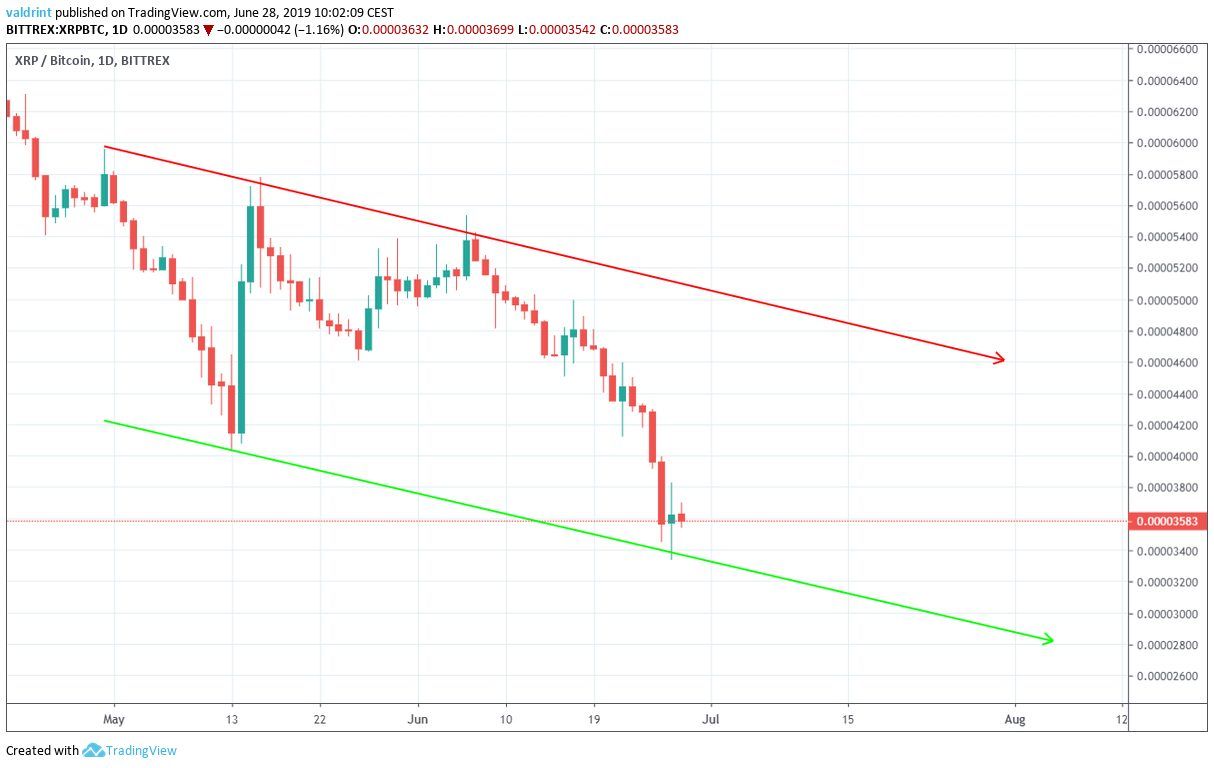
The support line has only been touched twice, therefore it is possible that the XRP price follows a different line — possibly creating a descending wedge. However, in order to outline it, we drew a line parallel to the resistance line, which is often how prices trade inside descending/ascending channels.
At the time of writing, the price was trading very close to the support line. Will it provide enough support to initiate a reversal?
Technical Indicators for XRP Price
We stated above that the XRP price has touched the support line of the channel twice, creating two lower lows. During this time however, both the RSI and the MACD have generated higher values.
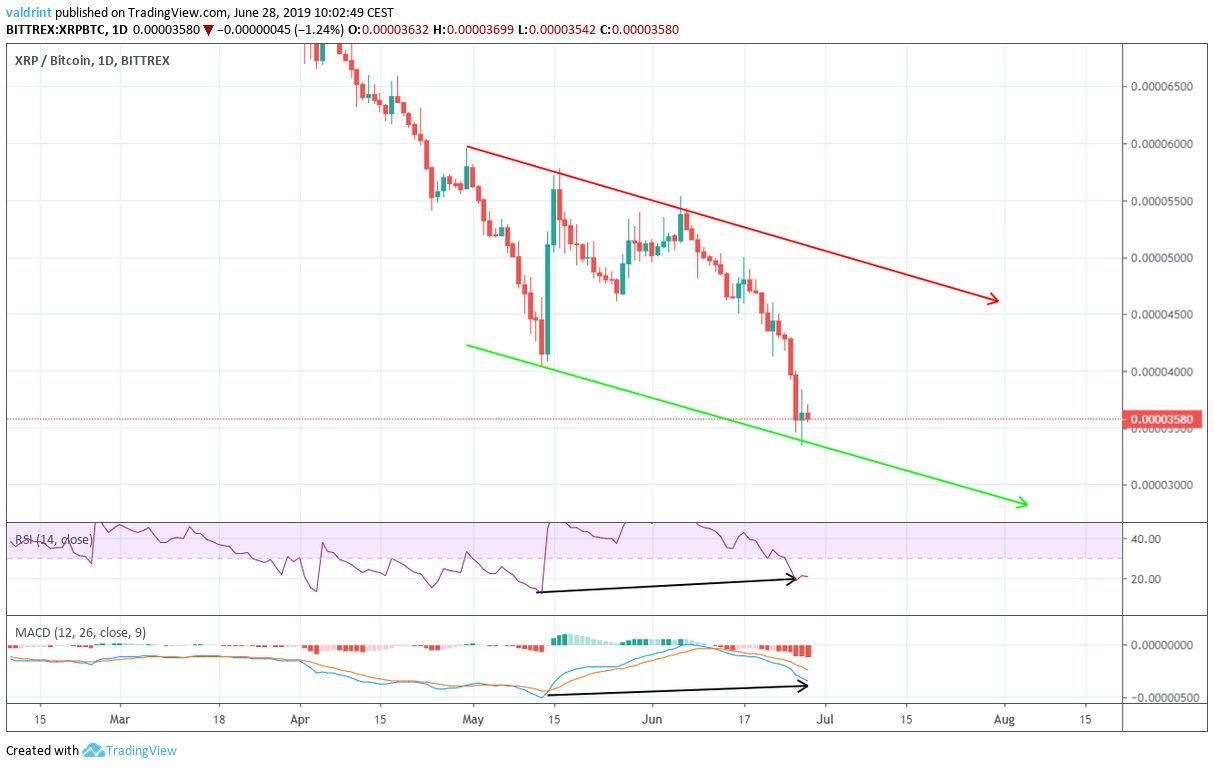
This is known as bullish divergence and often precedes price increases.
Furthermore, it is occurring on the support line of the channel, a likely place to initiate an upward move.
The moving averages, however, still give a bearish outlook.
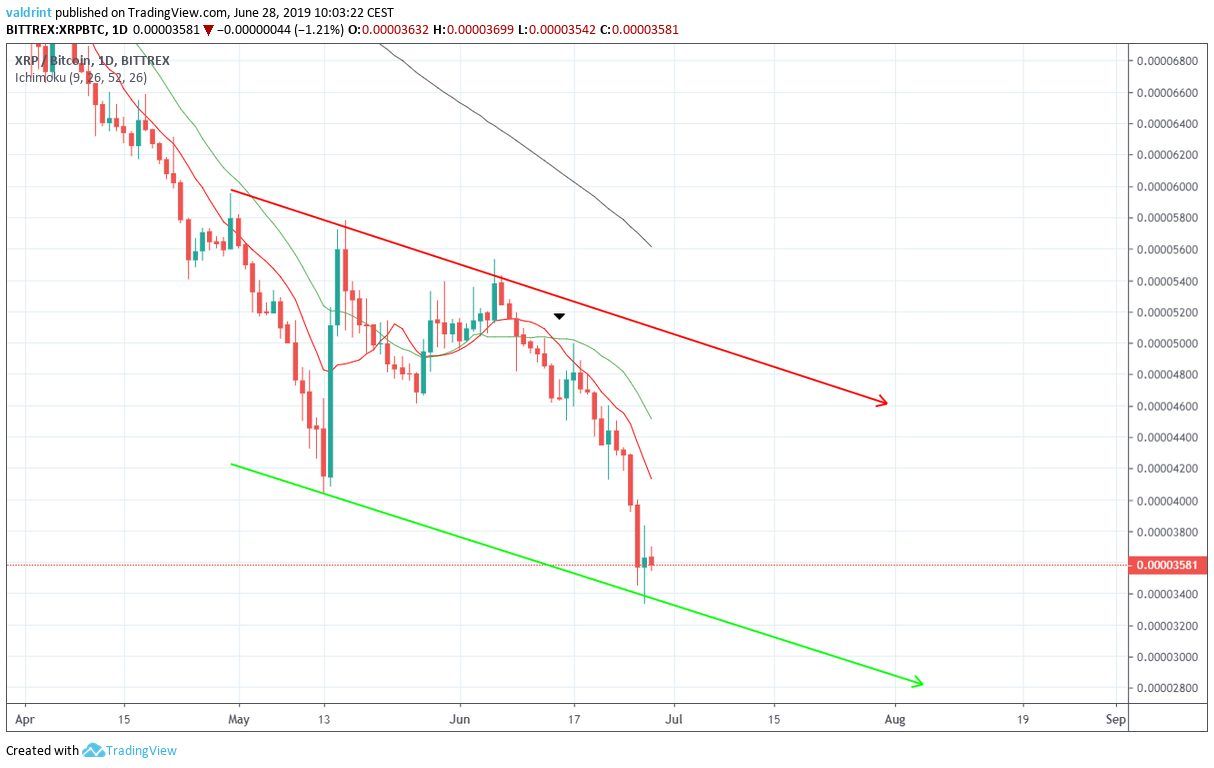
A bearish cross between the 10- and 20-period MAs occurred on June 14, and the price has been trading below both of them since. Both MAs have been rapidly decreasing.
Therefore, the MAs are showing that the price is still inside a downtrend, while the RSI and the MACD indicate that a reversal towards the resistance line of the channel could soon occur.
Long-Term
In a weekly time-frame, we can see that the recent decrease has taken the price to the 0.88 Fibonacci level of the entire upward move beginning in December 2017.
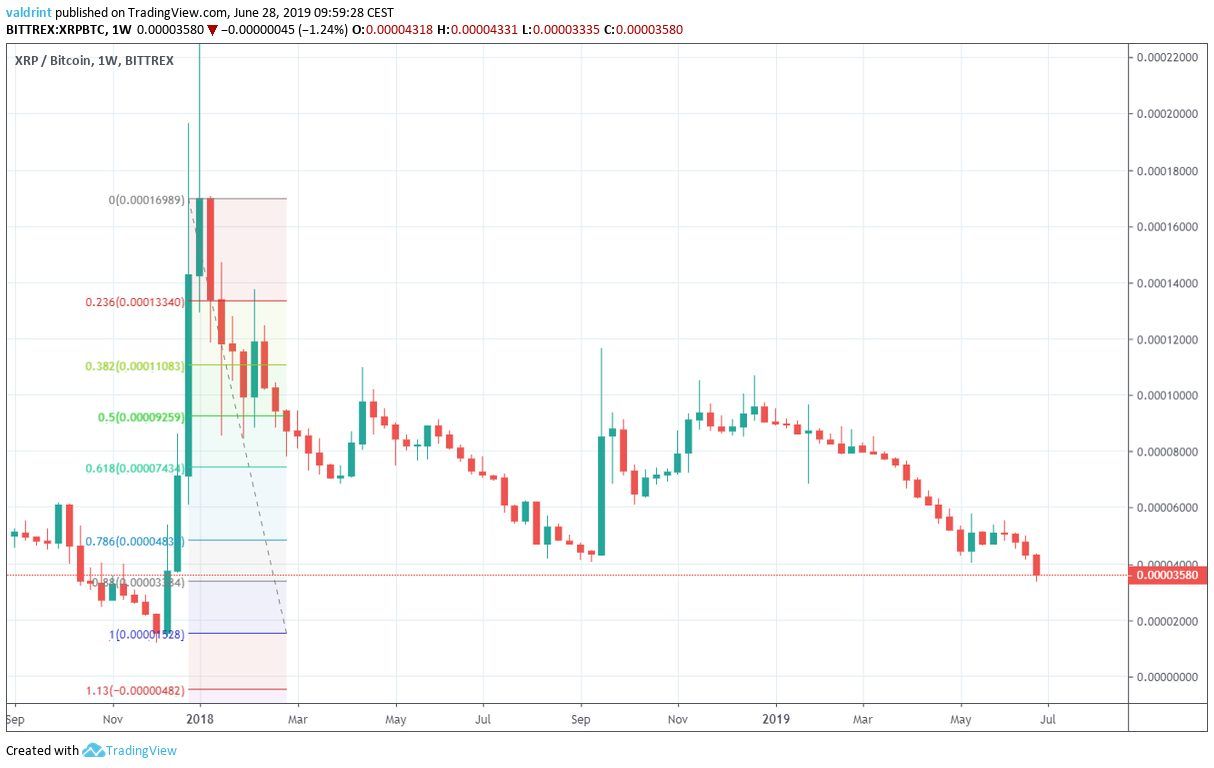
A full retracement would cause the XRP price to decrease all the way to 1500 satoshis.
An analysis of moving averages support this possibility.
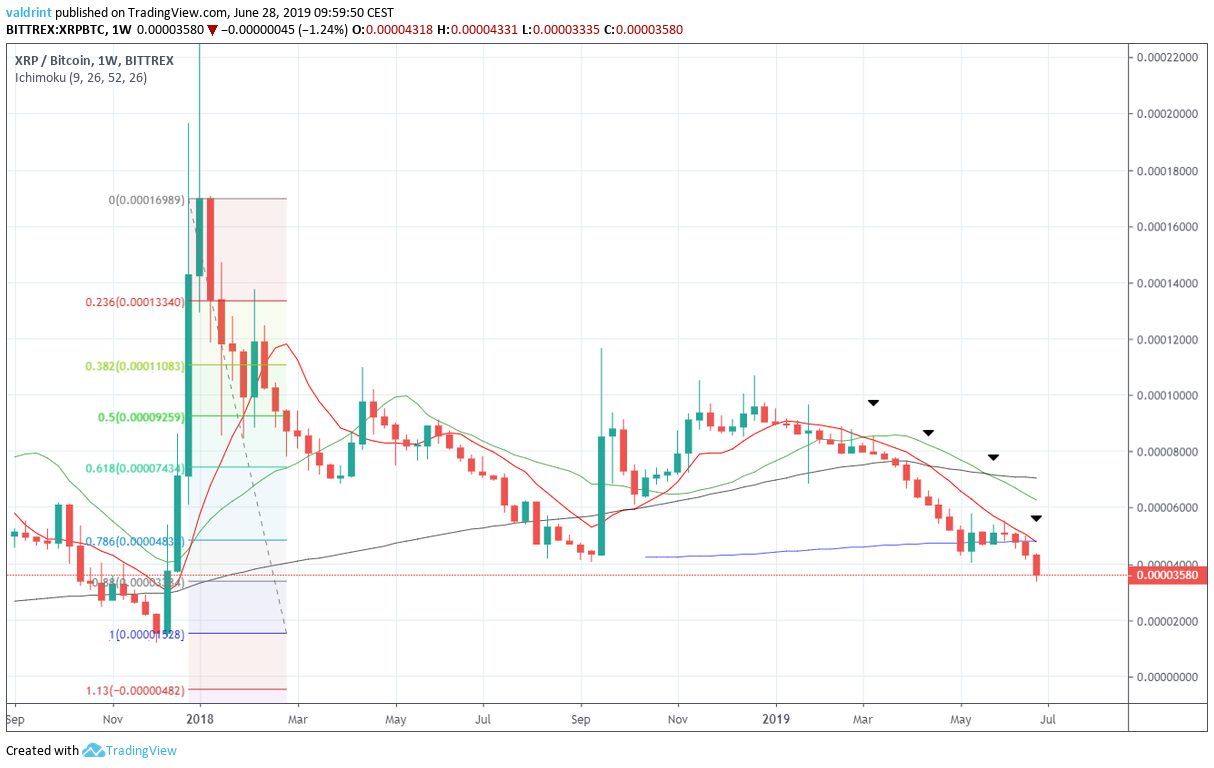
The XRP price recently decreased below the 200-period MA for the first time.
Furthermore, several bearish crosses have occurred since March.
The price is facing very close resistance from the 10-period MA, which is in the process of crossing below the 200-period MA.
Summary
The XRP price recently broke down below a significant support area. The price has not been near these levels since the end of 2017.
It is trading inside a descending channel and has developed a very significant bullish divergence in the daily time-frame.
However, longer-term time-frames still give a bearish outlook and indicate that the price is likely continue to decrease.
Where do you think the XRP price will find support? Let us know in the comments below.
Disclaimer: This article is not trading advice and should not be construed as such. Always consult a trained financial professional before investing in cryptocurrencies, as the market is particularly volatile.
All images are courtesy of TradingView
