


On July 11, 2019, the XRP price reached a low of 2777 satoshis. An upward move ensued. On July 30, it reached a high of 3356 satoshis. It has been decreasing since. On August 5, it broke down below the previous low.
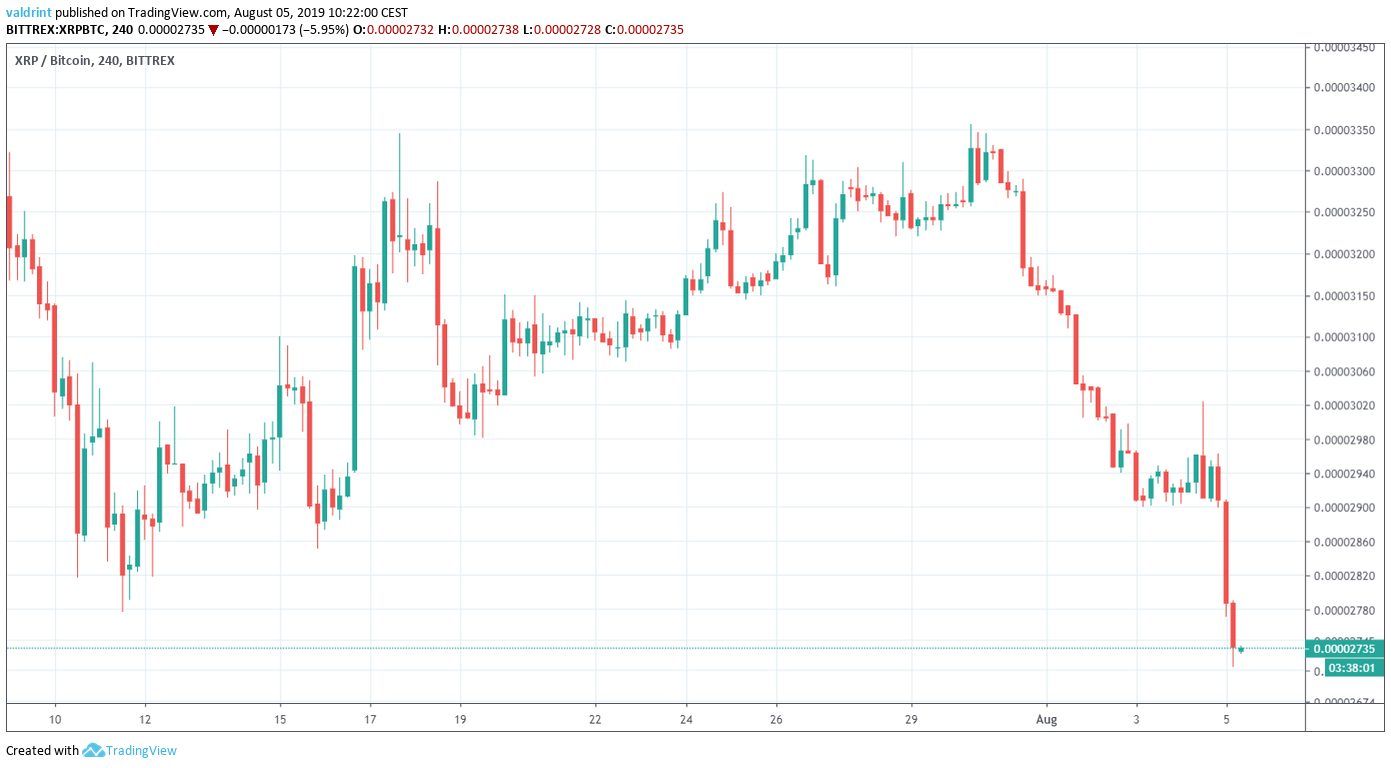
At the time of writing, it was trading near 2700 satoshis.
Where will it go next? Continue scrolling below if you want to find out.
For our previous analysis click here.

XRP Price: Trends and Highlights for August 5
- XRP/BTC broke down below a significant support area.
- There is support at 2300 satoshis.
- XRP is possibly trading inside a descending channel.
- Daily moving averages have made a bearish cross.
- There is bullish divergence developing in the RSI.
Failed Support
A look at the daily time-frame shows that the XRP price recently broke down below a significant support area.

On July 11, when it reached lows near 2800 satoshis, XRP began an upward move and generated long lower wicks.
This is a sign of buying pressure.
However, the current day’s bearish engulfing candle is eradicating the previous support.
In order to find the next support area, we need to take a look at the weekly time-frame.
The next support area is found at 2300 satoshis.
XRP has not traded below this level since December of 2017.
Current Pattern
A look at the daily time-frame shows that the XRP price has possibly been trading inside a descending channel since the beginning of July.
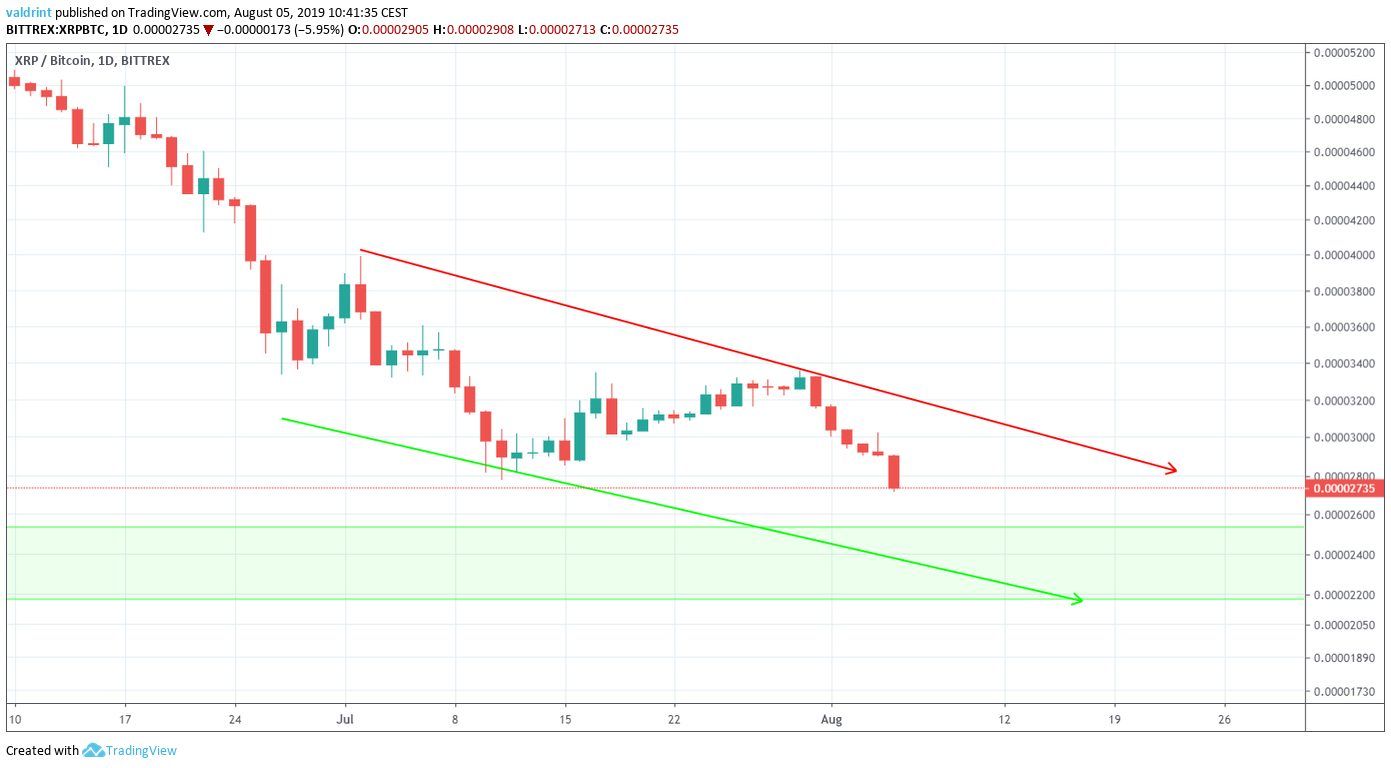
A less steep slope would likely create a descending wedge instead of the channel.
However, we can say with certainty that the price is following a descending pattern.
If it continues to decrease at the rate predicted by it, it should reach our support area by August 14.
Let’s take a look at technical indicators and see how likely it is to decrease there.
Technical Indicators

The aforementioned MAs made a bearish cross on August 5.
This is often a sign that a downtrend has begun.
The price has been trading below both of them since.
However, a look at the RSI gives us our first bullish sign.
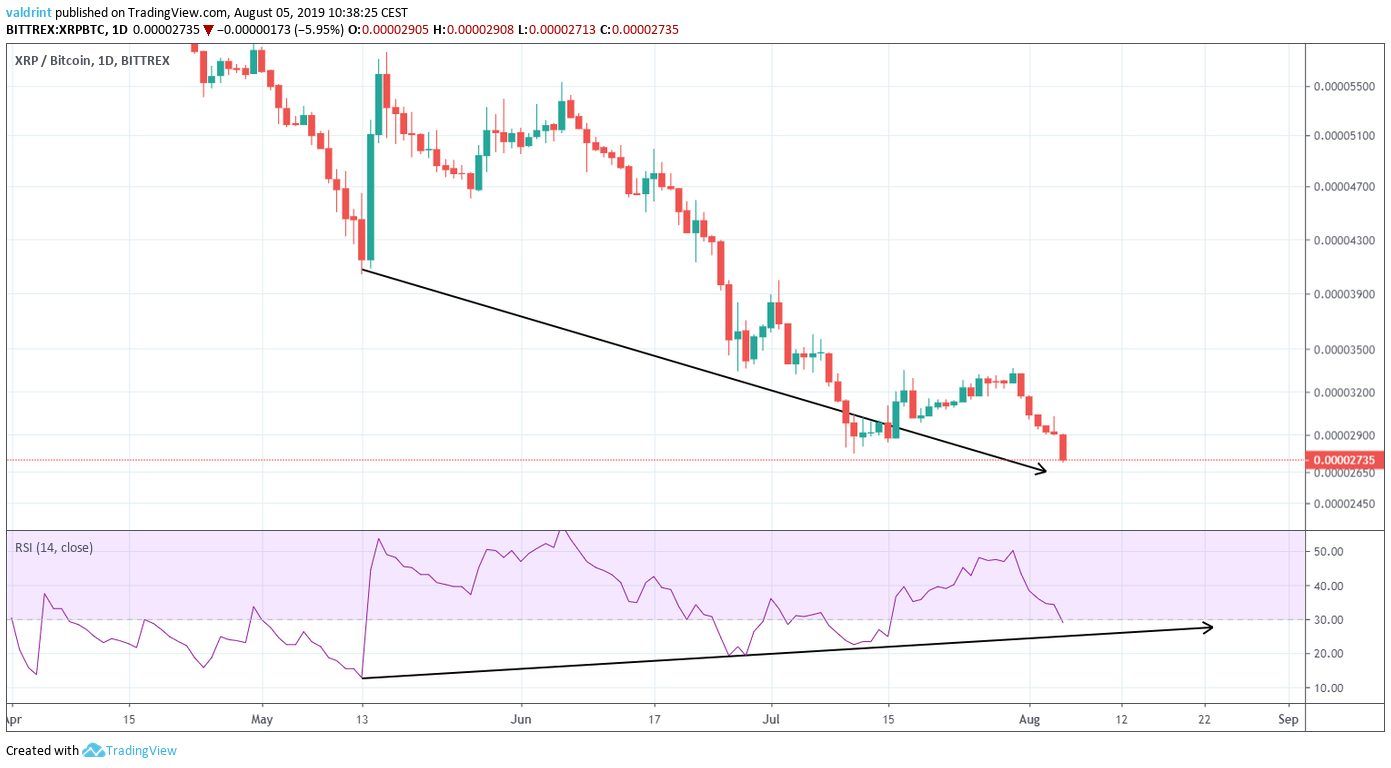
Significant bullish divergence has been developing since May 13.
Additionally, the upward sloping trend line of the divergence has yet to be broken.
A drop towards the support area would likely cause the RSI to drop to the trend line.
If the trend line is not broken, the price is likely to initiate an upward move.
XRP Price Summary
The XRP price is possibly trading inside a descending channel.
According to our analysis, it is likely to decrease at the rate predicted by the channel until it reaches the support area outlined above.
Do you think XRP will continue to decrease? Let us know in the comments below.
Disclaimer: This article is not trading advice and should not be construed as such. Always consult a trained financial professional before investing in cryptocurrencies, as the market is particularly volatile.
Images are courtesy of TradingView, Shutterstock.


