The (XRP) price is nearing a long-term support level, which is expected to initiate a bounce. Failure to do so would put the bullish structure in doubt.
Long-Term Support
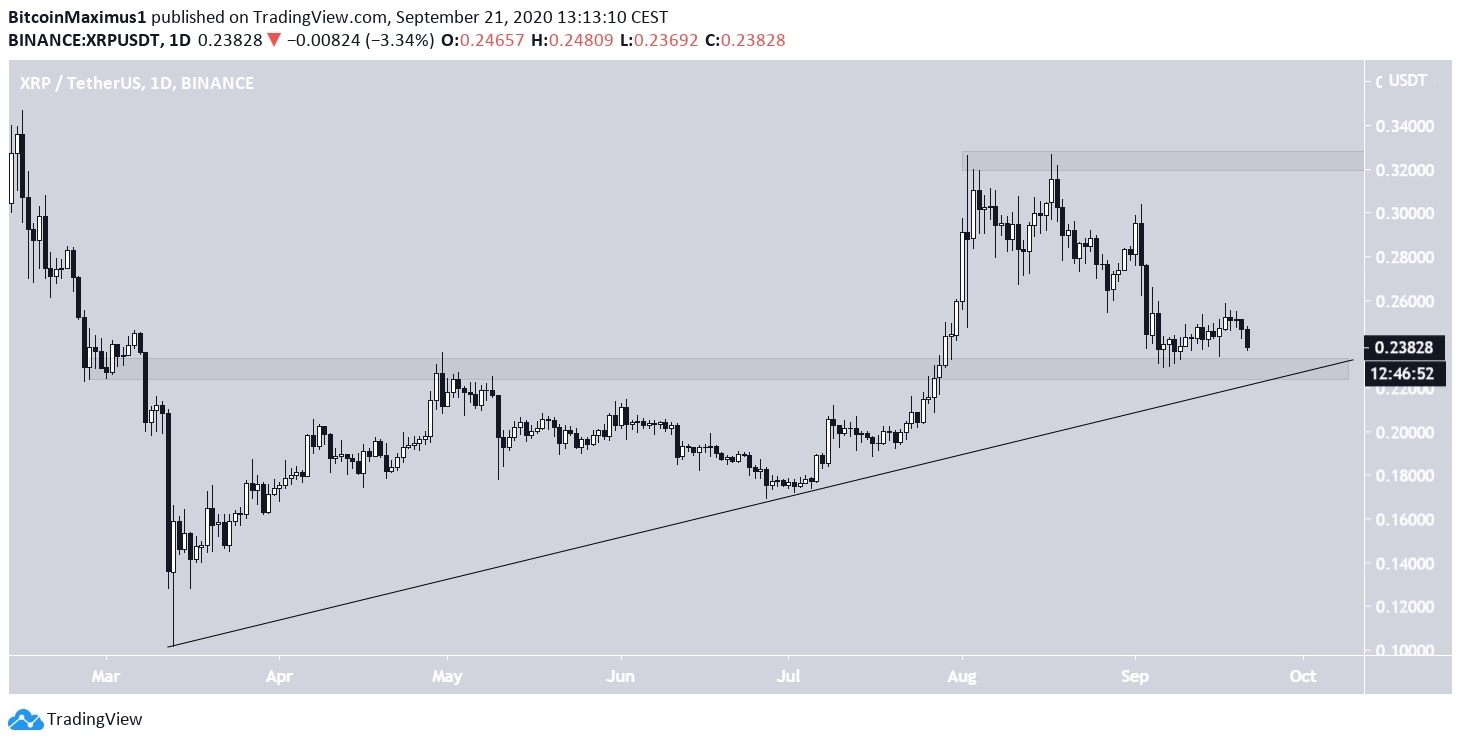
The XRP price has been increasing alongside an ascending support line since it reached a low of $0.10 on March 13.
The rate of increase began to accelerate in the beginning of July and price continued to move upwards until it reached a high of $0.326 on Aug. 17. Afterwards, it began the current decrease that is still ongoing.
The closest support and resistance levels are found at $0.230 and $0.325, respectively.
Technical indicators are undecided. The MACD has been gradually increasing over the past two weeks, but has not yet crossed into positive territory. The RSI is below 50 and has begun to decrease. In addition, the Stochastic Oscillator might have just rejected a bullish cross and began to decrease as well.
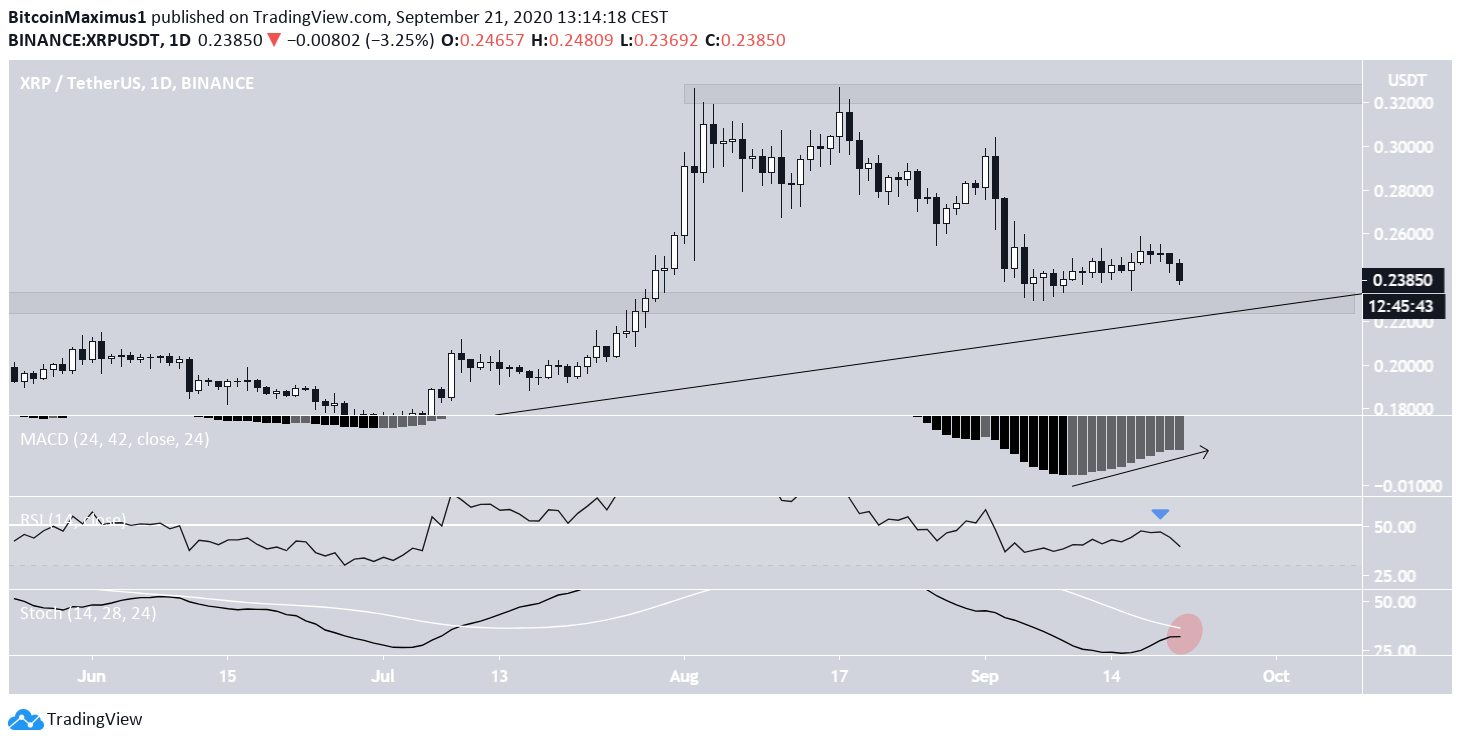
This makes it likely that the price will drop once more and validate the $0.23 support area and the ascending support line, before possibly beginning an upward move.
Wave Count
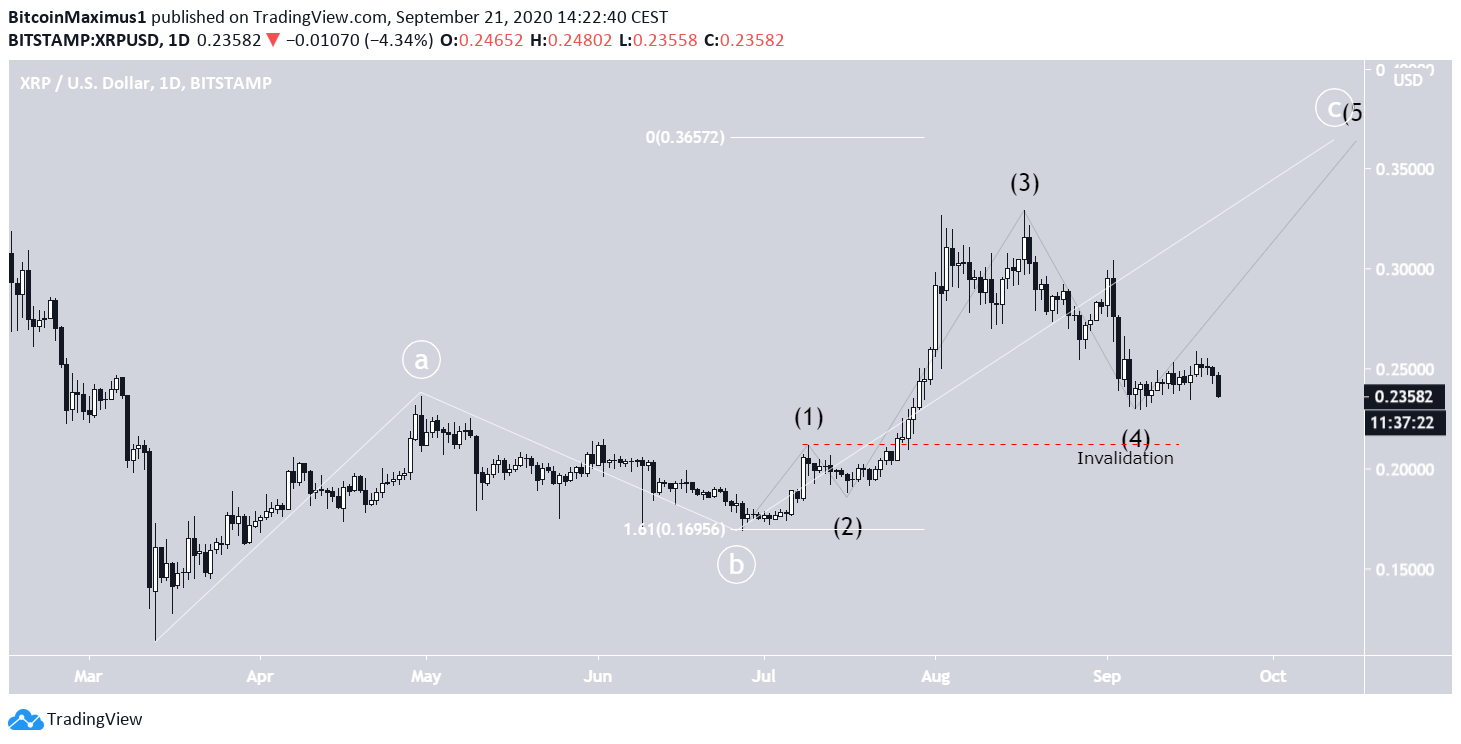
The most likely wave count until now is that the price has begun an upwards A-B-C correction (white) with the low reached on March 13. The C wave is made up by a bullish impulse (black), in which XRP is currently in the fourth wave.
A target for the top of the movement is found at $0.365, which would give the A:C waves a 1: 1.61 ratio, common in A-B-C structures.
The invalidation for this particular wave count would be above the July 11 high at $0.2115.
While it is possible that this is an extended 1-2/1-2 wave count, it does not seem likely due to the shape of the price action.
It is worth mentioning that the Sept. 19 increase above $0.26 invalidated the possibility of the movement being a bearish impulse.
Similar to the previous chart, it is technically possible that this is an extended 1-2/1-2 wave count, but that seems unlikely based on the price action so far.

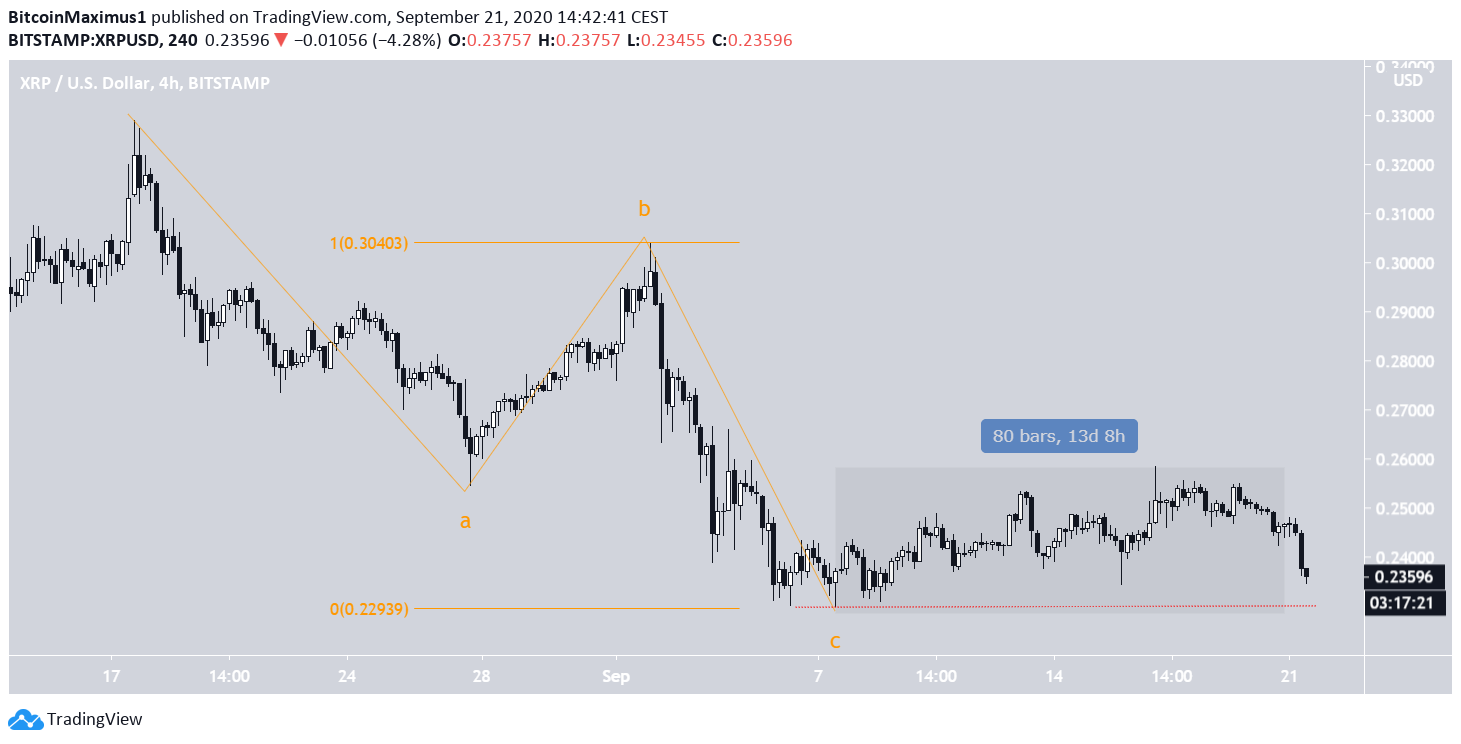
The correction has likely transpired inside an A-B-C formation. If so, it is possible that XRP has completed its correction, since waves A:C have a 1:1 ratio.
However, the movement succeeding the low does not look impulsive, casting some doubt on the validity of the move.
A decrease below the Sept. 3 low at $0.2293 would invalidate this count.
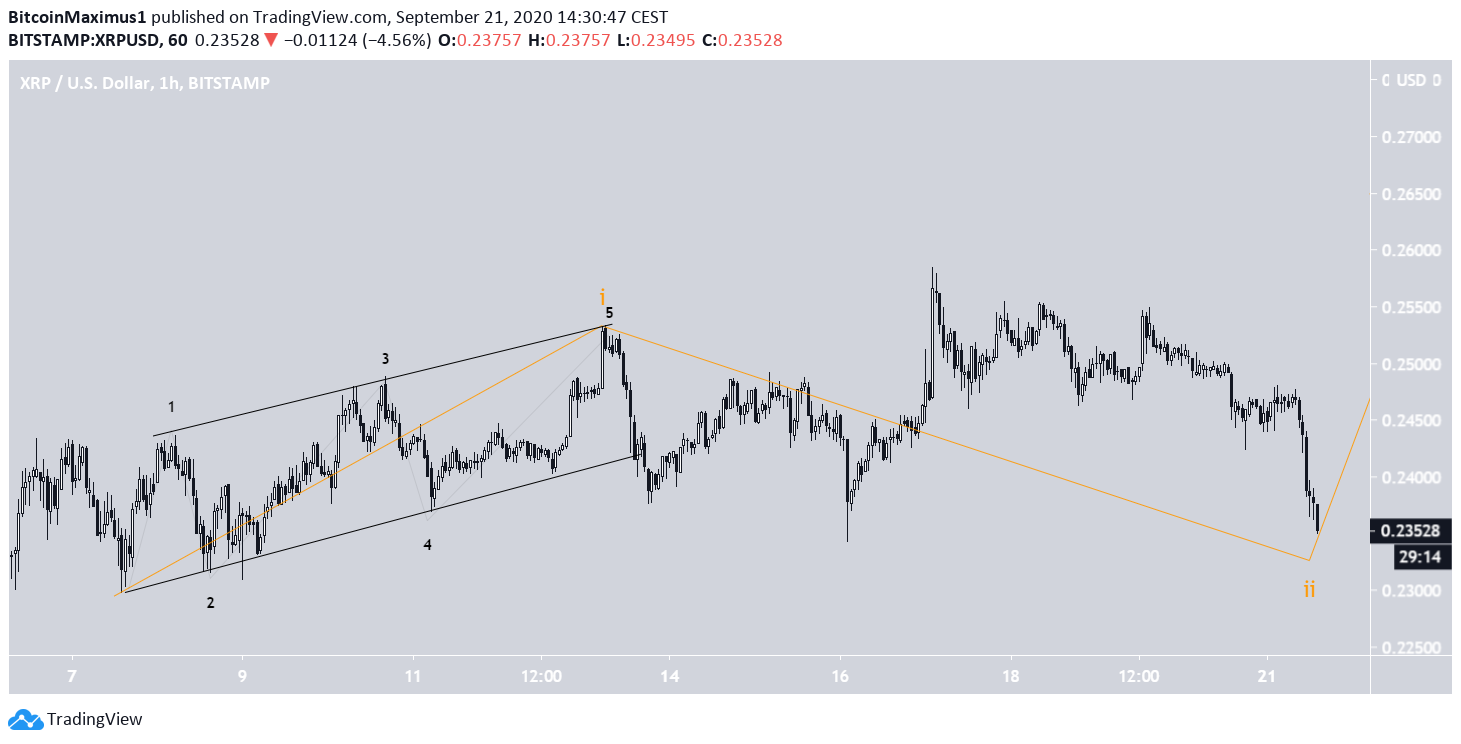
One of the few possible counts in which the highlighted period in the previous image is an impulse is shown below.
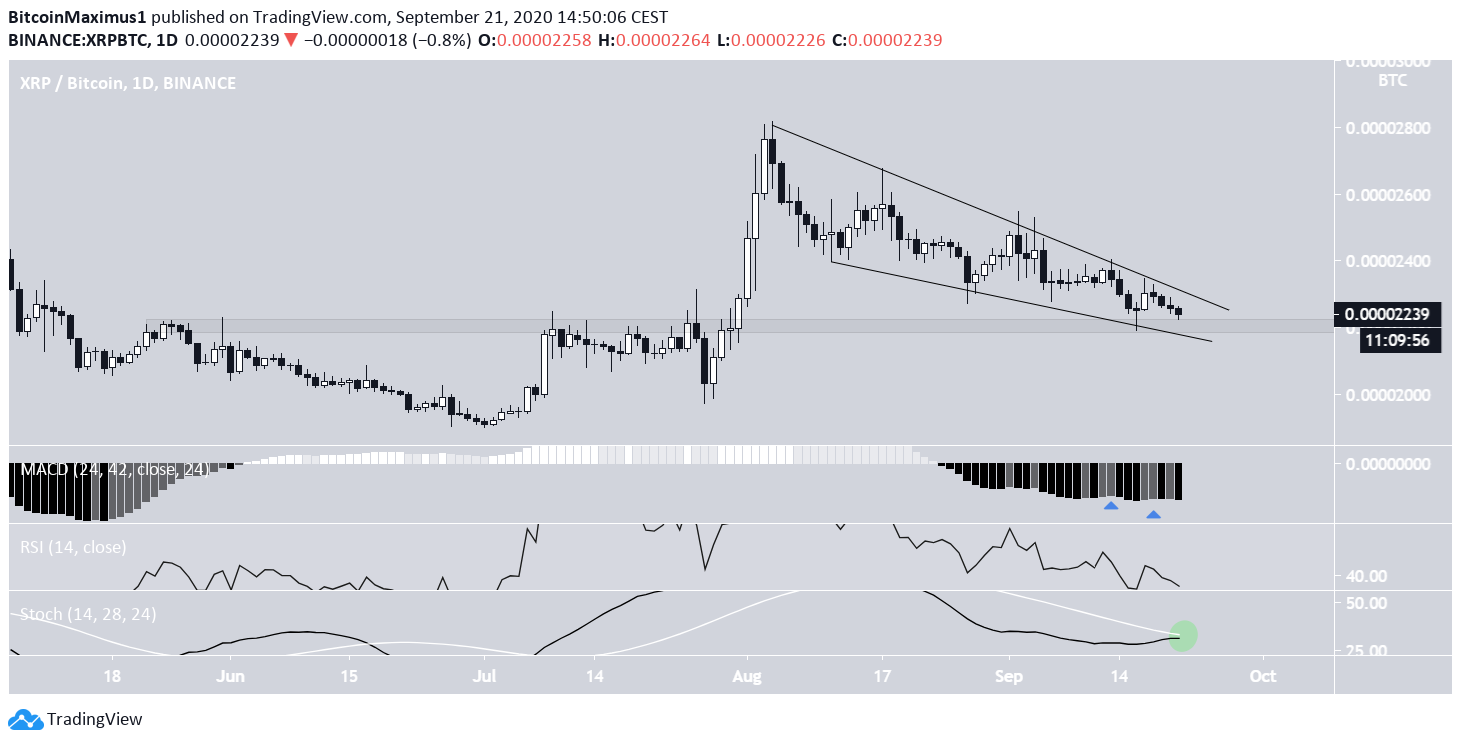
XRP/BTC
Cryptocurrency trader @CryptoMichNL stated that the XRP price is nearing his target for the end of the correction, which is at 2,140 satoshis.
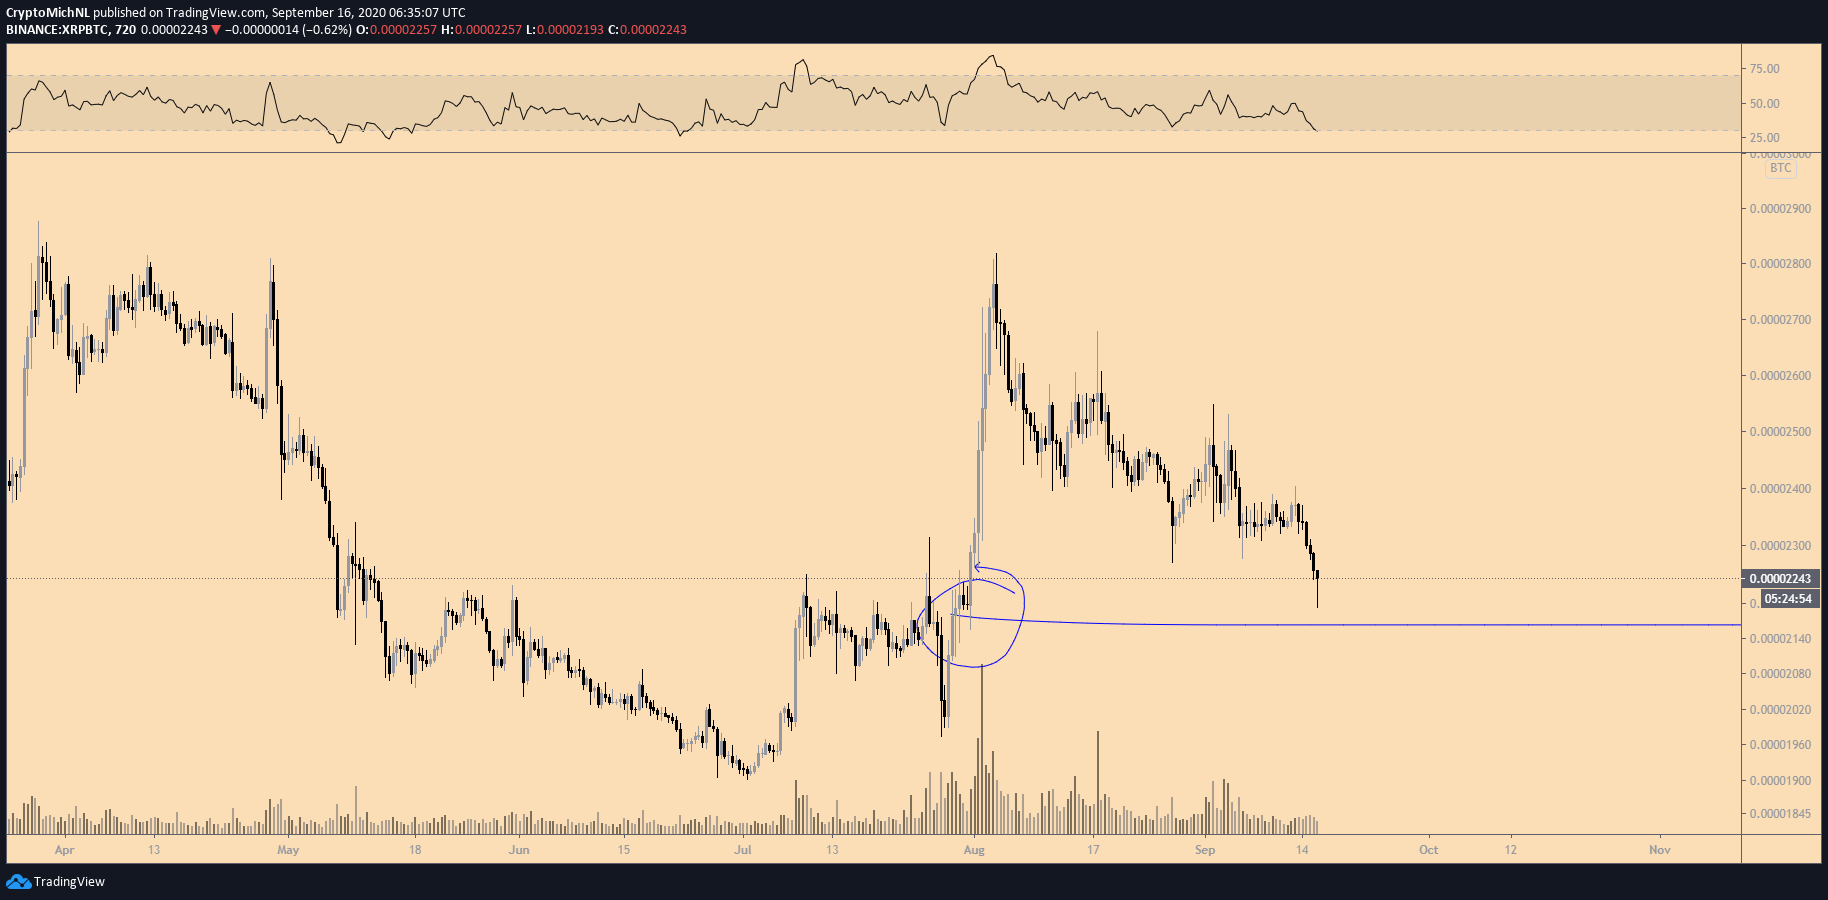
Indeed, there is a very strong support area near 2,240 satoshis. Furthermore, the price is trading inside a descending wedge, which is considered a bullish reversal pattern.
While technical indicators are not yet bullish, they could turn if the price breaks out from the wedge, which seems likely.
A bullish cross in the Stochastic Oscillator would confirm that the price is heading upwards.