


The Swell conference, which is arguably the most important Ripple conference of the year, was held in Singapore on November 9-11. During the previous two conferences in 2017 & 2018, the price increased significantly in anticipation of the event. In 2019, however, this was not the case, since the XRP price did not see any notable movement.
It is likely that fans of the cryptocurrency were expecting a major announcement that would impact the market. However, there was no such announcement. But, on November 13, A crypto twitter bot identified a major transfer of 99,999,900 XRP. Apparently, it was sent to a firm that specializes in market-making.
The XRP price failed to break out above a significant resistance area. If it decreases below $0.25, it could rapidly reach the low $0.20s.
Crypto analyst and trader @CryptoZyzz stated that the XRP price is at a critical point. If it does not break out from the current resistance, we might see a very rapid price decrease.
if $xrp is not breaking resistance soon its gg pic.twitter.com/ckSNl2v3it
— zyzz (@CryptoZyzz) November 15, 2019
In order to come to this conclusion, he used the logarithmic price movement of XRP and outlined a descending triangle.
Let’s take a look at the XRP price in different time-frames to see if a breakdown is likely.
XRP Long-Term Outlook
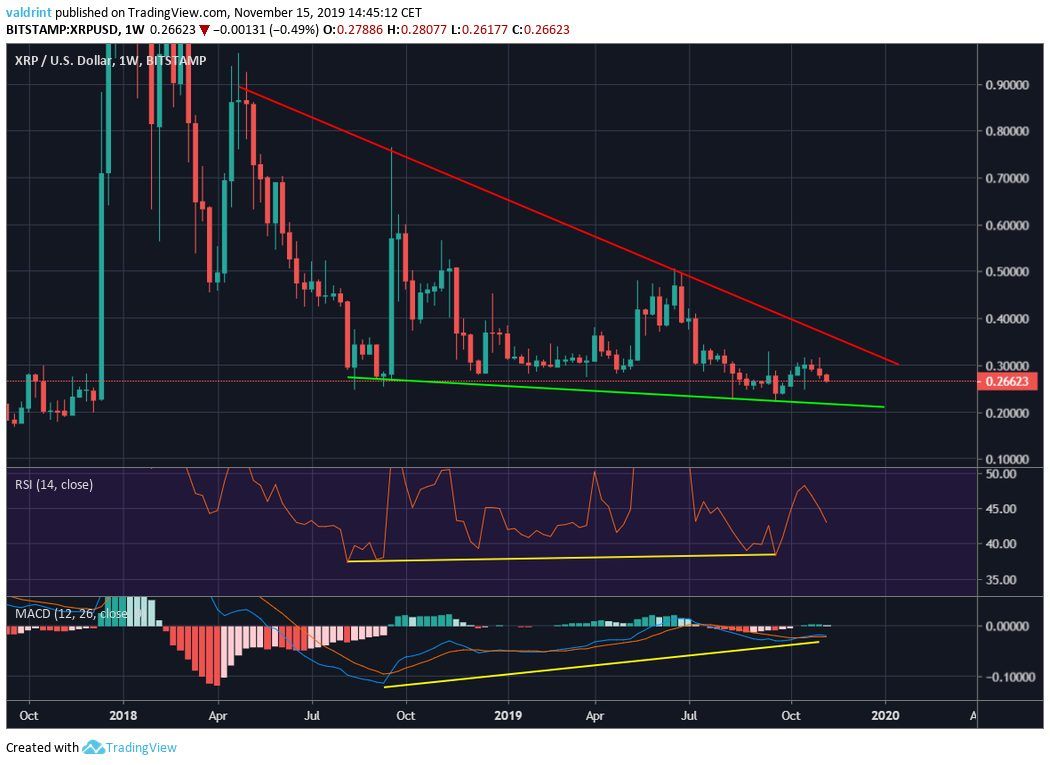
Looking at the XRP chart, we can see that the price is following a descending resistance line that has been in place since April 2018. The logarithmic chart is not used since we believe curved trend-lines work better with log charts while straight lines with regular charts.
Additionally, the support line is slightly descending, making the current pattern a descending wedge.
There is a slight bullish divergence in the RSI and a pronounced divergence in the MACD. This supports the hypothesis that the price is trading inside a descending wedge and provides a bullish outlook.
Triple Top
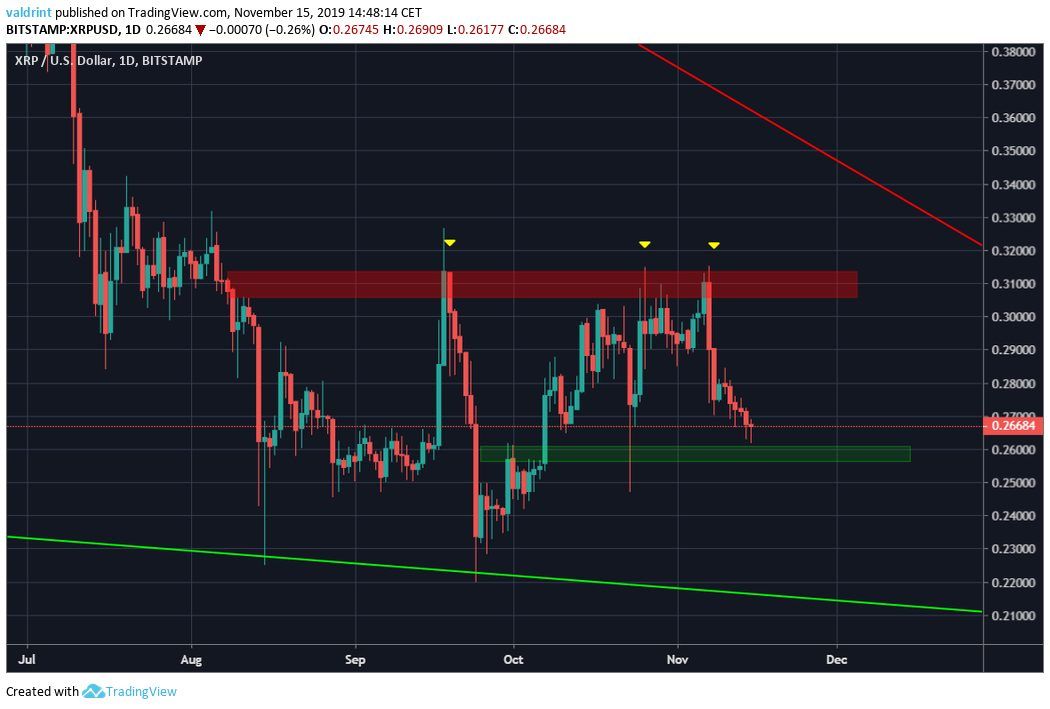
Over the past two months, the XRP price made a triple top inside the resistance area at $0.31. This is a bearish pattern. The price began a downward move after the third top on November 7 and has been decreasing since.
There is a support area at $0.25. For the bullish outlook to remain intact, the price should reverse here and trade in a range between $0.26-$0.31.
A breakdown below this support area would likely cause the price to decrease to the support line of the wedge at around $0.21.
Disclaimer: This article is not trading advice and should not be construed as such. Always consult a trained financial professional before investing in cryptocurrencies, as the market is particularly volatile.
Did you know you can trade sign-up to trade Bitcoin and many leading altcoins with a multiplier of up to 100x on a safe and secure exchange with the lowest fees — with only an email address? Well, now you do! Click here to get started on StormGain!


