Let’s take a closer look at the XRP price movement and determine where it is heading to next.I actually want to see a break and close below as it would likely make this potential weekly bullish div materialize. In fact, I will probably enter a long position once we do. $XRP https://t.co/2wyDHsczI0 pic.twitter.com/fw80GGYC32
— Credible Crypto (@CredibleCrypto) December 21, 2019
XRP Significant Areas
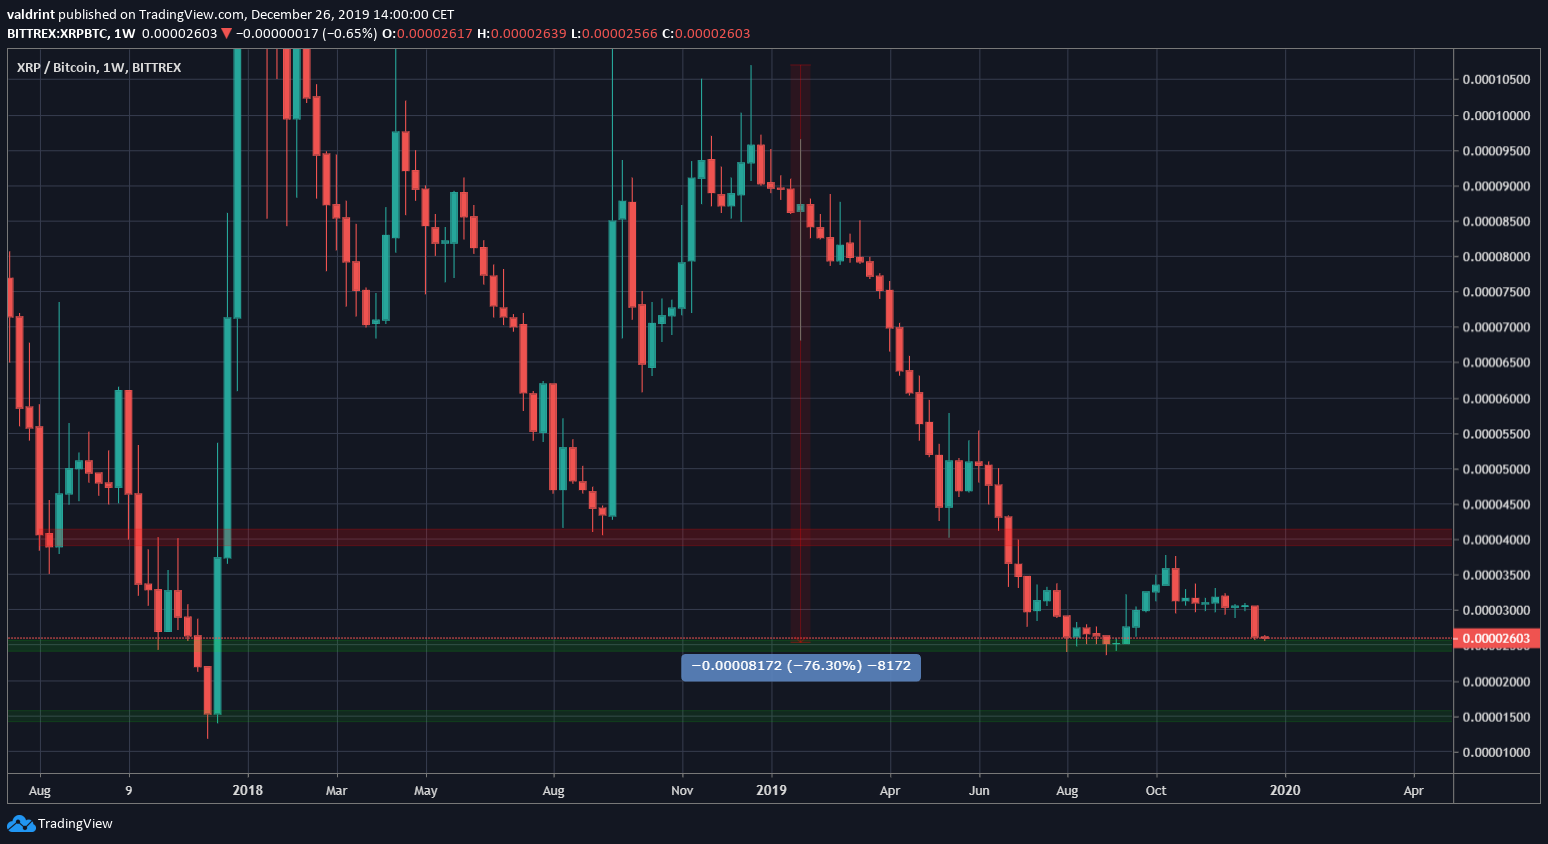
The XRP price has been decreasing since December 2018, having lost 76% of its value. Currently, it is possibly making a double bottom at the 2500 satoshi support area. The previous breakdown level is at 4000 satoshis, current support is 2500 satoshis while the next support area is at 1500 satoshis. The rally that began in September was preceded by bullish divergence in the RSI. The bullish divergence trend is still intact, allowing for the possibility of a double bottom, which would be followed by an upward move.
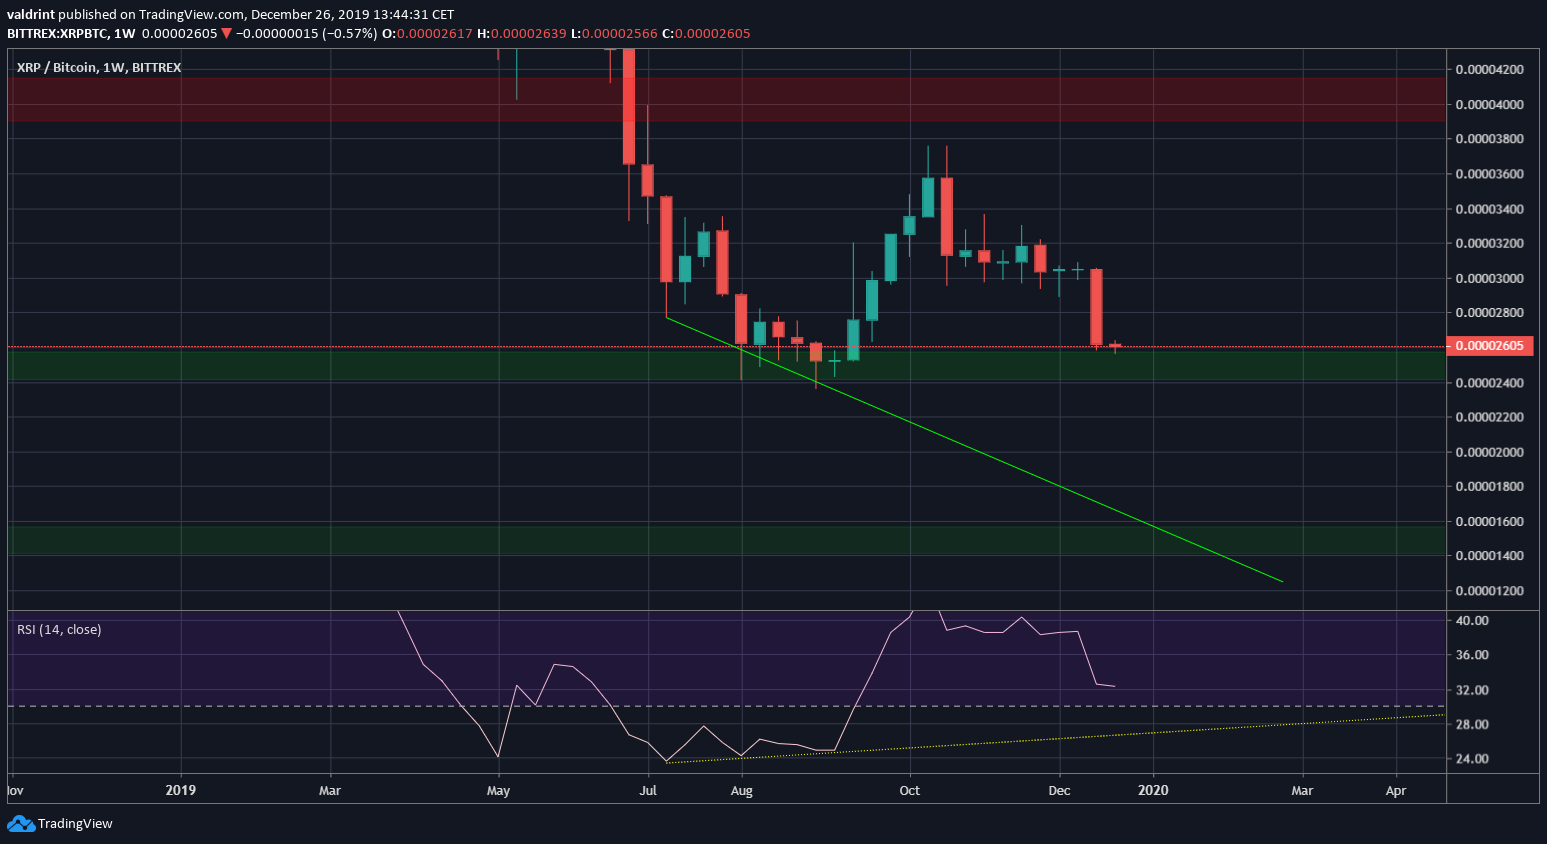
 However, as mentioned in the tweet, there is another possibility in play. The bullish divergence trend-line is significantly more gradual than the current RSI movement. Thus, the RSI would have to continue decreasing in order to bounce at the trend-line.
Also, the price is possibly following a descending support line. The line would coincide with the 1500 support area in January/February 2020.
 Which of the scenarios is more likely?
Future Movement
Looking at lower time-frames, we can see a developing bullish divergence, in both the RSI and the MACD. This suggests that an upward move will follow, especially since the price is trading near a significant support area. Thus, the double bottom scenario seems likely, with the strength of the upward move determining whether the move will continue or it will only be a bounce. A previous RSI pattern suggests that this will be a bounce and the price will continue to the next support area, thus validating the second scenario.
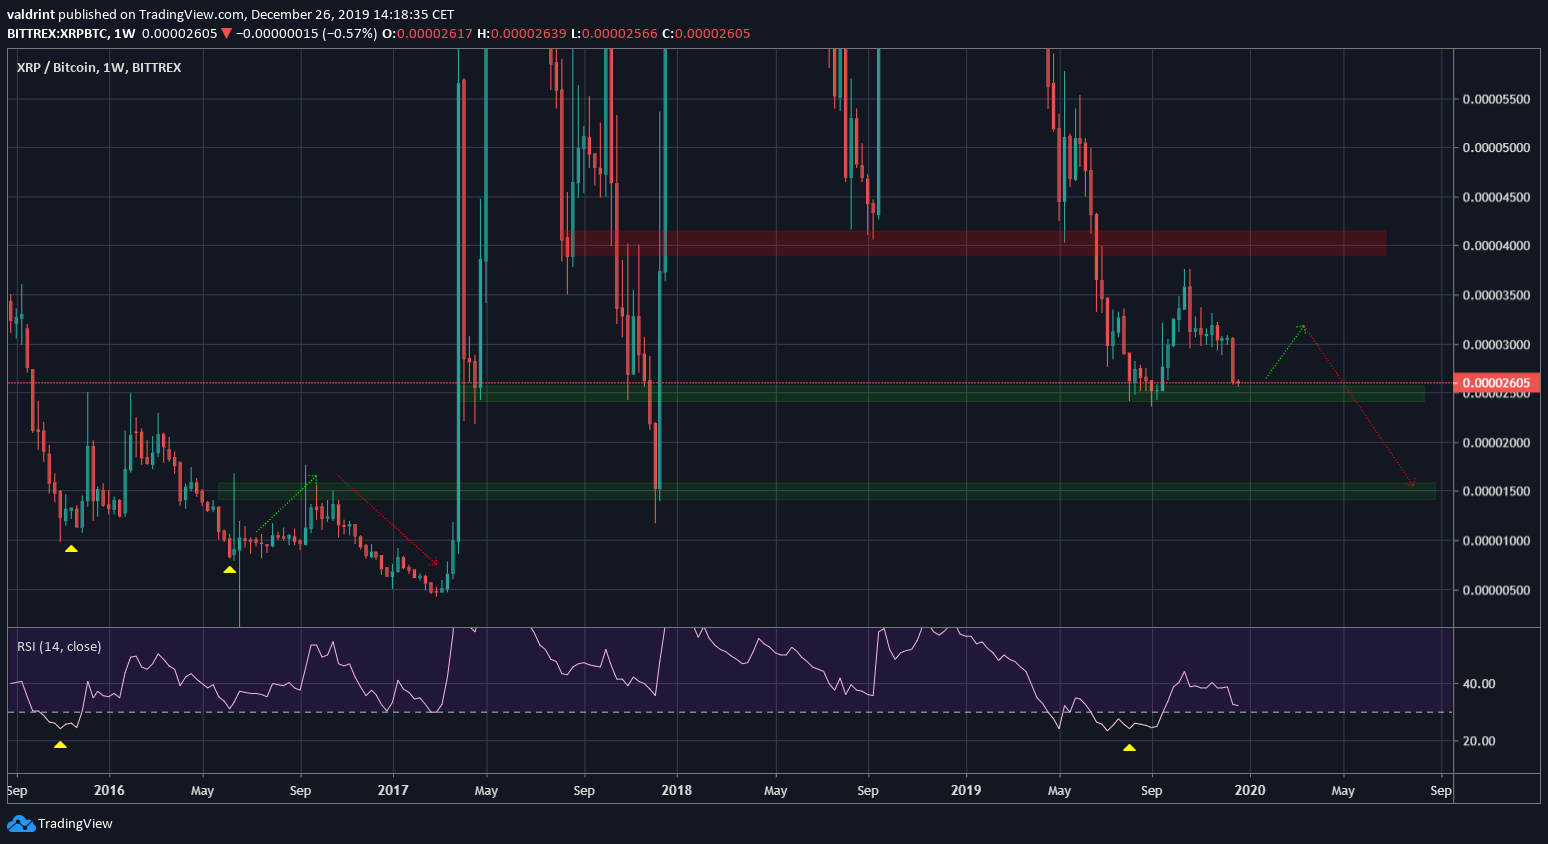
The RSI has only been oversold on two occasions: October 2015 and September 2019.
In October 2015, the price made a sort of double bottom, began a weak upward move, then decreased further before beginning a new upward cycle.
Since lower time-frames suggest a bounce will occur, the first part of the pattern is very likely to be the same. If the bounce occurs with low volume, we can be positive that the price will decrease to the second support area at 1500 satoshis.
 To conclude, the XRP price has almost reached a strong support area which was the catalyst for an upward move in September. We believe it is likely to make a double bottom and begin to increase. The strength of the bounce will determine if the price will make another low or begin a new market cycle.
Disclaimer
In line with the Trust Project guidelines, this price analysis article is for informational purposes only and should not be considered financial or investment advice. BeInCrypto is committed to accurate, unbiased reporting, but market conditions are subject to change without notice. Always conduct your own research and consult with a professional before making any financial decisions. Please note that our Terms and Conditions, Privacy Policy, and Disclaimers have been updated.


![XRP Decreased Significantly in 2019: Will It Perform Better in 2020? [Premium Analysis]](https://beincrypto.com/wp-content/uploads/2019/10/bic_xrp_daily_ransactions.jpg.optimal.jpg)