
XRP initiated a rapid upward movement on Feb. 2, but was promptly rejected and has failed to close above a long-term resistance area.
The direction of the trend for XRP is uncertain, but it will most likely complete one more leg down before an eventual upward move.
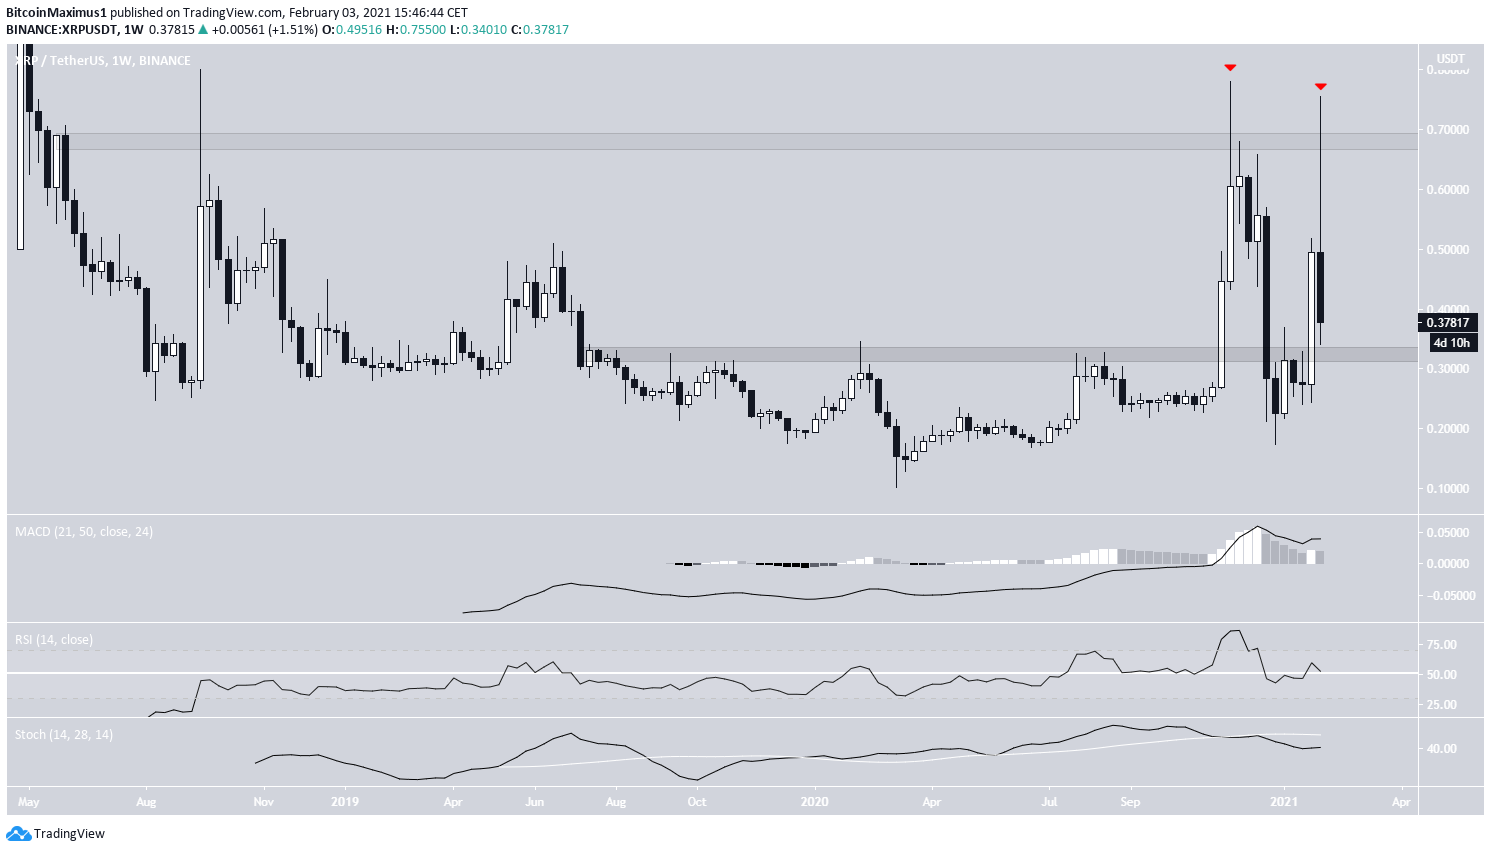
XRP Range Trading
The weekly chart shows that XRP has been twice rejected by the long-term $0.68 resistance area — most recently on Feb. 1. It has created long upper wicks each time.
After the rejection, XRP dropped sharply and has nearly reached the $0.33 support area.
Technical indicators are relatively neutral, failing to provide a direction for the trend.
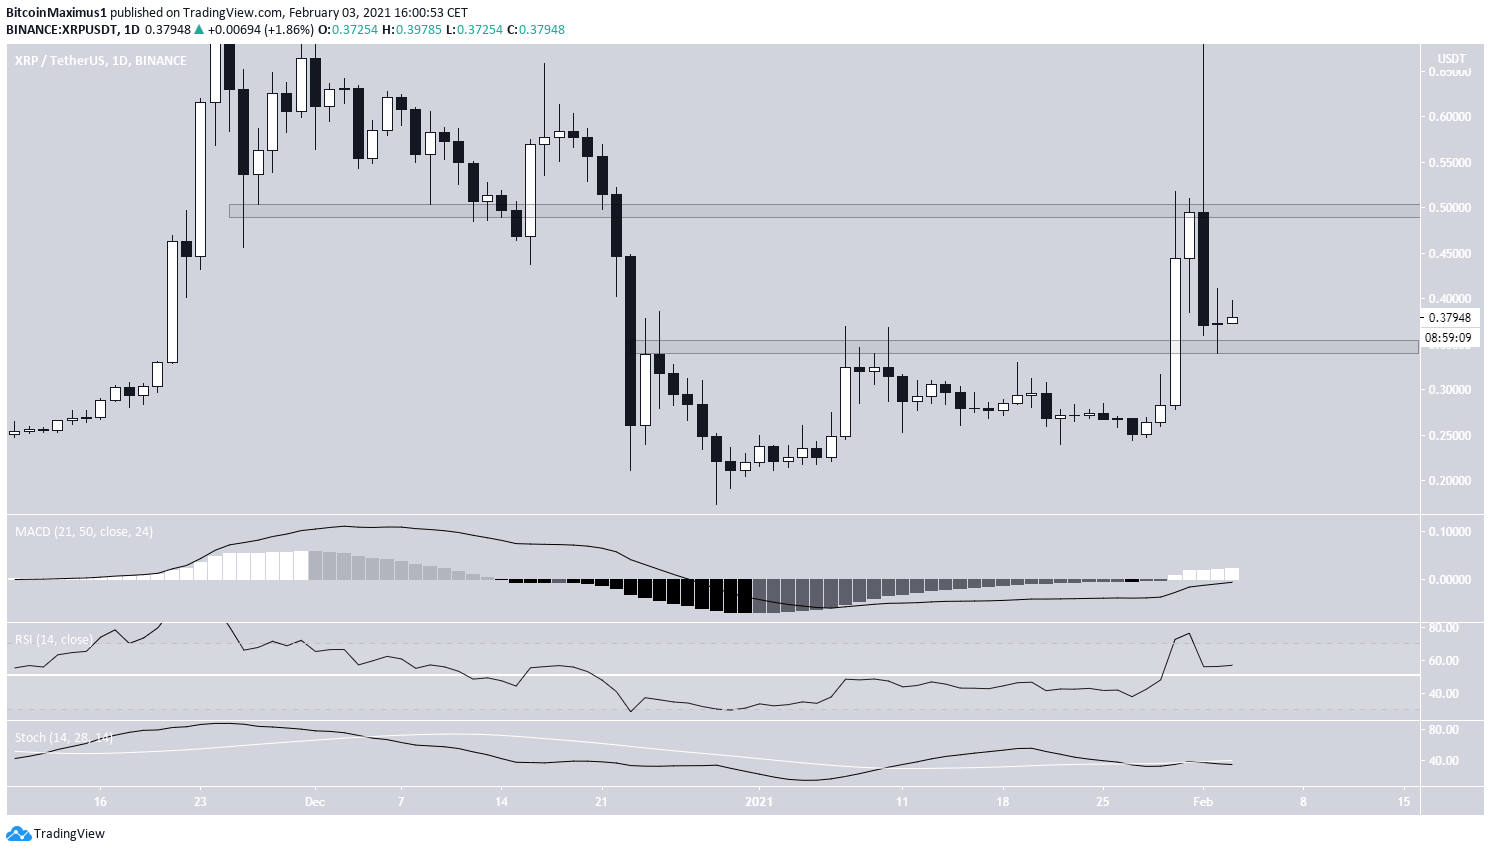
The daily chart does nothing to clarify the trend.
XRP seems to be trading in a short-term range between $0.35-$0.50. It’s closer to the lower end of the range currently.
Technical indicators are somewhat bullish, indicating a possible increase towards $0.50. However, we cannot yet determine if XRP will break out.
Wave Count
Cryptocurrency trader @TheTradinghubb outlined an XRP chart. The overview indicates that XRP has possibly finished its correction and has begun another bullish impulse.
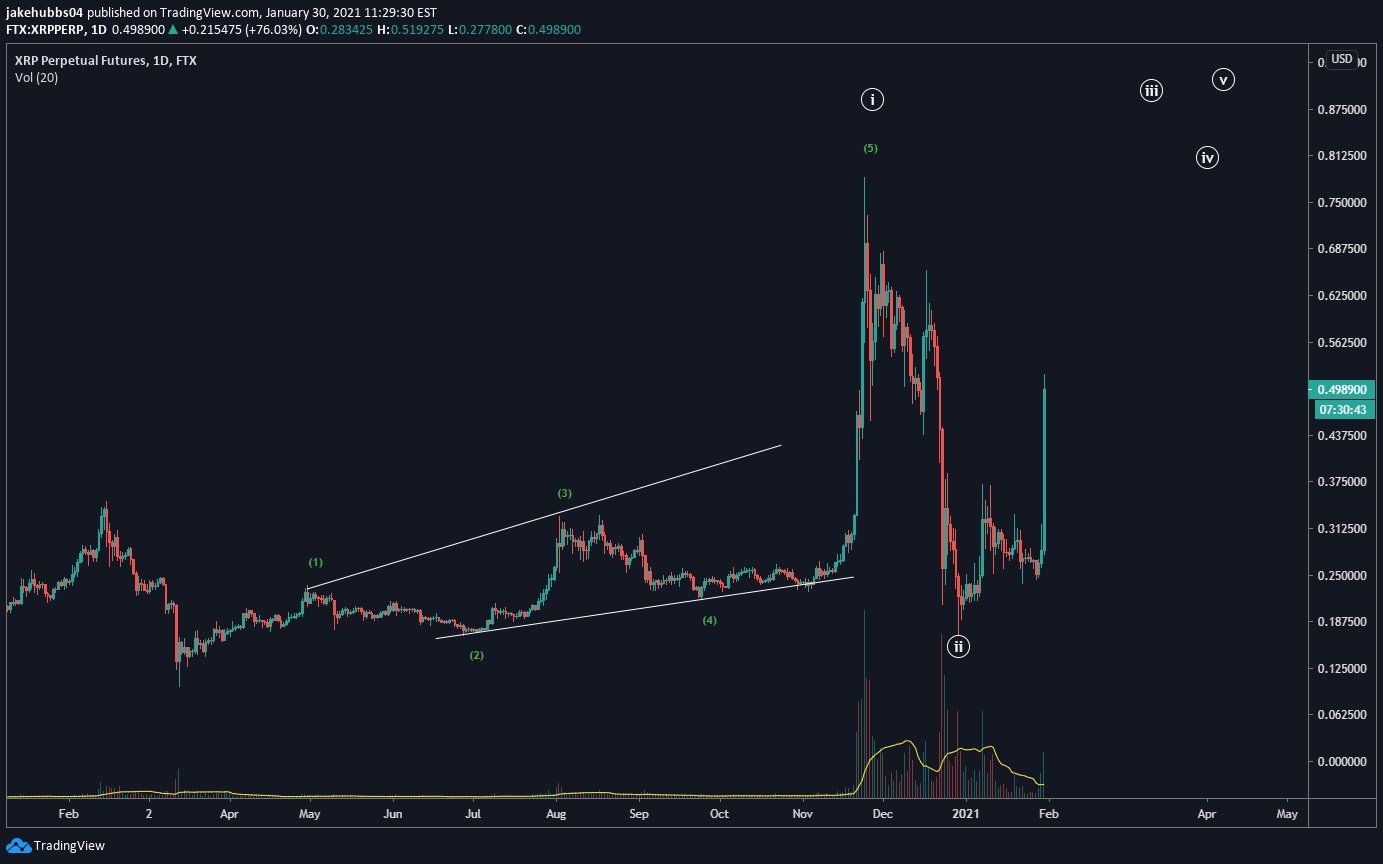
However, the Feb. 1 movement casts some doubt on this possibility, suggesting that XRP is still correcting.
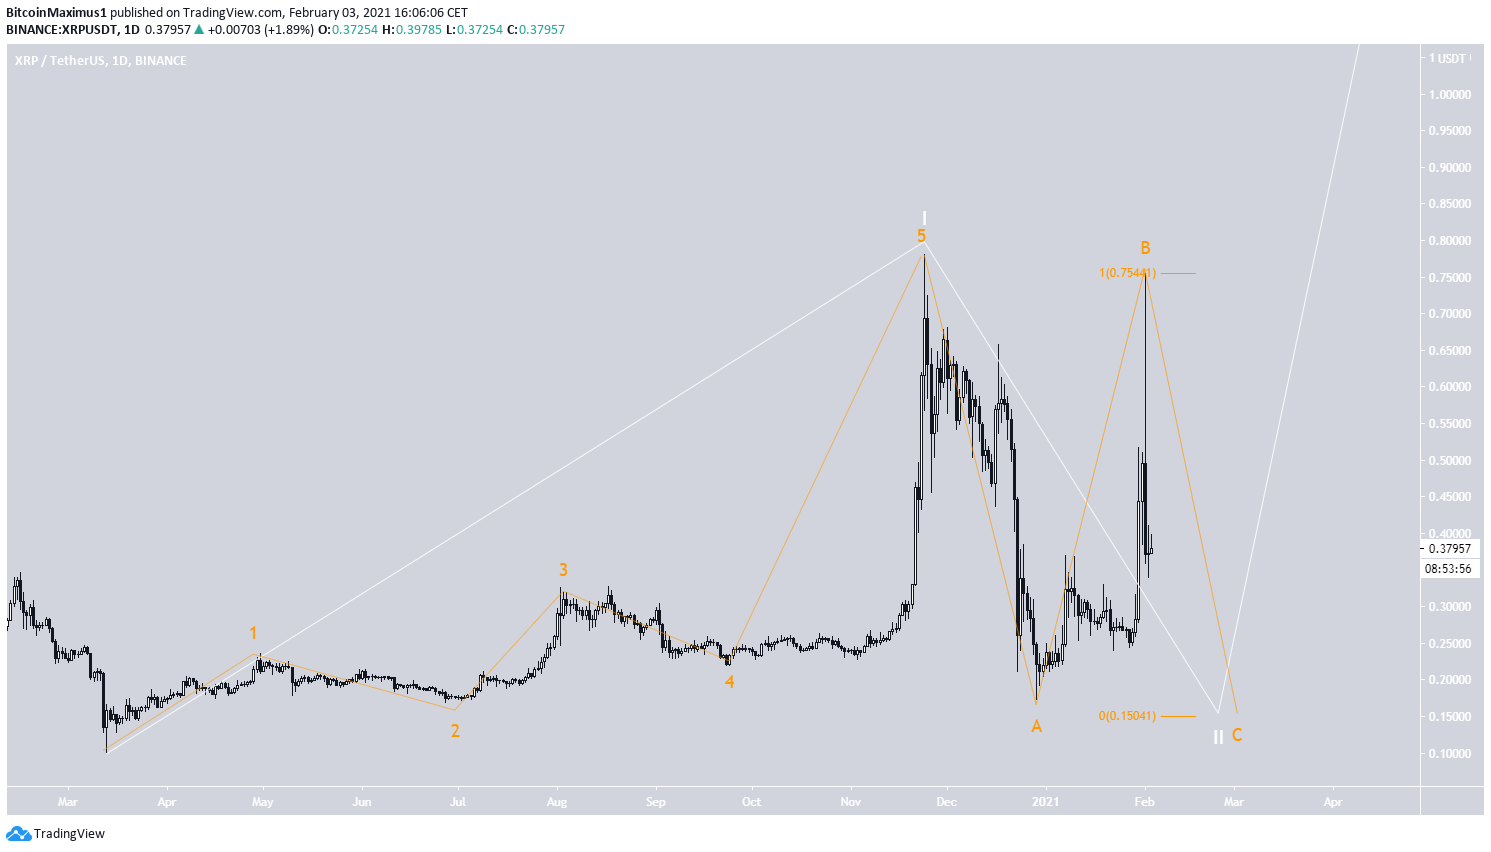
While the long-term count (white) is still bullish, it’s possible that XRP is in an A-B-C corrective structure (orange). It appears to currently be in the C wave.
If waves A:C have a 1:1 ratio, XRP would reach a low of $0.15 before moving higher.
We do not yet know if this is a running or irregular flat correction. Therefore, we cannot determine if the C wave will fall below the A wave.
XRP/BTC
The XRP/BTC chart shows that despite making a breakout attempt, XRP has fallen below the 1,550 satoshi resistance area.
Technical indicators are relatively neutral, similar to the USD pair.
Nevertheless, until XRP reclaims the 1,550 satoshi area, we can consider the trend bearish. 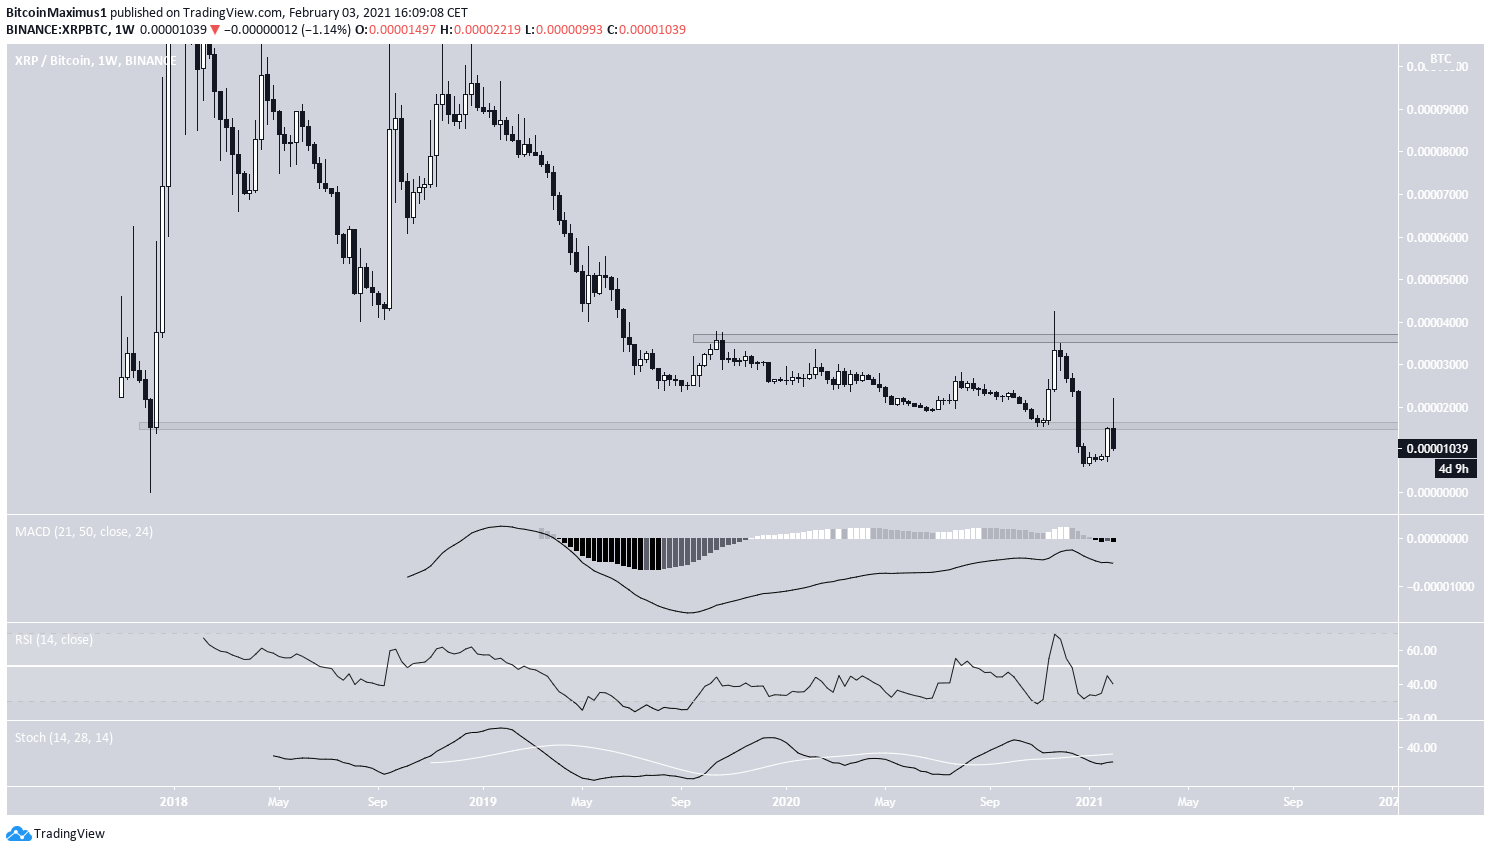
Conclusion
The direction of the XRP/USD trend is uncertain, but another drop back is the most likely scenario.
XRP/BTC is bearish until it manages to reclaim 1,550 satoshis.
For BeInCrypto’s latest Bitcoin (BTC) analysis, click here
