


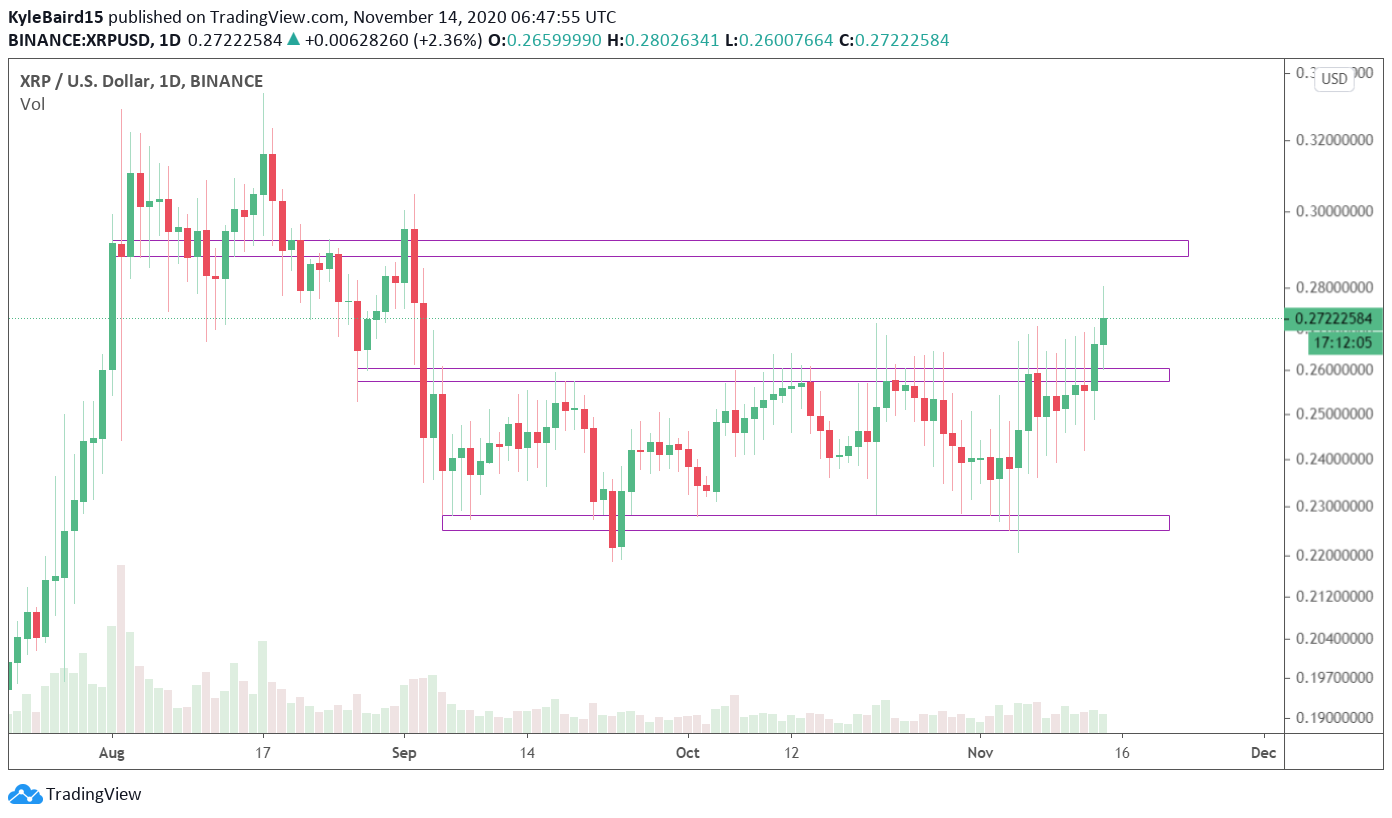
Since the beginning of September, XRP has been trading in a range of $0.23-$0.26 with the exception of a slight deviation below the support area on Sept 19.
Yesterday XRP finally closed a daily candle above this range at $0.265. It continued climbing in the early morning hours to reach $0.28 but has since pulled back to $0.272.
If XRP continues to rally, the next closest resistance area would be found at $0.295.
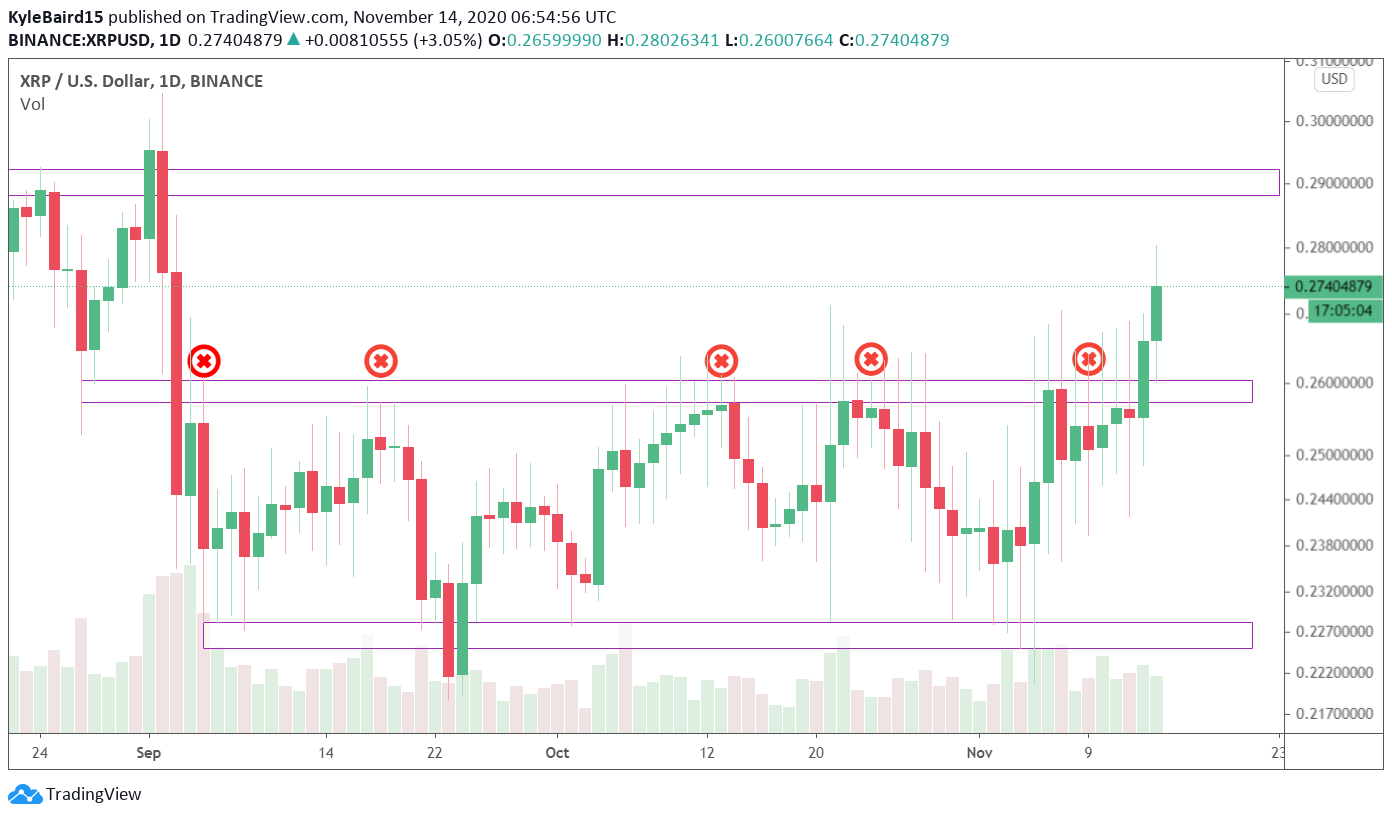
Technical indicators in the daily time-frame are bullish but do not yet confirm a bullish trend.
Both the RSI and MACD are increasing, the former being above 50 and the latter above 0. Their slopes are gradual and the Stochastic Oscillator has not yet made a bullish cross.
Another daily close above this resistance area would likely mean that XRP will continue moving up to $0.29.
Future Movement
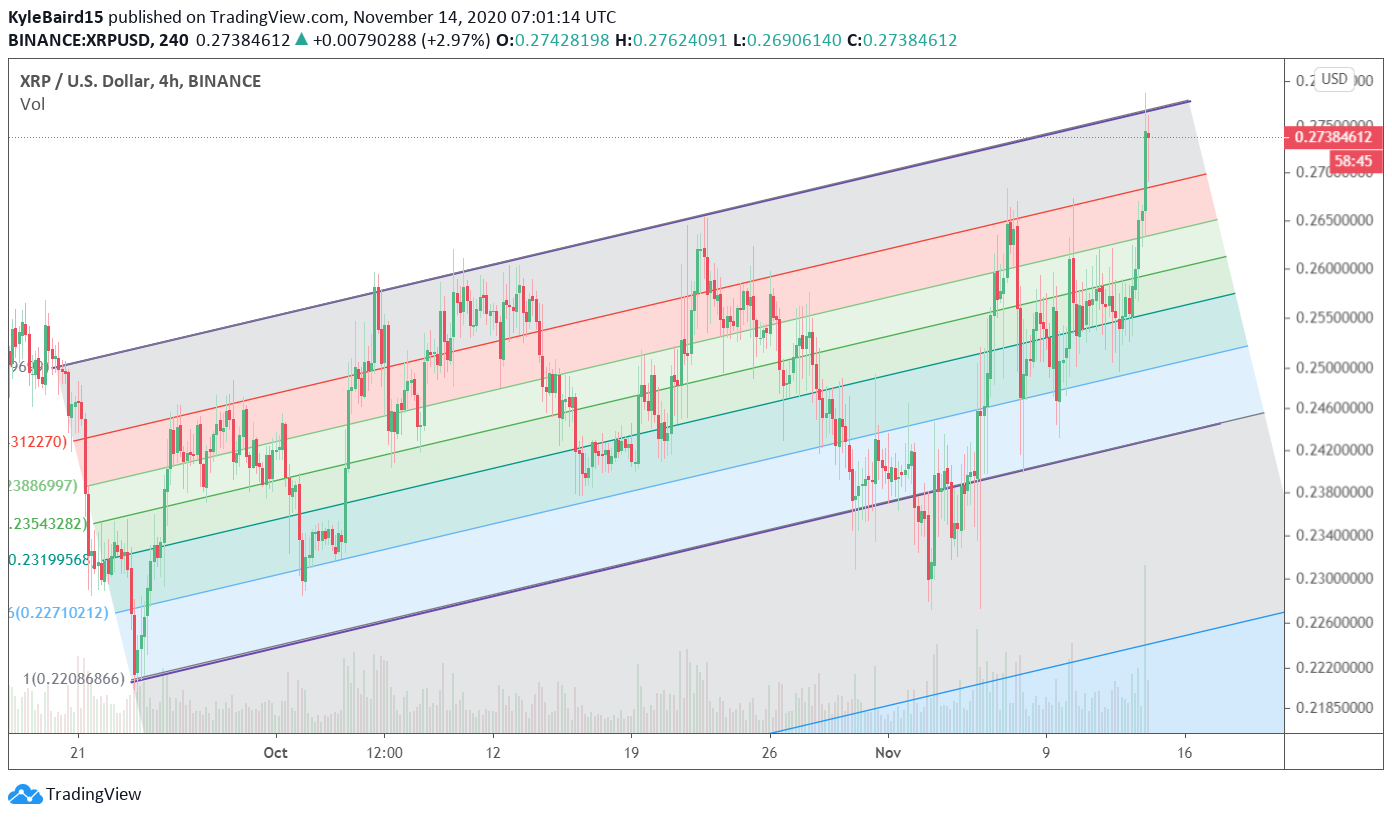
The shorter-term 4-hour chart shows that the price has been trading inside a parallel ascending channel since Sept 24.
Movement contained inside a parallel channel is often corrective, which could mean that the current increase is corrective rather than the beginning of an upward trend.
A breakout from the channel would invalidate this scenario and may take the price towards the previously mentioned $0.295 resistance area.
XRP/BTC
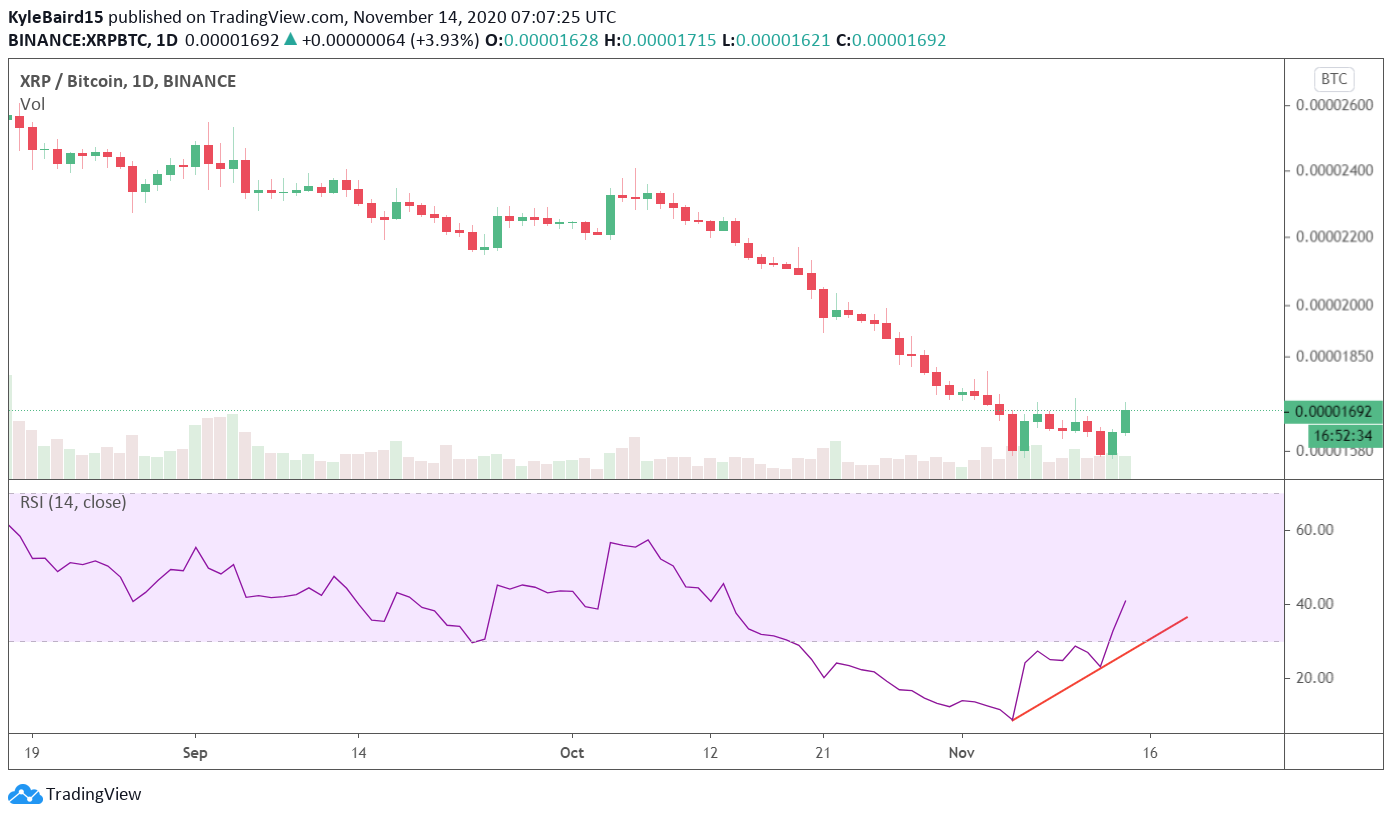
Cryptocurrency trader @gordongekko369 outlined an XRP/BTC chart, which shows the price in a downward trend. However, he predicts that the trend will soon reverse and XRP/BTC will begin to move upwards.
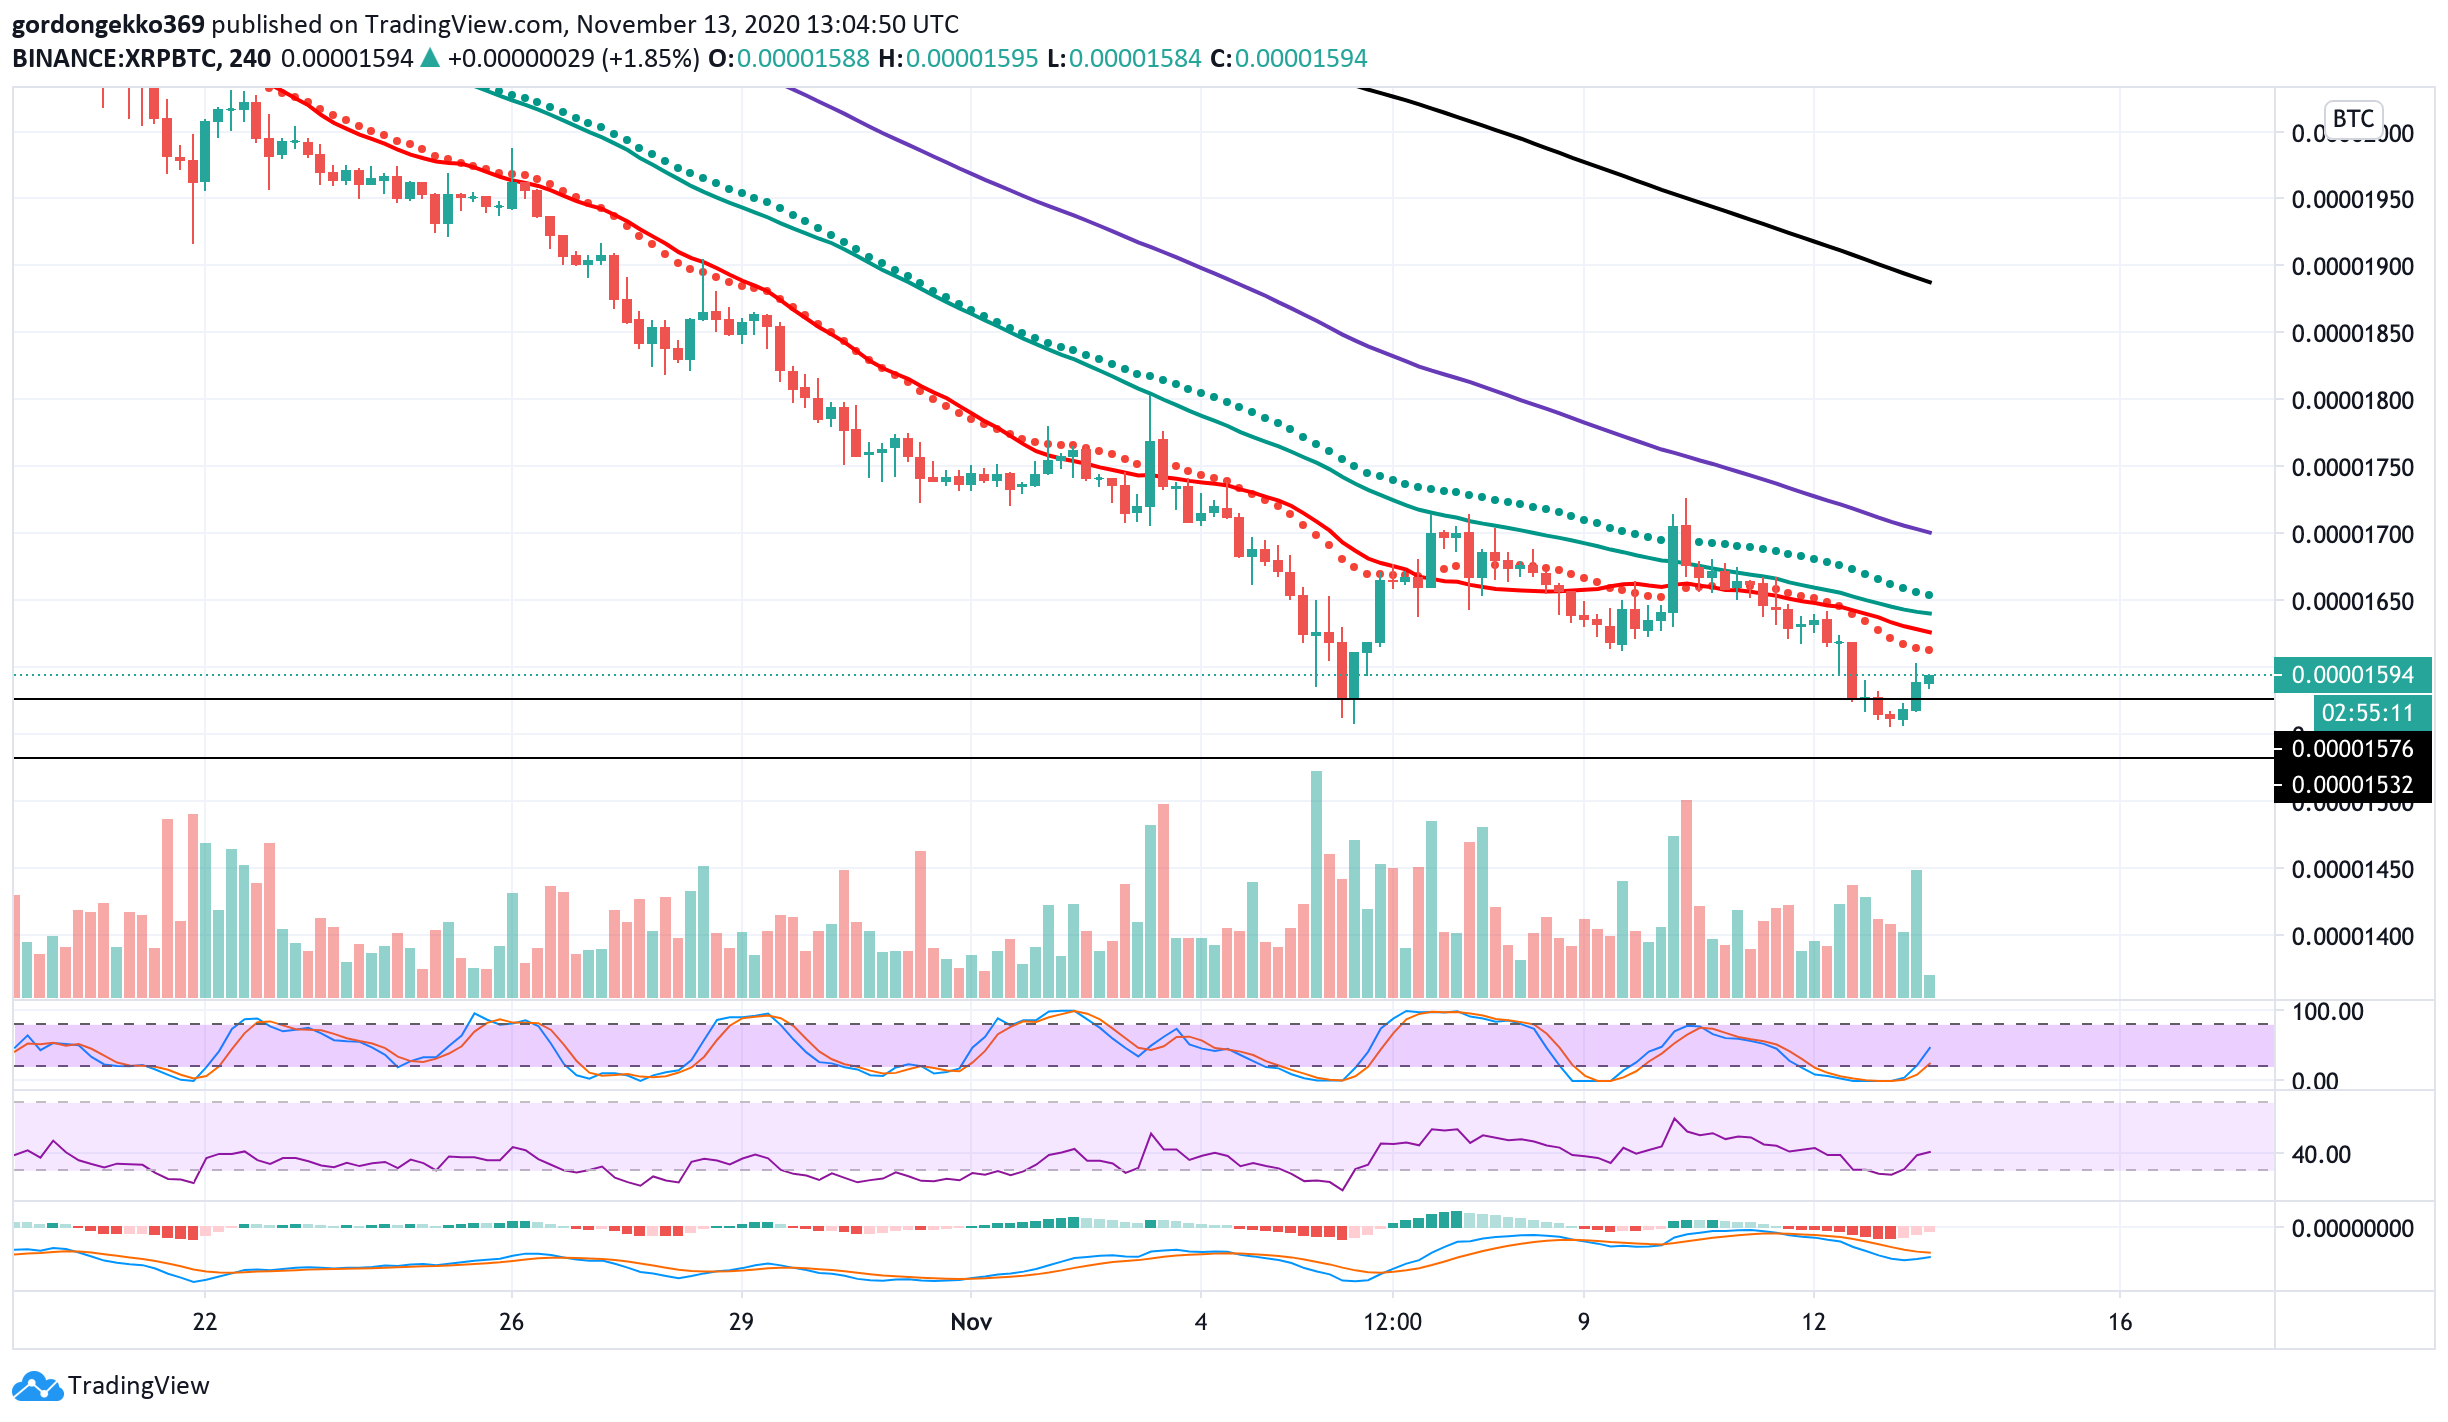
The XRP/BTC chart shows a rapid decrease that has been going on since the beginning of October, during which the price has lost nearly 30% of its value.
The decrease has temporarily halted and XRPBTC has created a double bottom near 1,565 satoshis. This is normally considered a bullish reversal pattern. Furthermore, the pattern is combined with a bullish divergence in the RSI, making it more likely that the price will reverse.
If so, the closest resistance area would be found between 1,880-1,980 satoshis.
However, the lack of horizontal support makes it more difficult to confidently predict a reversal.
For BeInCrypto’s latest Bitcoin analysis, click here!
Disclaimer: Cryptocurrency trading carries a high level of risk and may not be suitable for all investors. The views expressed in this article do not reflect those of BeInCrypto


