![XMR Has Reached a Make-Or-Break Support Area [Premium Analysis]](/_mfes/post/_next/image/?url=https%3A%2F%2Fassets.beincrypto.com%2Fimg%2FRIdbVRB5Br7iLEzgbQ4cOFHK-9I%3D%2Fsmart%2F026ec7170d954f6381ff3baca77bcc55&w=1920&q=75)
The Monero (XMR) price has been correcting since April 2018. It has reached the penultimate support area at ₿0.06 — a breakdown below which would likely take it to ₿0.004.
In the period from November-December 12, the Monero price made several attempts at initiating an upward move and breaking out above previous resistance. However, they were all unsuccessful, causing the price to decrease and the bullish outlook to dissipate.
Full-time crypto trader @cryptodonalt stated that the XMR price is in a downtrend and has not yet shown signs of a reversal. Therefore, the prudent move would be to wait until the price does so before attempting to trade the coin.
$XMR update:
This is a clear lesson in patience.
You like the coin? Wait for signs of reversal.
Little reason to buy it in an obvious downtrend while it's slow bleeding.I've been waiting for more than a year and I'll gladly wait for another if I have to. pic.twitter.com/rCjgR9TwJc
— DonAlt (@CryptoDonAlt) December 21, 2019
Will XMR show any signs of a reversal? Has it already done so? Keep reading below in order to find out.
Long-Term Outlook
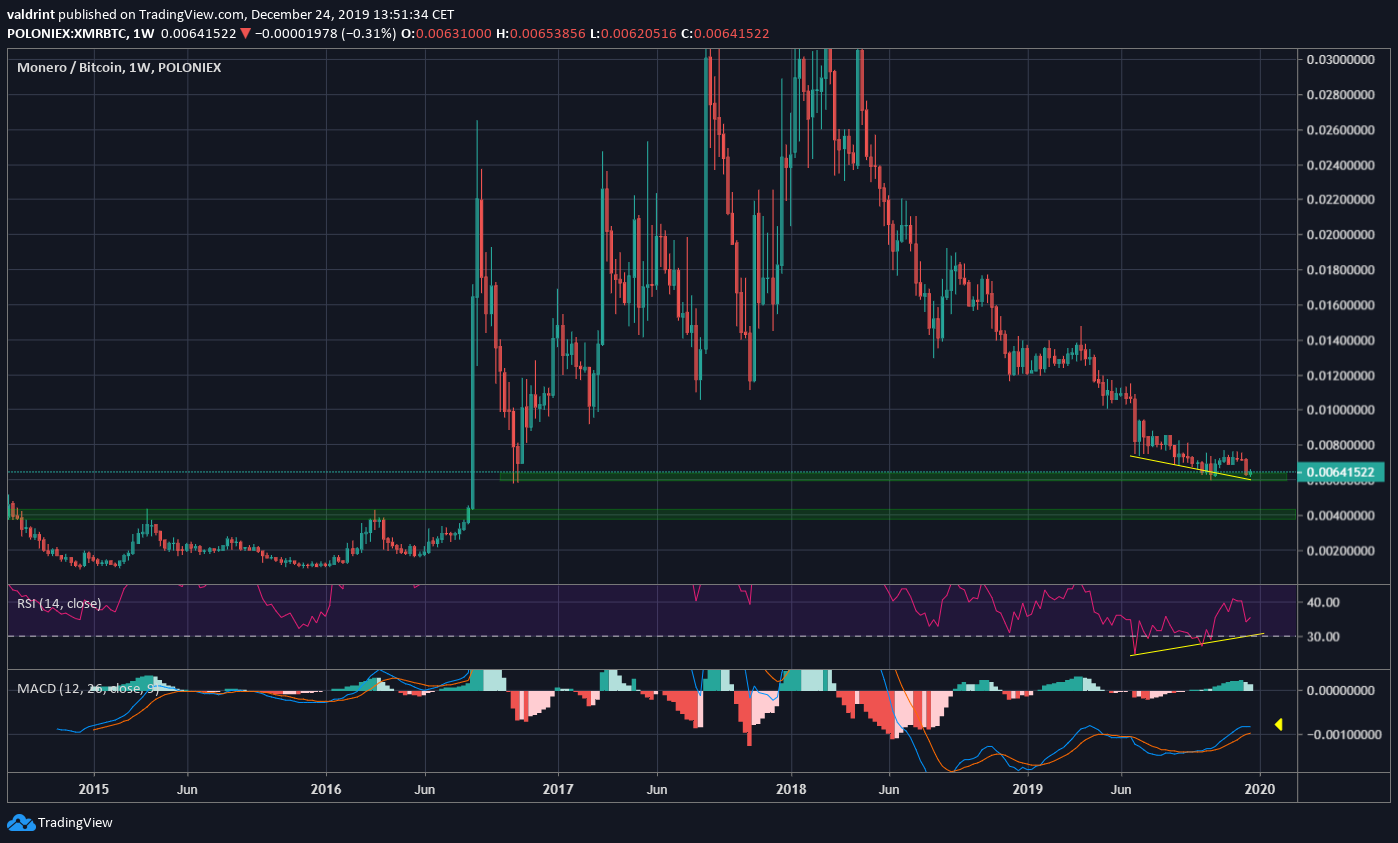
A look at the all-time Monero chart reveals that the price has been decreasing since April 2018.
There are support areas at ₿0.006 and ₿0.004. The XMR price is currently trading inside the former. The latter acted as resistance until June 2016, when the price broke out. The price has not revisited it since.
There are several reversal signs in development.
- The June 24-30 week had the lowest weekly RSI value ever recorded at 23.
- The weekly RSI has generated a very strong bullish divergence.
- The MACD has also generated bullish divergence and is in the process of moving above the 0 lines, which it has not done since May 2018.
Triple Top
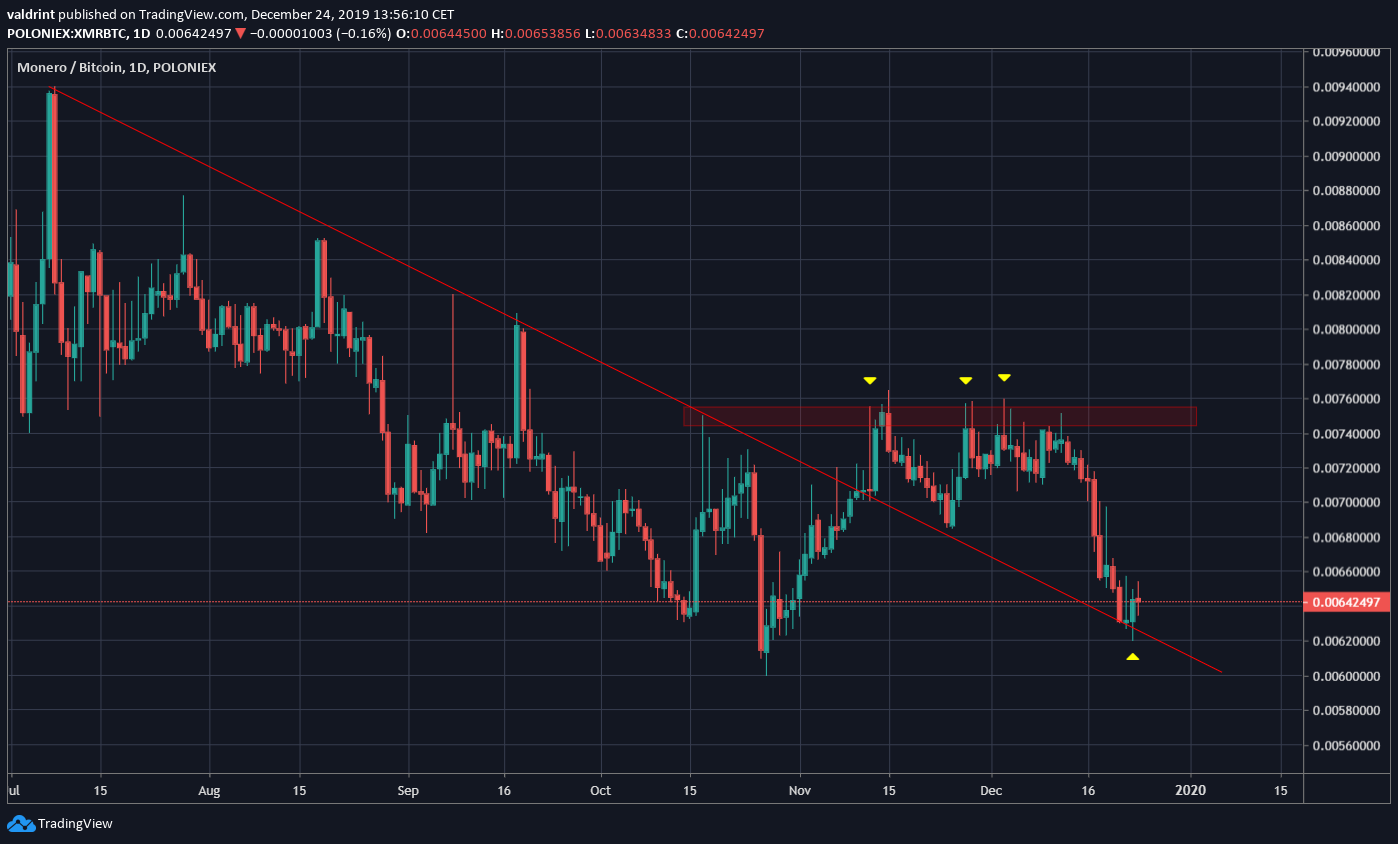
The Monero price was following a descending resistance line since July 8. The price broke out from this line on November 13 but struggled to break out above the resistance area at ₿0.0074.
Inside the area, it made a triple top and decreased in order to validate the previous resistance line.
This is a common movement after breakouts, even if the retrace was uncommonly deep. Also, the current low possibly constitutes a double bottom relative to the October 27 low. However, there is no bullish divergence to support the creation of this pattern.
Future Movement
In the case of XMR, we will disagree with the tweet. While, as a rule, it is better to wait until a coin shows signs of a reversal, sometimes the risk to reward ratio (R:R) is exceptional enough to vindicate doing so. Besides, we believe XMR has shown some signs of a reversal, even if it has not yet confirmed an upward movement.
Therefore, placing a stop loss below the support area at ₿0.006 would allow for a quick exit of the trade if the price decreases, allowing for re-entry at the next support area at ₿0.004.
Additionally, even a retest of the minor resistance area at ₿0.074 would present us with a 3:1 R:R ratio, while the number jumps in double digits if the XMR price initiates a new market cycle.
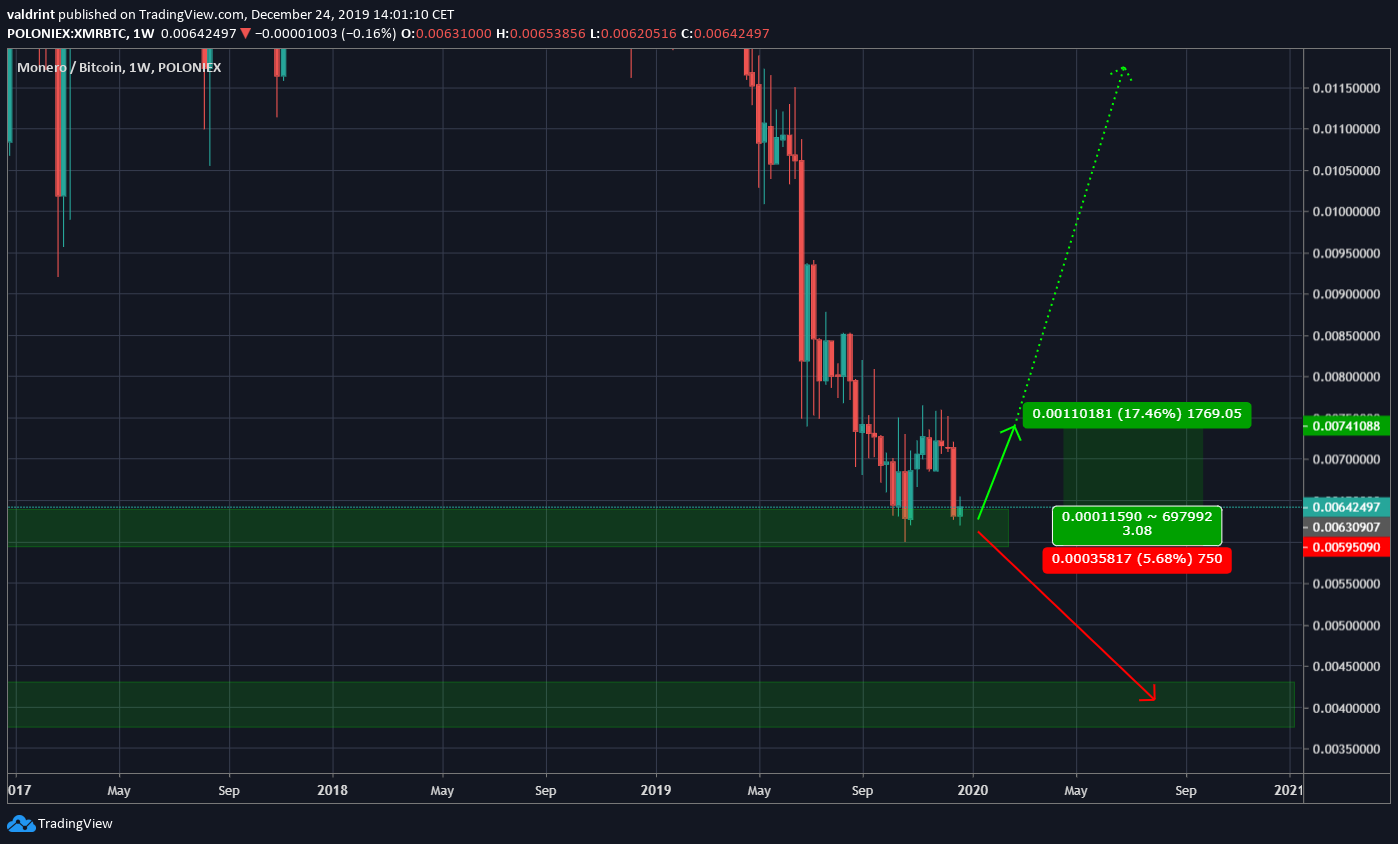
To conclude, the XMR price has reached a very significant support area and has shown some signs of a reversal, but has yet to confirm that it will begin a new bullish market cycle. A breakdown below ₿0.006 would invalidate the possibility of a bullish move.
