


The Stellar (XLM) price could accelerate its increase with a breakout from its short-term pattern.
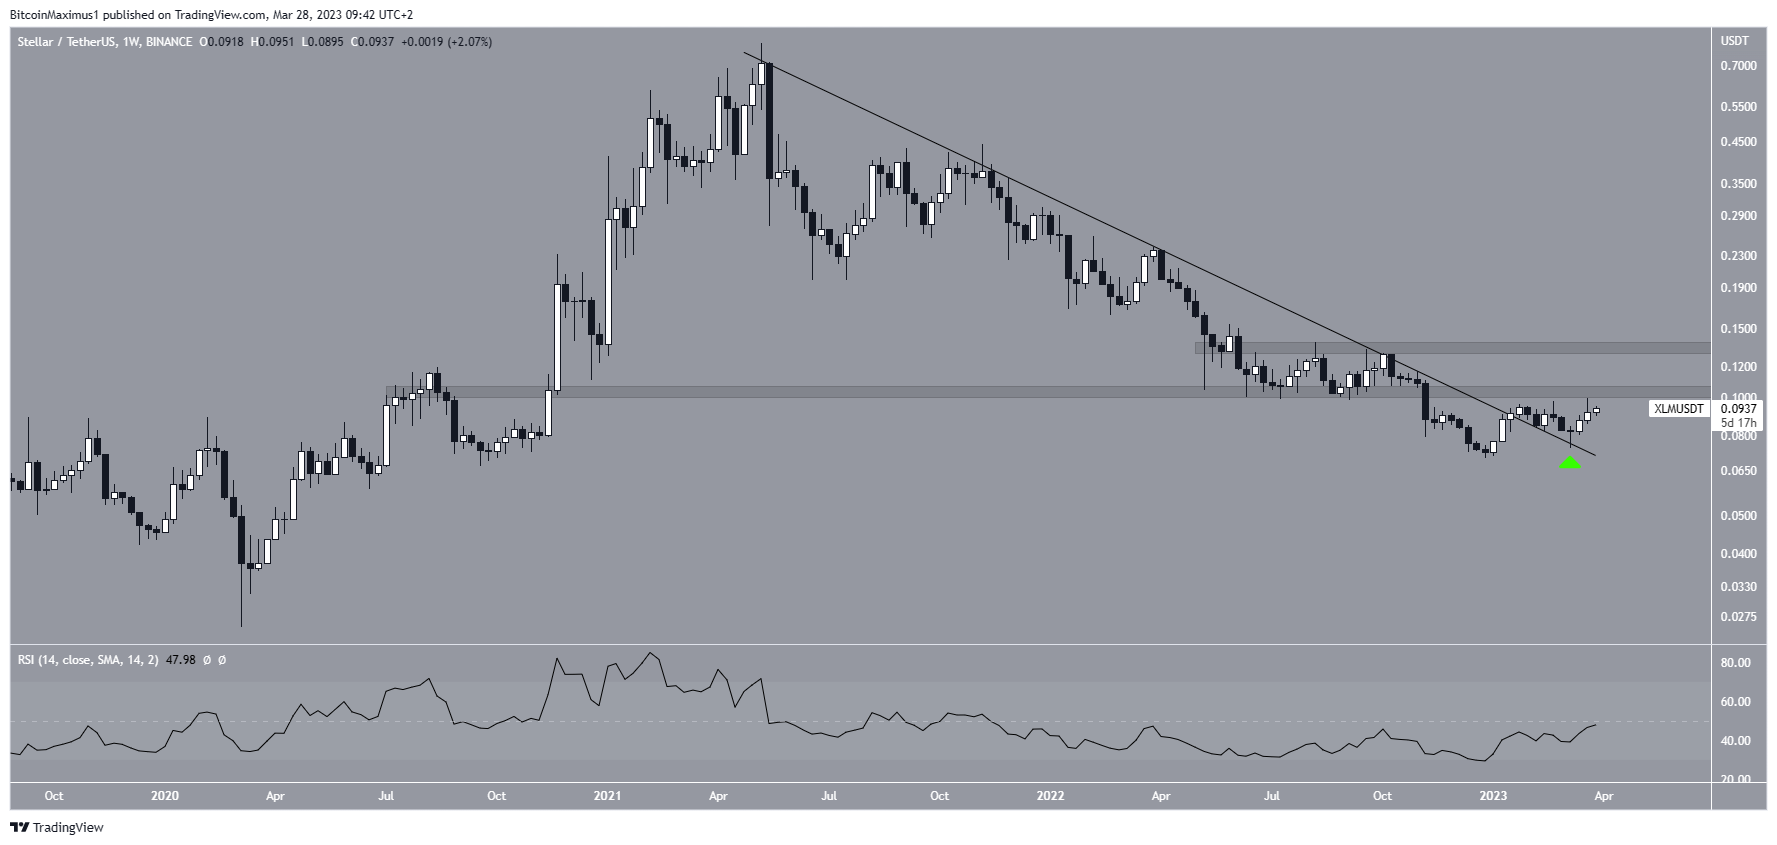
The Stellar price has increased since December 2022. In January 2023, it broke out from a descending resistance line that had been in place since the all-time high. Then, it returned and validated the line as support (green icon) on March 2023.
Afterward, XLM began another upward movement. However, it has yet to break out from the $0.105 long-term resistance area. Moreover, the weekly RSI failed to break out above 50. Both these are required in order for the price to confirm its long-term bullish reversal.
If a breakout occurs, the next resistance would be at $0.135, a level that hasn’t been reached since September 2022. However, if XLM gets rejected again, it could fall toward the resistance line, which is now close to $0.060.
Will Stellar (XLM) Price Break out?
The technical analysis from the daily time frame provides a more decisively bullish outlook. The price has made numerous attempts at breaking out from the $0.095 resistance area. It initially moved above it on March 21 but fell back below in the next 24 hours.
The Stellar lumens price could also be trading inside an ascending triangle since the lowest price of the year on Jan. 2. Since areas get weaker once they are touched several times and ascending triangles are considered bullish patterns, an eventual breakout seems likely.
Furthermore, the daily RSI has broken out from its bearish divergence trend line and is trading above 50. If the price breaks out, it will likely increase to the $0.135 resistance area.
However, if a rejection follows, the crypto asset could return to the ascending support line again. This would not invalidate the bullish structure, but it would delay the breakout considerably.
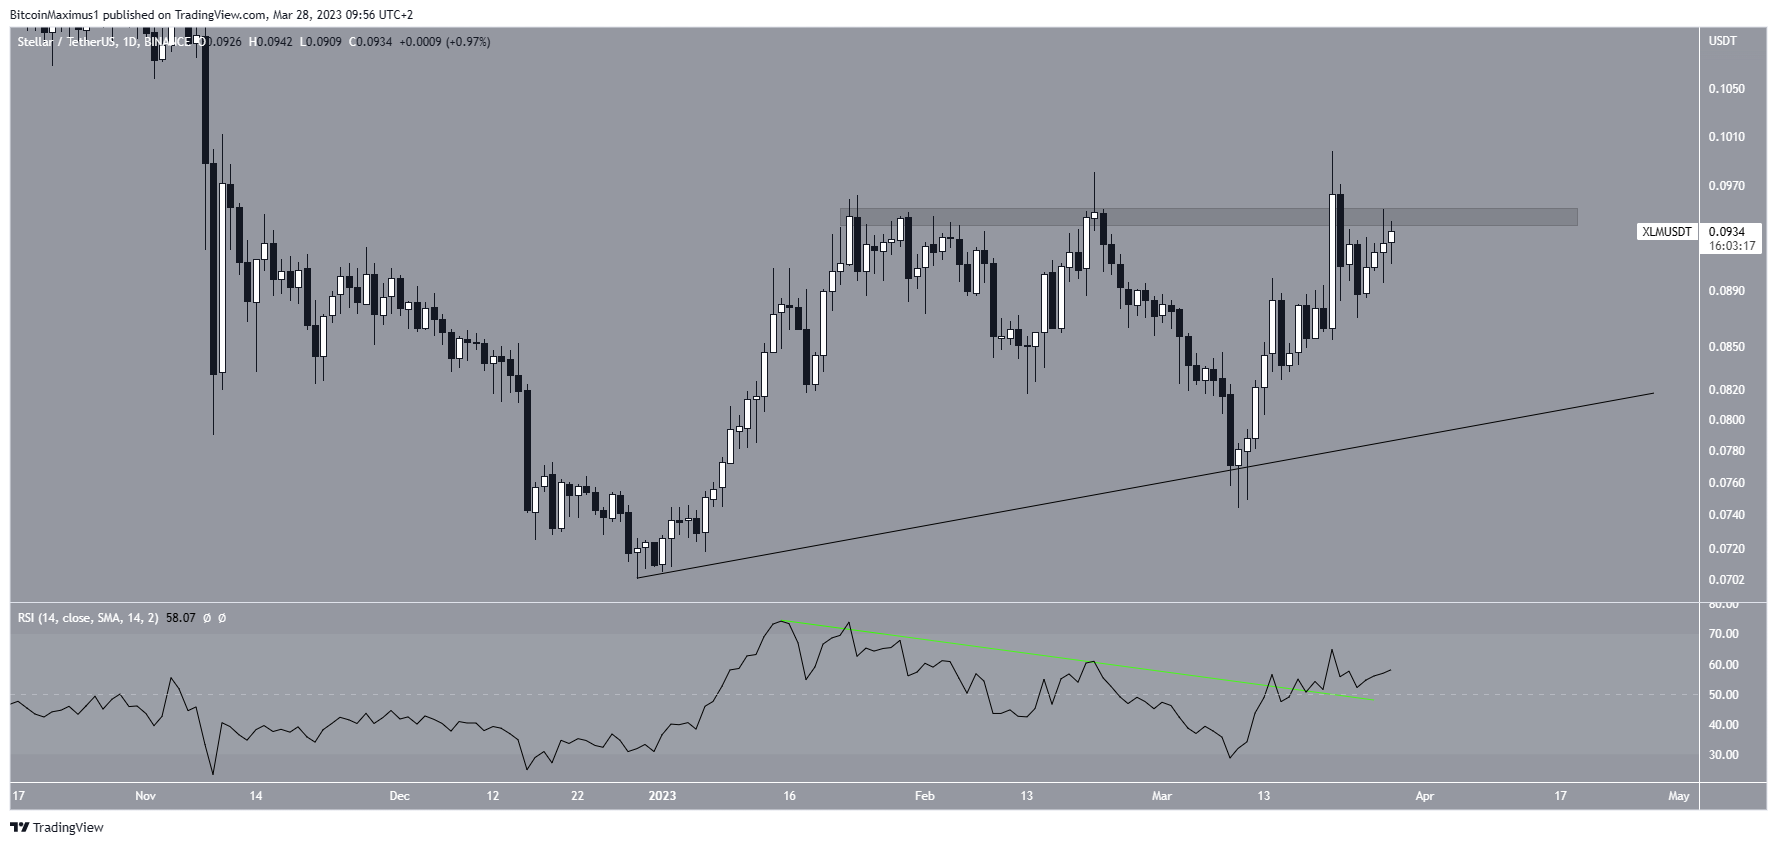
To conclude, the most likely Stellar price forecast is a breakout from the $0.095 resistance area and an increase to $0.135. However, if another rejection occurs, XLM could fall to the ascending support line at $0.082.


