
On March 18, 2019, the XLM price reached a high of 2975 satoshis. A rapid decrease ensued shortly after, which — at the time of writing — is still ongoing.
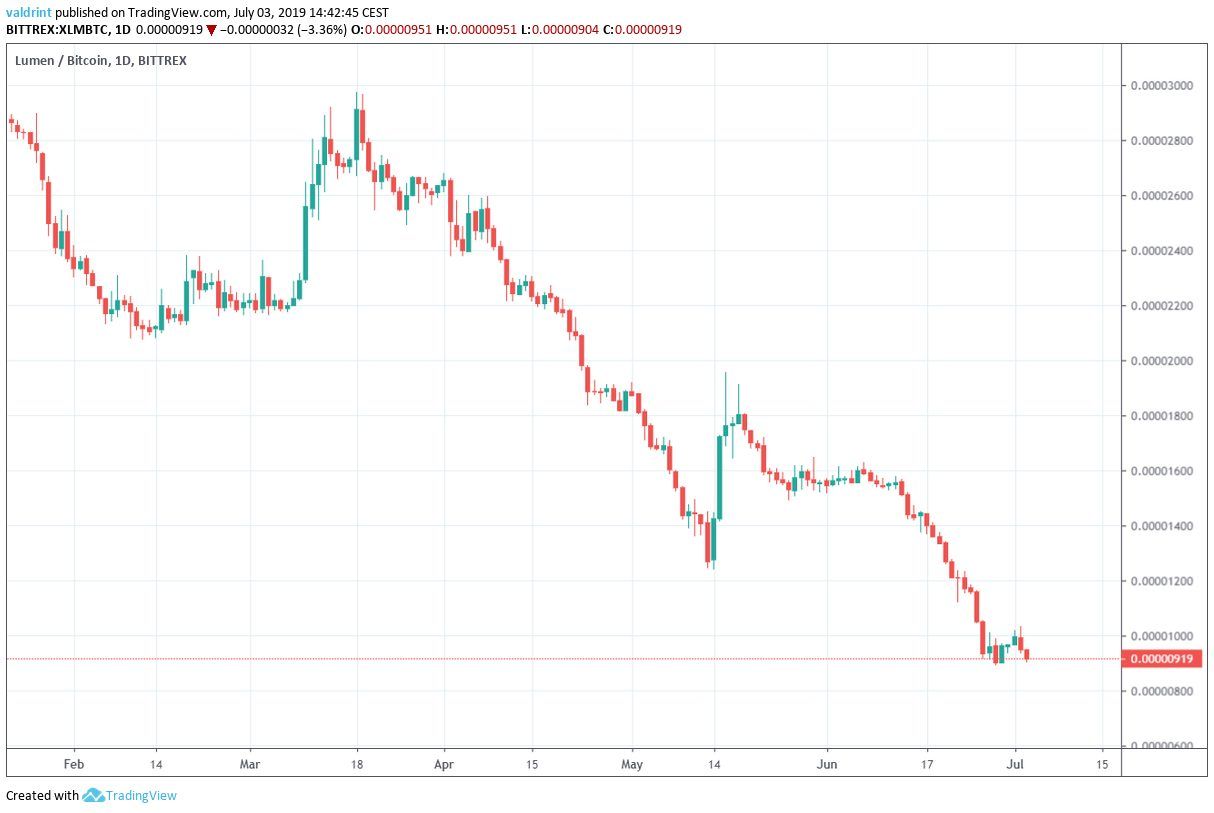
Currently, XLM is trading slightly above 900 satoshis.
Will it continue to decrease or is there a reversal in store? Keep reading below in order to find out.
If you are interested in trading Bitcoin (BTC), Ethereum (ETH), Litecoin (LTC), Bitcoin Cash (BCH), and XRP on our partner exchange, follow this link to get set up on XCOEX.
XLM Price: Trends and Highlights for June 3
- XLM/BTC is trading inside a descending wedge.
- There is bullish divergence developing in the RSI and the MACD.
- Daily moving averages have made a bearish cross.
- The price is potentially trading inside a short-term ascending triangle.
XLM Price in a Descending Wedge
Since reaching the aforementioned high on March 18, the price of XLM has been trading inside the descending wedge outlined below:
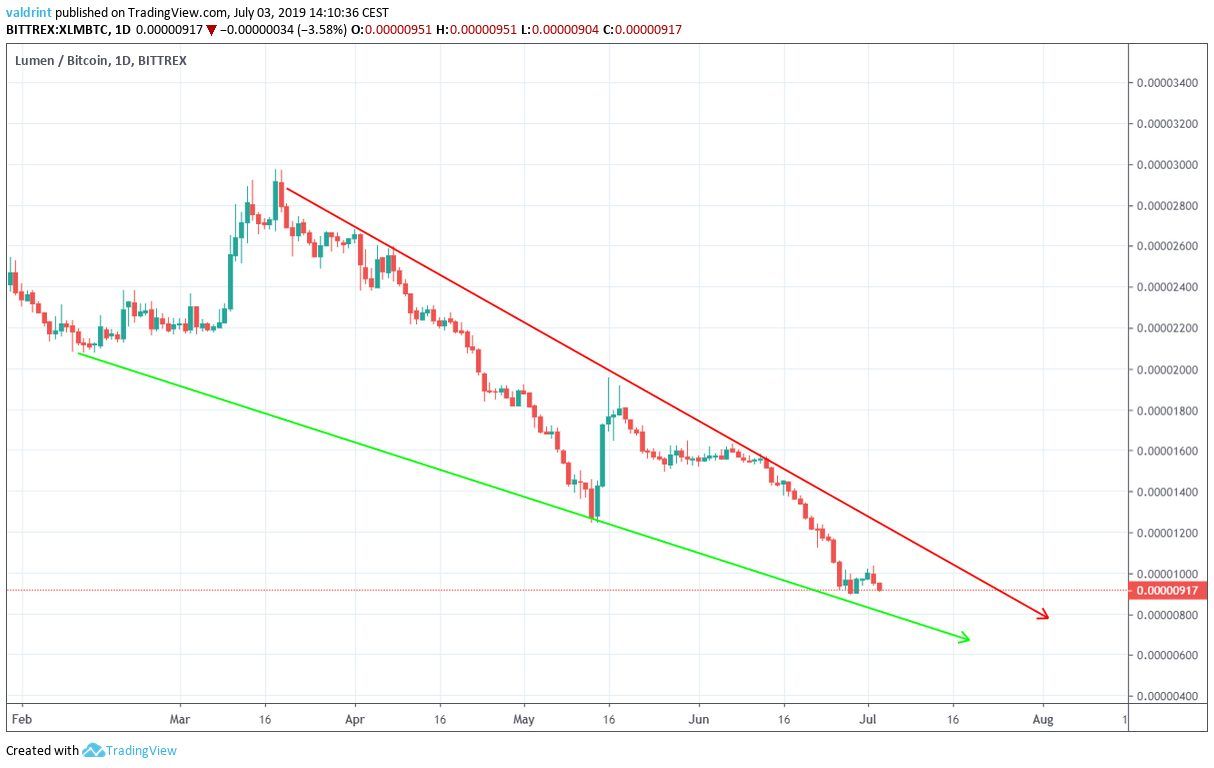
The descending wedge is considered a bullish pattern, making a price breakout more likely.
At the time of writing, the XLM price was trading very close to the support line, after several unsuccessful attempts at a breakout throughout the end of May and beginning of June.
Next, we will take a look at some technical indicators in order to predict whether the next attempt will be successful.
Is a Breakout Approaching?
The previous two dates in which the support line of the wedge was touched were May 14 and June 30.
Since the support line is descending, these two values were lower lows.
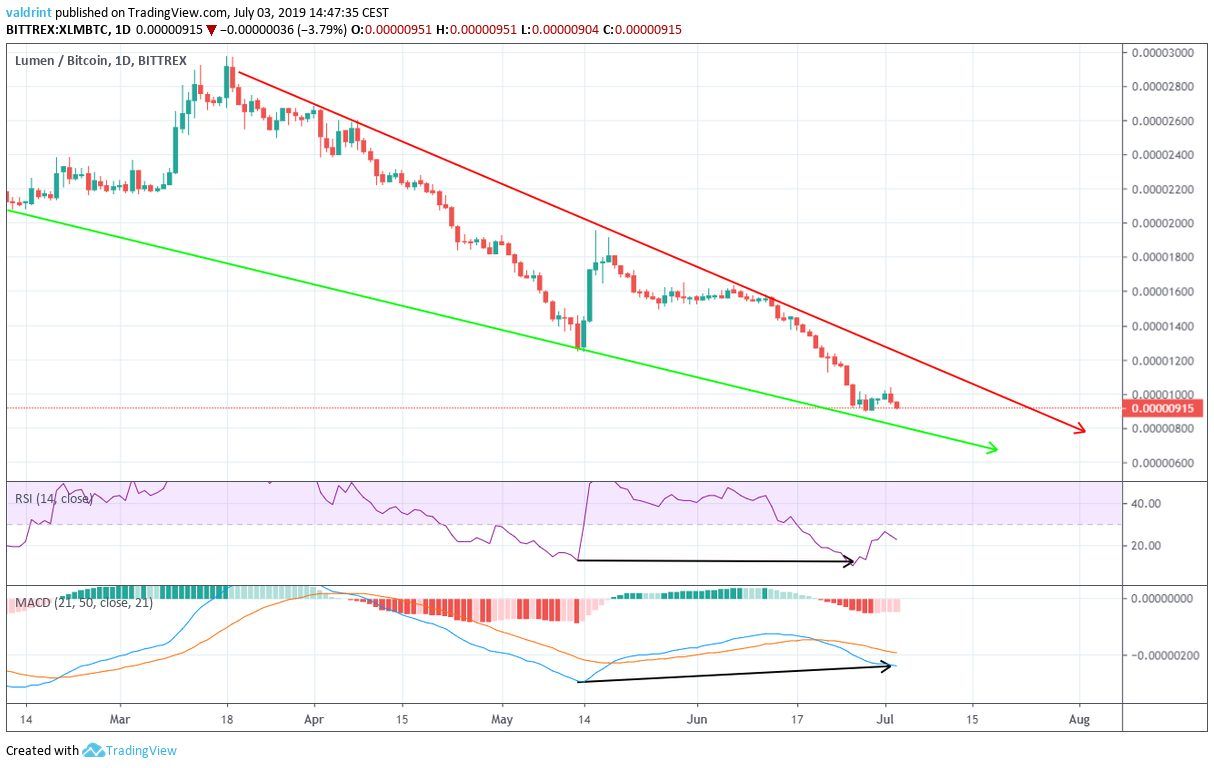
During the same period, however, both the RSI and the MACD have generated higher values.
This is known as bullish divergence and often precedes price increases.
The divergence is not very significant in the RSI.
However, the fact that it is occurring in both indicators and inside a bullish pattern reaffirms its significance.
On the other hand, the moving averages indicate that the price is in a downtrend.
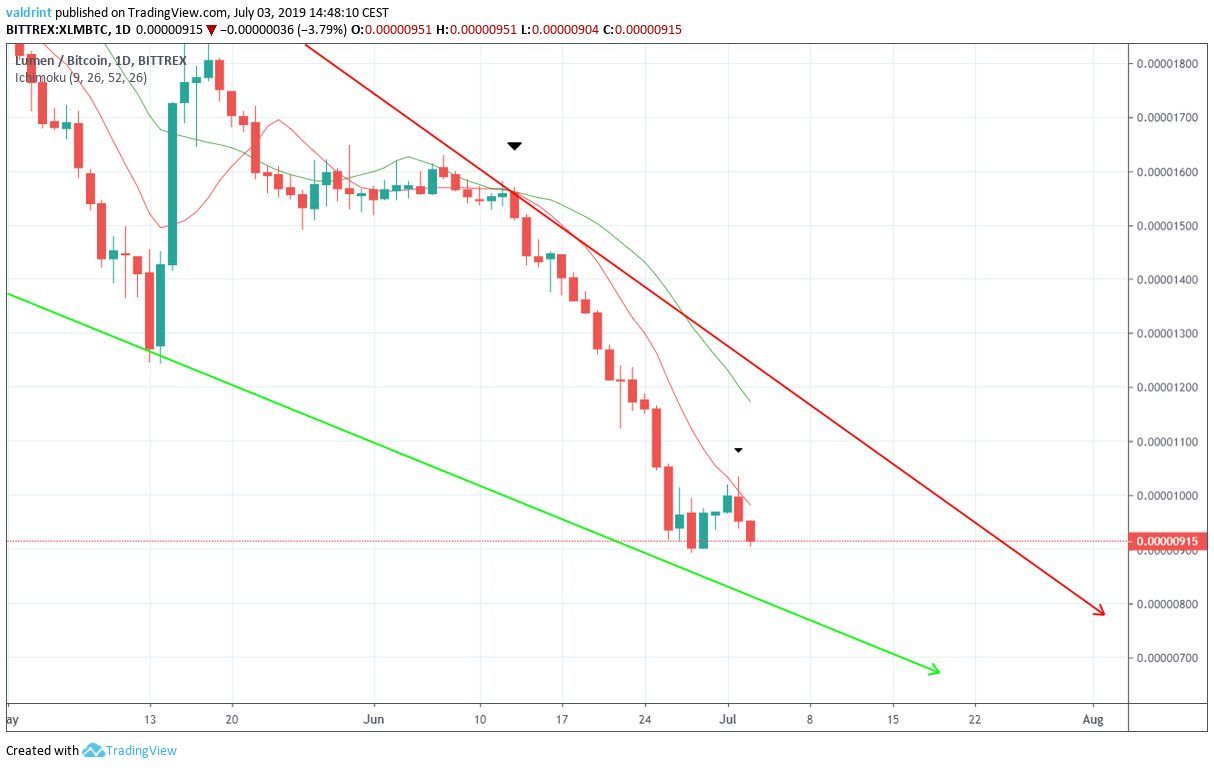
The 10- and 20-day MAs made a bearish cross on June 12.
Since MAs are lagging indicators, this is to be expected. A reversal would have to already be underway for them to turn bullish.
According to the RSI and the MACD, a reversal will eventually occur, at the latest at the point of convergence between support and resistance.
Short-Term
In the short term, we can see that the most recent upward move was stopped in its tracks at the 0.382 fib level of the previous downward move.
A resistance line is created at that level.
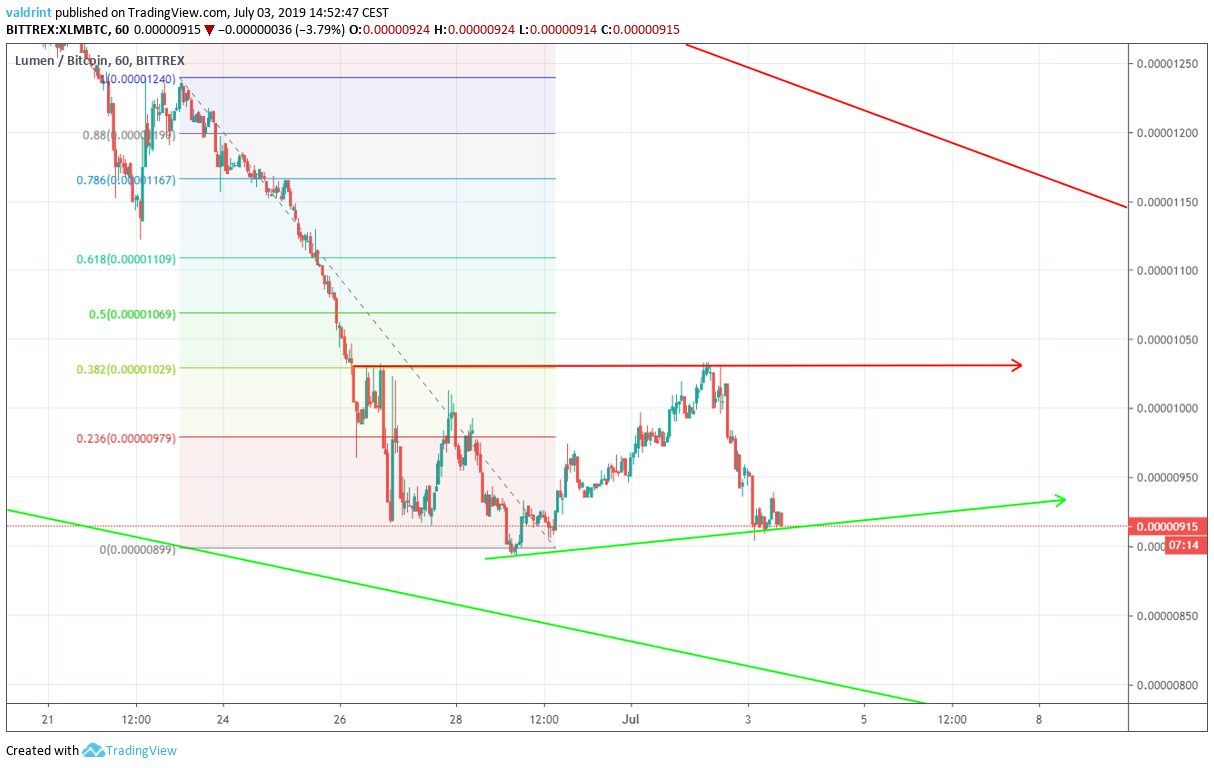
If the XLM price continues its trend of creating higher lows, it will create an ascending support line, which combined with the resistance creates an ascending triangle.
Since the triangle is a bullish pattern, it would reaffirm our hypothesis from the previous section.
Summary
The price of XLM has been trading inside a descending wedge since Mar 18.
While it is not currently in a significant support area, technical indicators support a breakout from this pattern.
In the short-term, it is potentially trading inside an ascending triangle.
Do you think the price of XLM will break out from the wedge? Let us know in the comments below.
Disclaimer: This article is not trading advice and should not be construed as such. Always consult a trained financial professional before investing in cryptocurrencies, as the market is particularly volatile.
Images are courtesy of Shutterstock, TradingView.
