
On August 11, 14, and 25, 2019, the XLM price created a triple top with almost identical highs of 705 satoshis. A rapid decrease followed. On September 6, the XLM price reached a low of 554 satoshis. It has been increasing since.
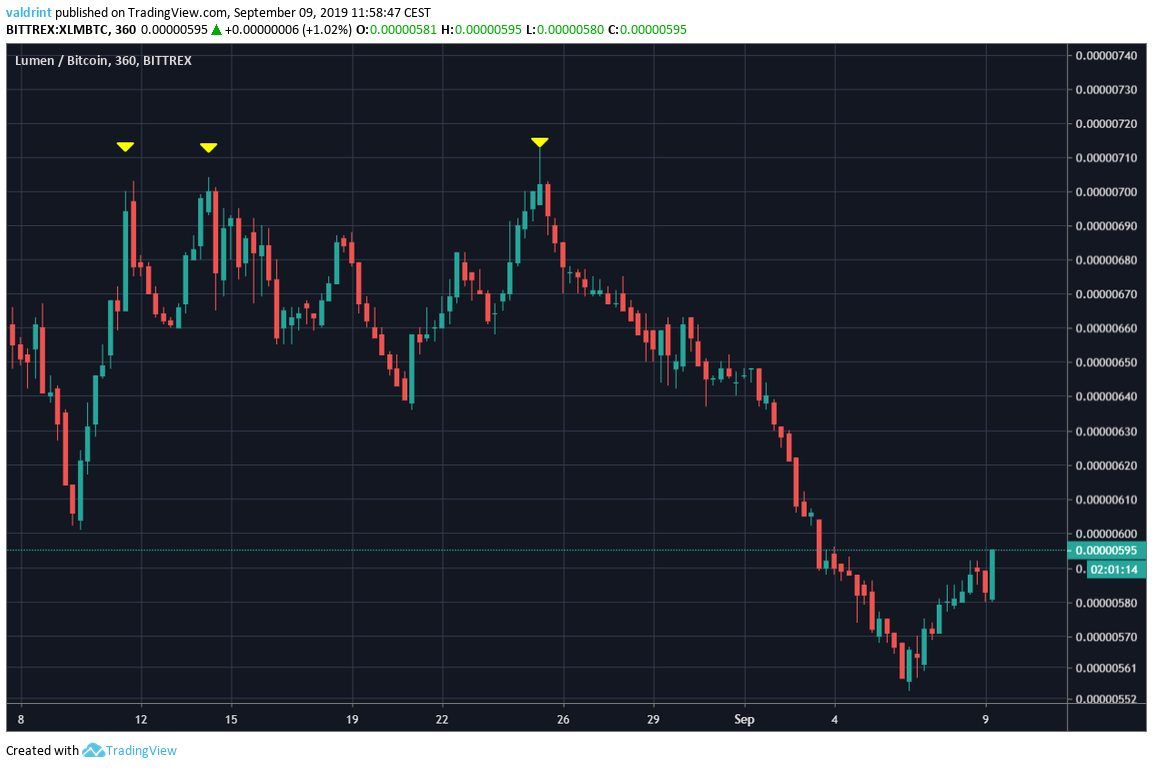
Will XLM initiate a reversal or are further decreases in store? Continue reading below if you are interested in finding out.
For our previous analysis, click here.
Stellar Price: Trends and Highlights for September 9
- XLM/BTC has previously made a triple top.
- It is possibly trading inside a descending channel.
- The bullish divergence has been developing in the daily RSI & MACD.
- The price is facing resistance from the daily moving averages.
- There is resistance at 600 satoshis.
Descending Channel
Looking at the daily time-frame, we can see that the price is possibly trading inside a descending channel.
The period discussed in the introduction is outlined below:
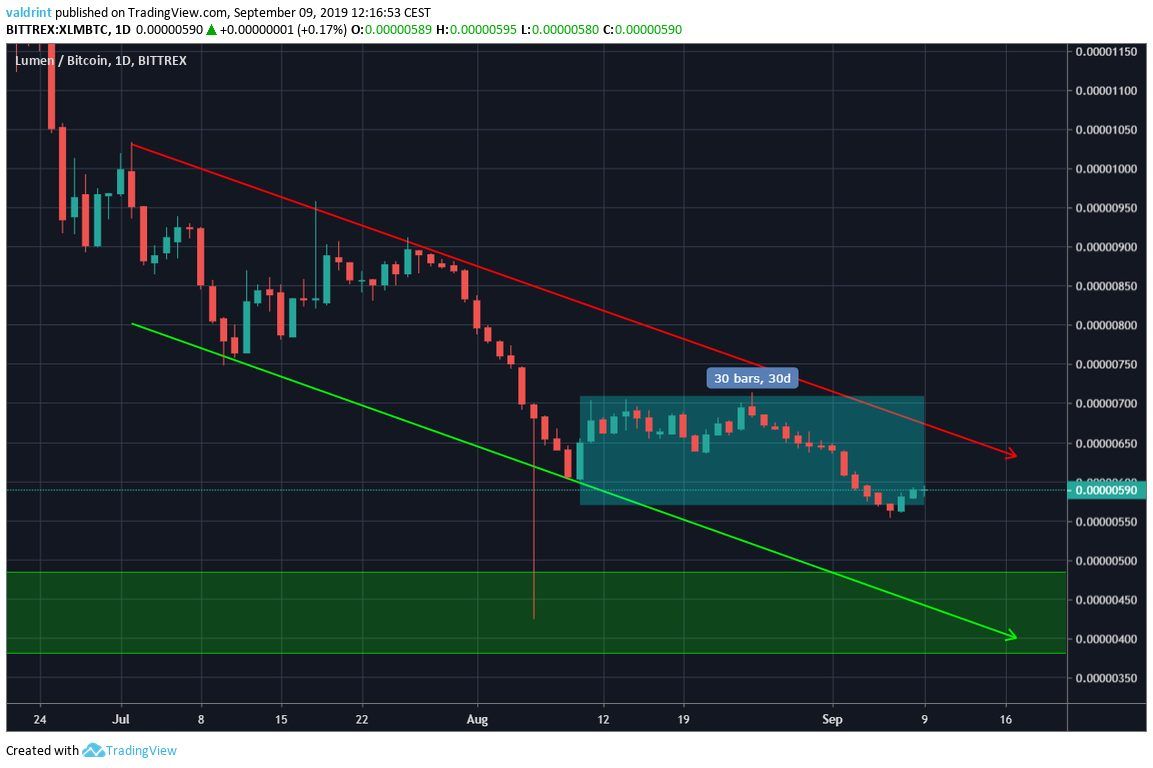
The reason for not being entirely sure on the type of pattern is that the support line has only been validated twice.
Therefore, it is possible that the price will follow a slightly differently sloped support line.
If the price were to continue decreasing at the rate predicted by this channel, it would reach the long-term support area of 4000 satoshis by the end of September.
Technical Indicators
A look at the RSI & MACD shows that both have been generating bullish divergence almost during the entirety of the descending channel.
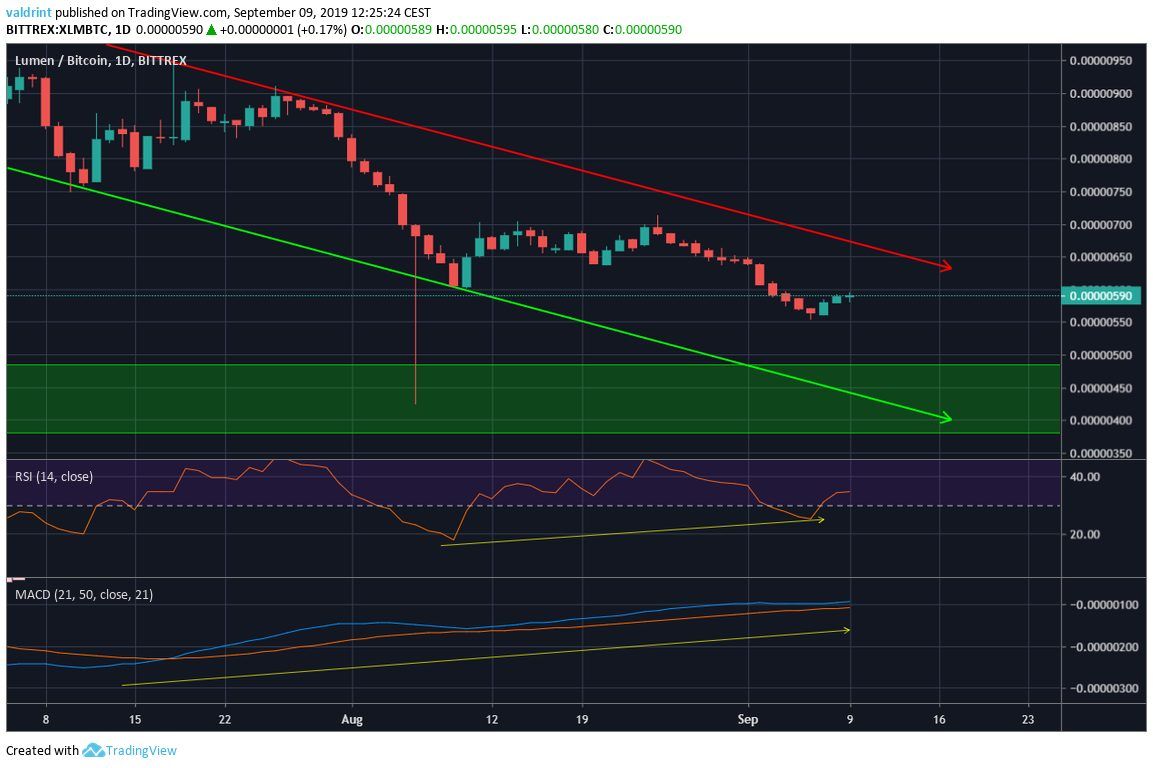
However, when we incorporate the daily moving averages (MA) in the analysis, we can see that there is still significant resistance left for the price to clear.
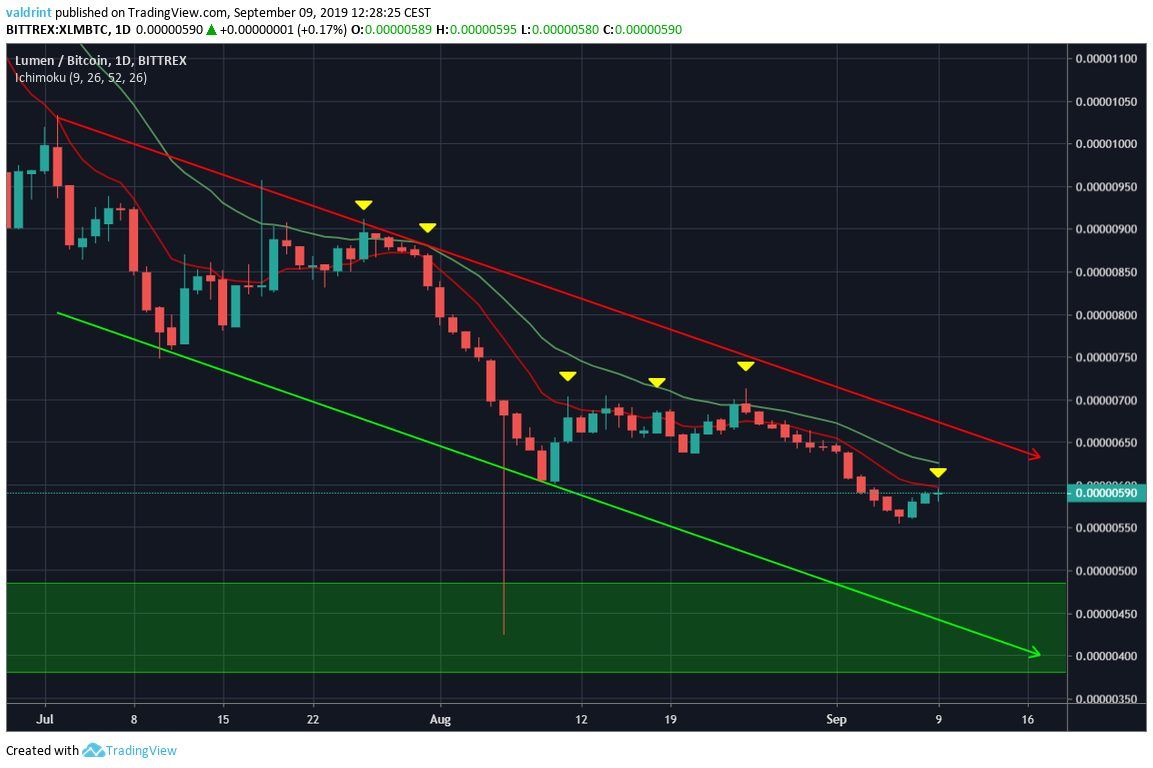
XLM is trading right on line with 10-day MA and is still below the 20-day one.
The MAs have previously made a bearish cross.
During this descending channel, every time the price has reached the MAs, it has begun downward moves of varying magnitudes.
Therefore, we believe that XLM will act similarly and reach the support line of the channel, which coincides with the long-term support area.
Short-Term Movement
To try and predict short-term movement, we will use the two-hour time-frame.
One resistance area is outlined below
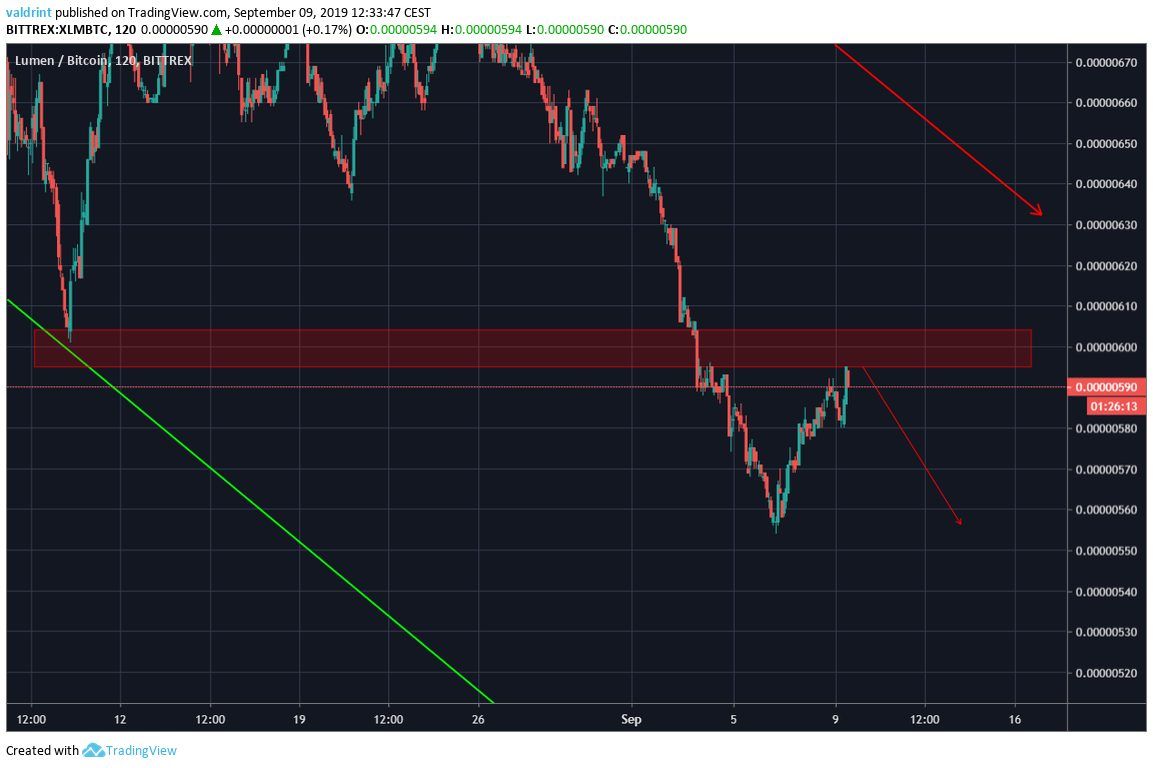
The XLM price has almost reached this area, which is found at 600 satoshis.
Once it reaches it, it is likely to decrease towards 550 satoshis.
There, it could either make a double bottom and reverse, beginning an upward move, or continue the decrease towards the support line.
We believe that a decrease is more likely.
XLM Price Summary
The XLM price is trading inside a descending channel.
According to our analysis, it is likely to decrease until it reached values near 4000 satoshis.
For trading purposes, due to the position of the price in the middle of the channel, we would not recommend initiating either a long or a short trade.
Do you think the XLM decrease and reach the support area? Let us know in the comments below.
Disclaimer: This article is not trading advice and should not be construed as such. Always consult a trained financial professional before investing in cryptocurrencies, as the market is particularly volatile.
Images are courtesy of Shutterstock, TradingView.
