


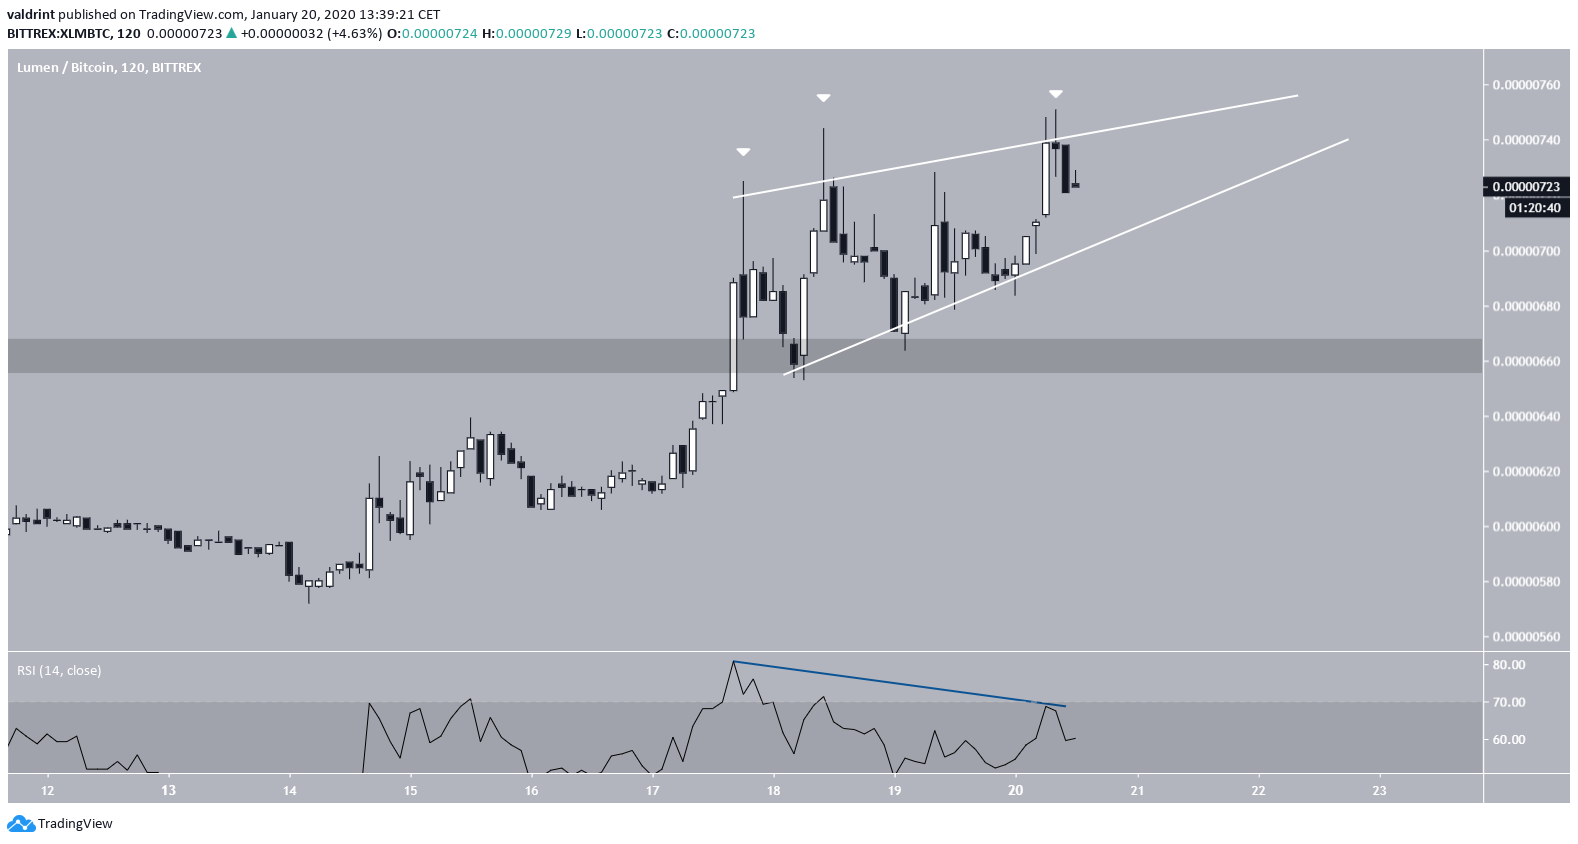
On January 14, the XLM price reached a low of 572 satoshis. It has been increasing since, reaching a high of 751 satoshis on January 19.
However, the rally seems to have stalled. The bearish short-term pattern suggests that the XLM price is likely to revisit its breakout level at 660 satoshis before resuming the current upward movement.
Trader @CryptoMichNL outlined a price movement which he believes is present in numerous altcoins. The price has broken out, initiated a significant rally and has returned to validate the previous breakdown level. The examples shown are for ADA and XLM. According to the tweet, a continuation movement is likely.
Many altcoins are showing similar signs here, through which a new level needs to be established.
Nice rally upwards, rejection and now some consolidation before continuation is likely. pic.twitter.com/ovOAVt5LDA
— Michaël van de Poppe (@CryptoMichNL) January 19, 2020
This article will deal with the price of XLM and its future movement.
Important Resistance
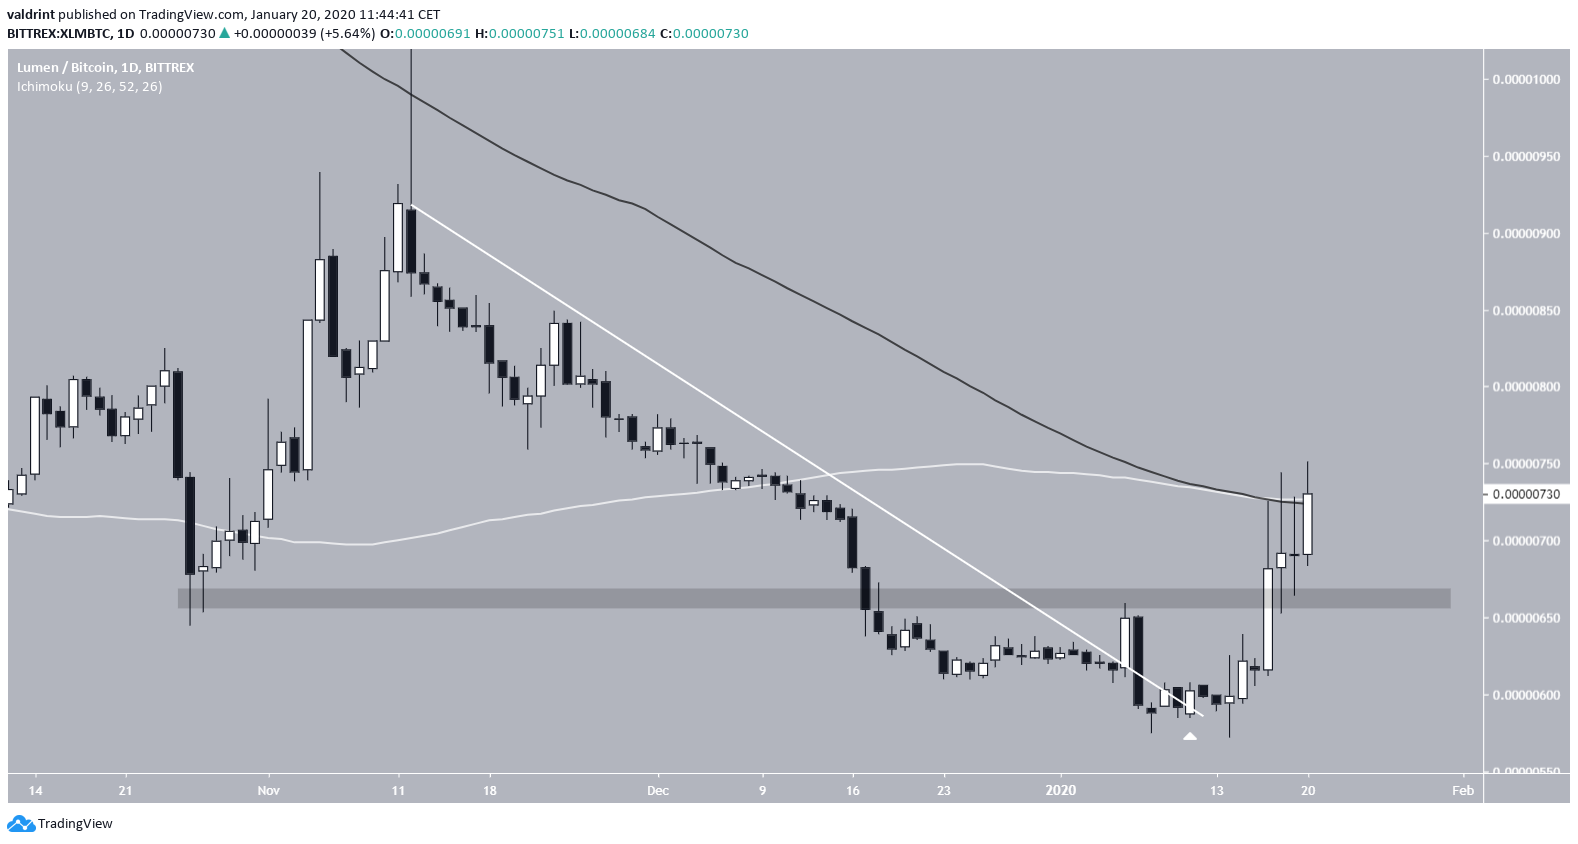
The significant resistance area mentioned previously is found near 660 satoshis. The XLM price broke out above it on January 18 before returning to validate it as support in the form of a long lower wick the next day. The price has been increasing since.
This movement comes after the price broke out above a long-term descending resistance line, increasing its significance.
The rally stopped once the price reached the 100 & 200-day moving averages (MAs). It is currently trading only slightly below these MAs, which have made a bullish cross. A daily price close above them would confirm that the price is heading upwards.
Consolidation
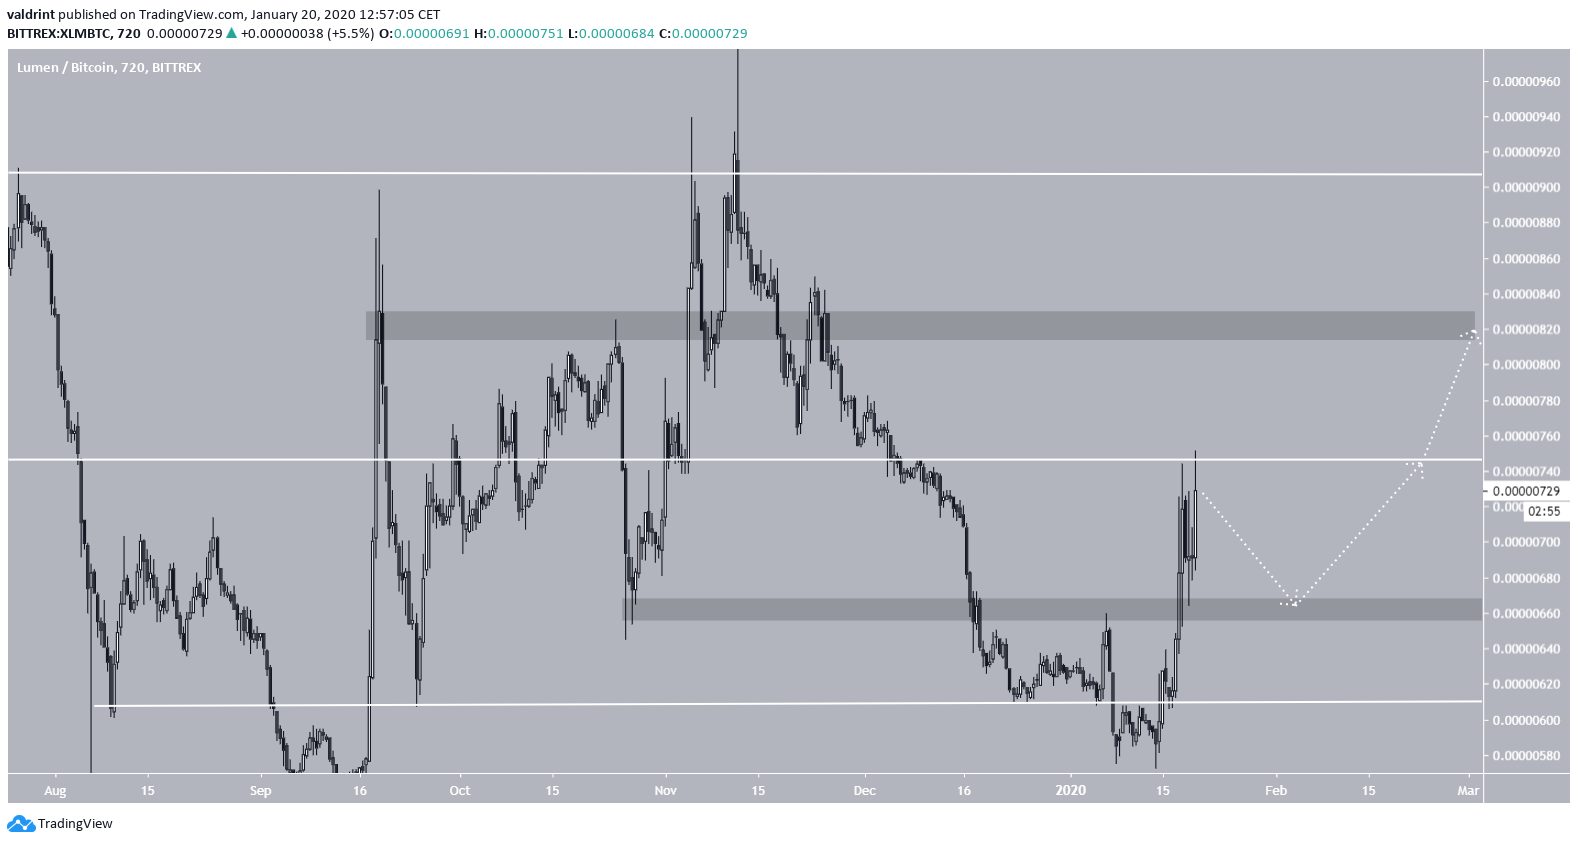
The major trading area since August 2019 is found between 605-905 satoshis. In addition, the midpoint of the range is at 755 satoshis, right where the current rally ended.
For the future movement, we could see a revisit of the resistance area at 660 sats, before another upward move takes it to 820 sats and possibly the high of the range, near 905 satoshis.
The short-term outlook supports the first portion of the movement. The XLM price has created an ascending wedge and generated bearish divergence in the RSI, indicating that a breakdown is likely.
Long-Term XLM Ascending Support
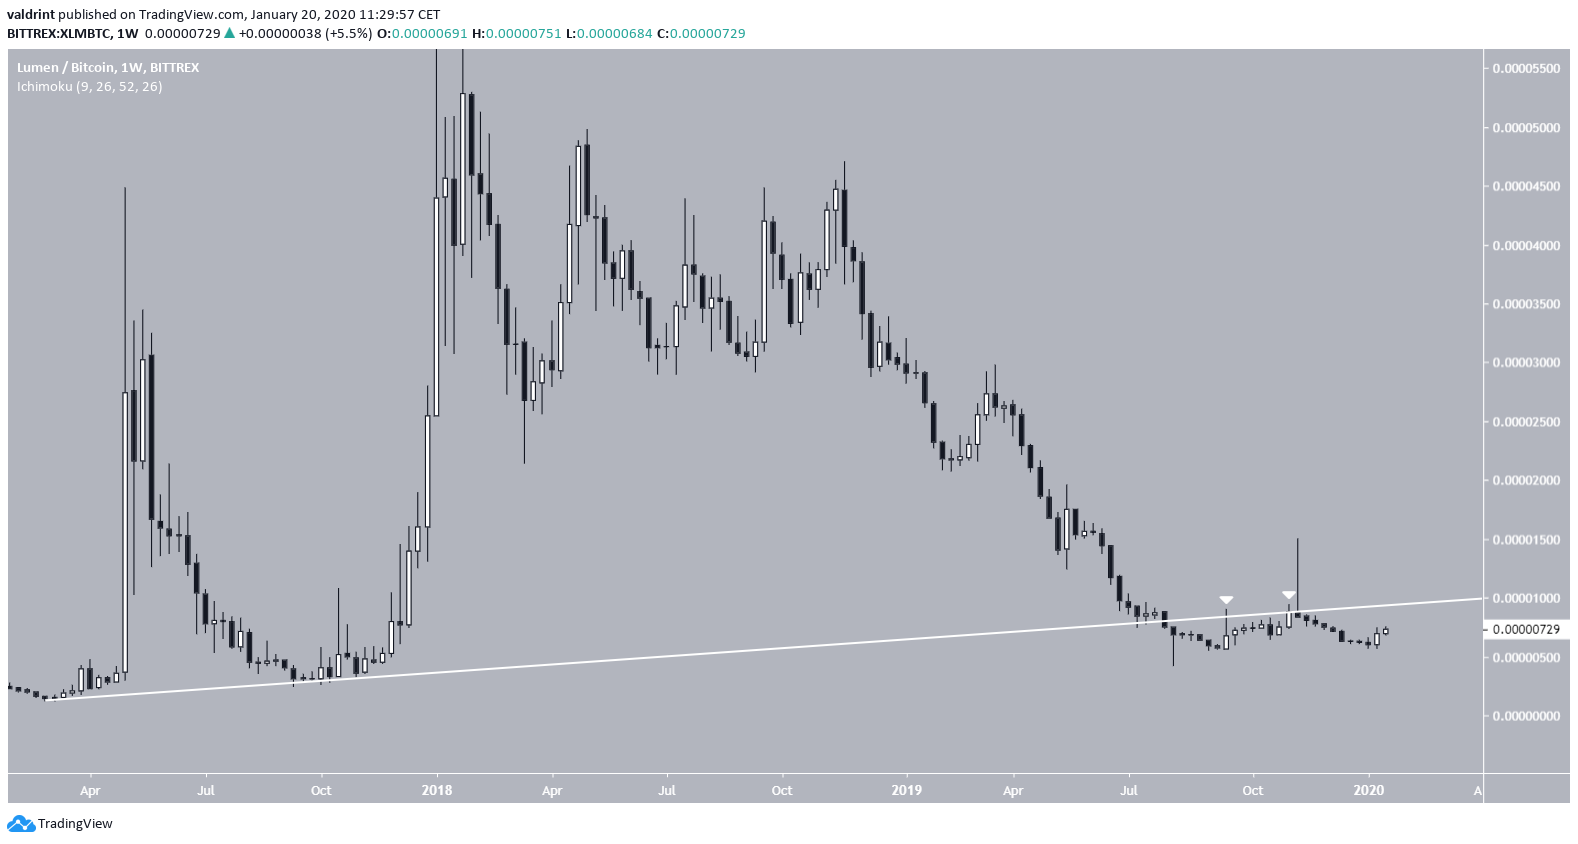
The long-term outlook is not as bullish. The XLM price has broken down below a long-term ascending support line and has validated it as resistance several times. The line is currently near 1000 satoshis.
Therefore, even if the price moves to the top of the range, it still would be below this long-term ascending support line.
To conclude, the XLM price bounced at the bottom of its range and is moving upward towards the top of the samerange. However, the long-term outlook has yet to turn bullish since XLM is trading below a significant resistance line. Until it reclaims it, we cannot confidently state that the outlook is bullish.


