


The XLM price has been decreasing since January 20. We believe this correction might have ended at the 650 satoshi support area and are expecting a breakout from the current pattern.
XLM Highlights
- The price is trading inside a short-term descending wedge.
- The price has created a double bottom.
- There is minor support at 650 and 610 satoshis.
- The price is trading below long-term moving averages.
Full-time trader @CryptoMichNL outlined the XLM price chart and stated that he believes the current area should act as the range low. If this is confirmed, the next targets are given at 750 and 930 satoshis.
This area should be the low for now. Assuming if we do, we could target 750 and possibly 930 satoshis for the next rally.
Still; $XRP / $XLM / $ONT / $ETH have to follow suit with the majors. pic.twitter.com/uuLVvRYefL
— Michaël van de Poppe (@CryptoMichNL) January 29, 2020
Let’s take a closer look at the price movement and determine if the current support area is likely to hold and reverse the price.
Double Bottom
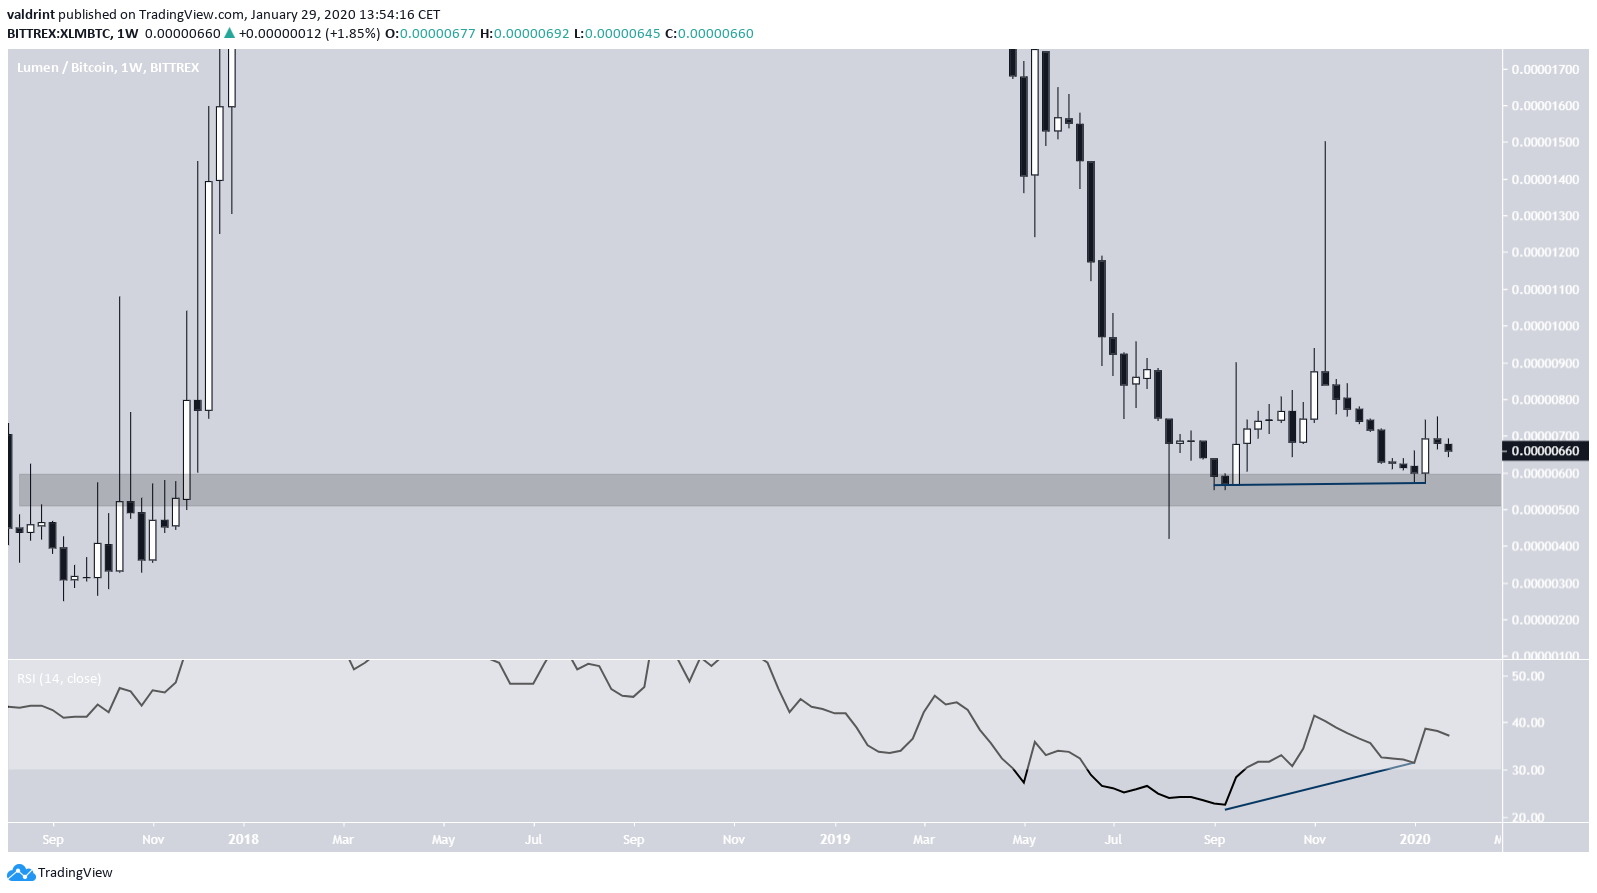
On September 2019, the XLM price reached the 550 satoshi support area, which was the catalyst for the 2018 upward movement. Once there, it began a failed rally and again reached the area in January 2020.
This is a double bottom, which is considered a bullish reversal pattern. Furthermore, it was combined with bullish divergence in the weekly RSI, which was in the oversold region, a bullish sign that suggests a price reversal awaits.
Short-Term Reversal
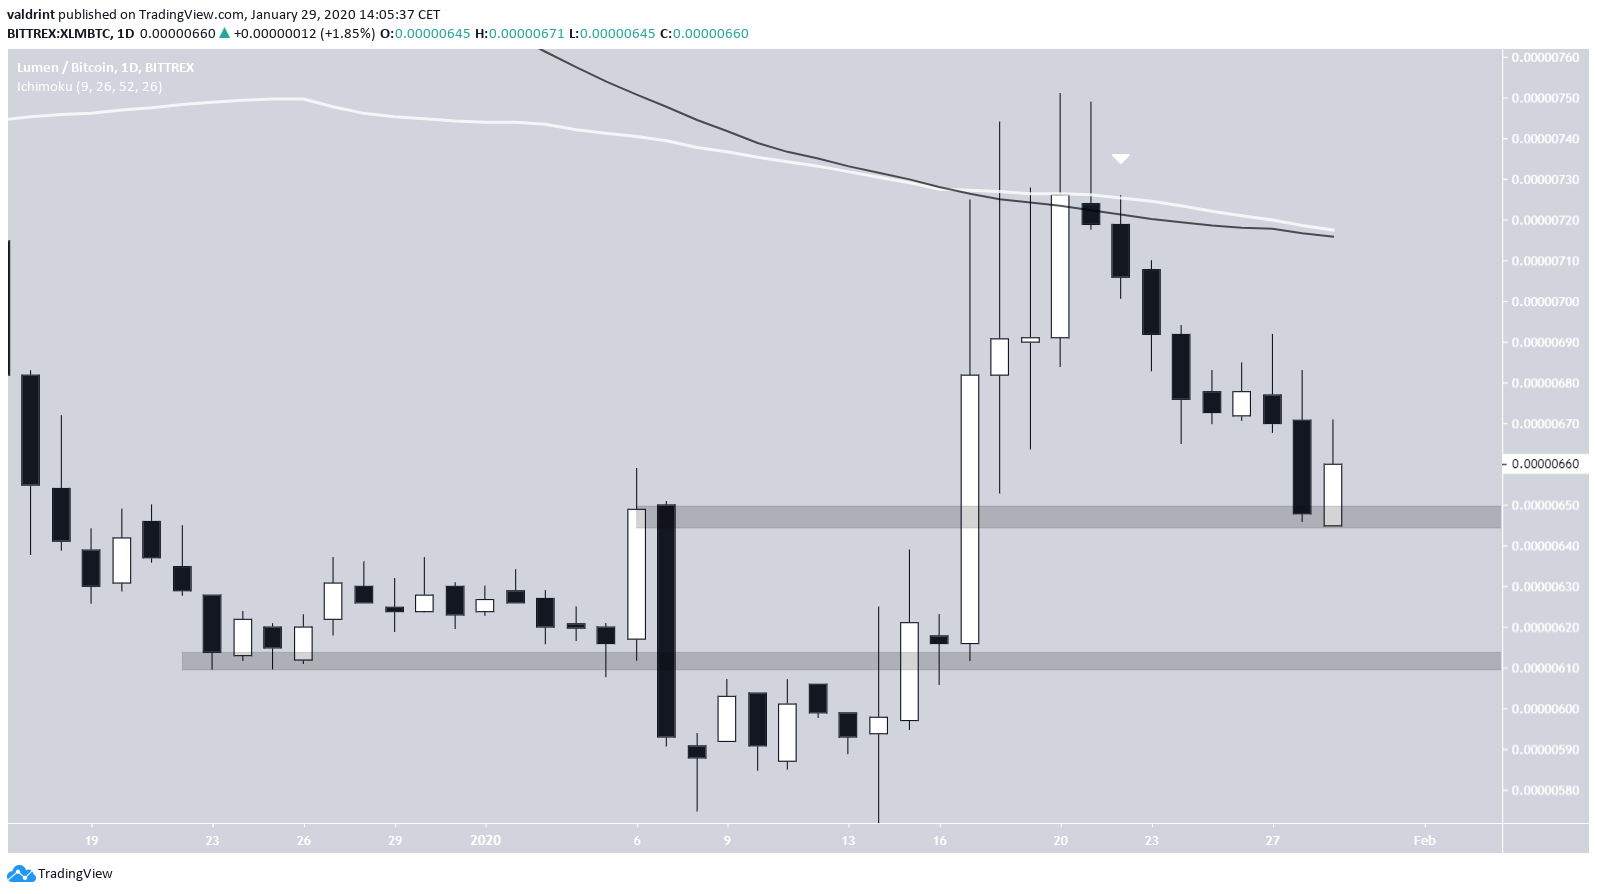
The daily chart reveals that the current rally ended once the price reached the 100- & 200-day moving averages (MA). For five days, the price created successive long upper wicks before beginning to decrease.
XLM has currently reached the minor support area at 650 satoshis, with the next one being found at 610 satoshis.
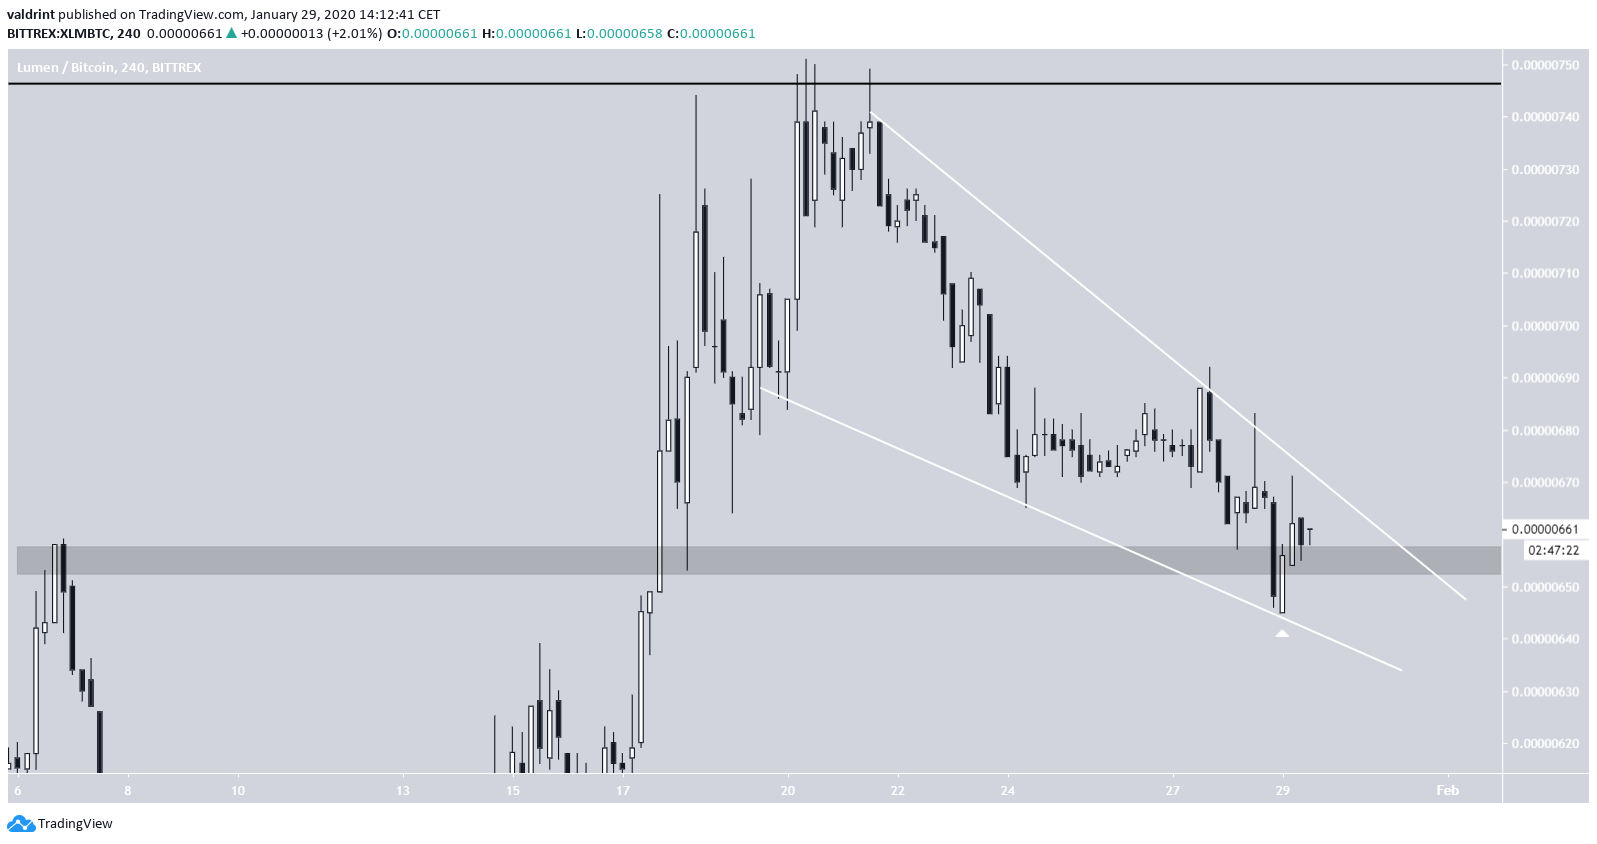
In addition, the price is trading inside a descending wedge. We believe the price will break out from this wedge.
Besides being a bullish pattern, the price made a false breakdown below the support area before quickly increasing above it.
This often suggests that the price will break out afterward. However, there is no bullish divergence in the RSI to confirm this possible movement.
XLM Trade Setup
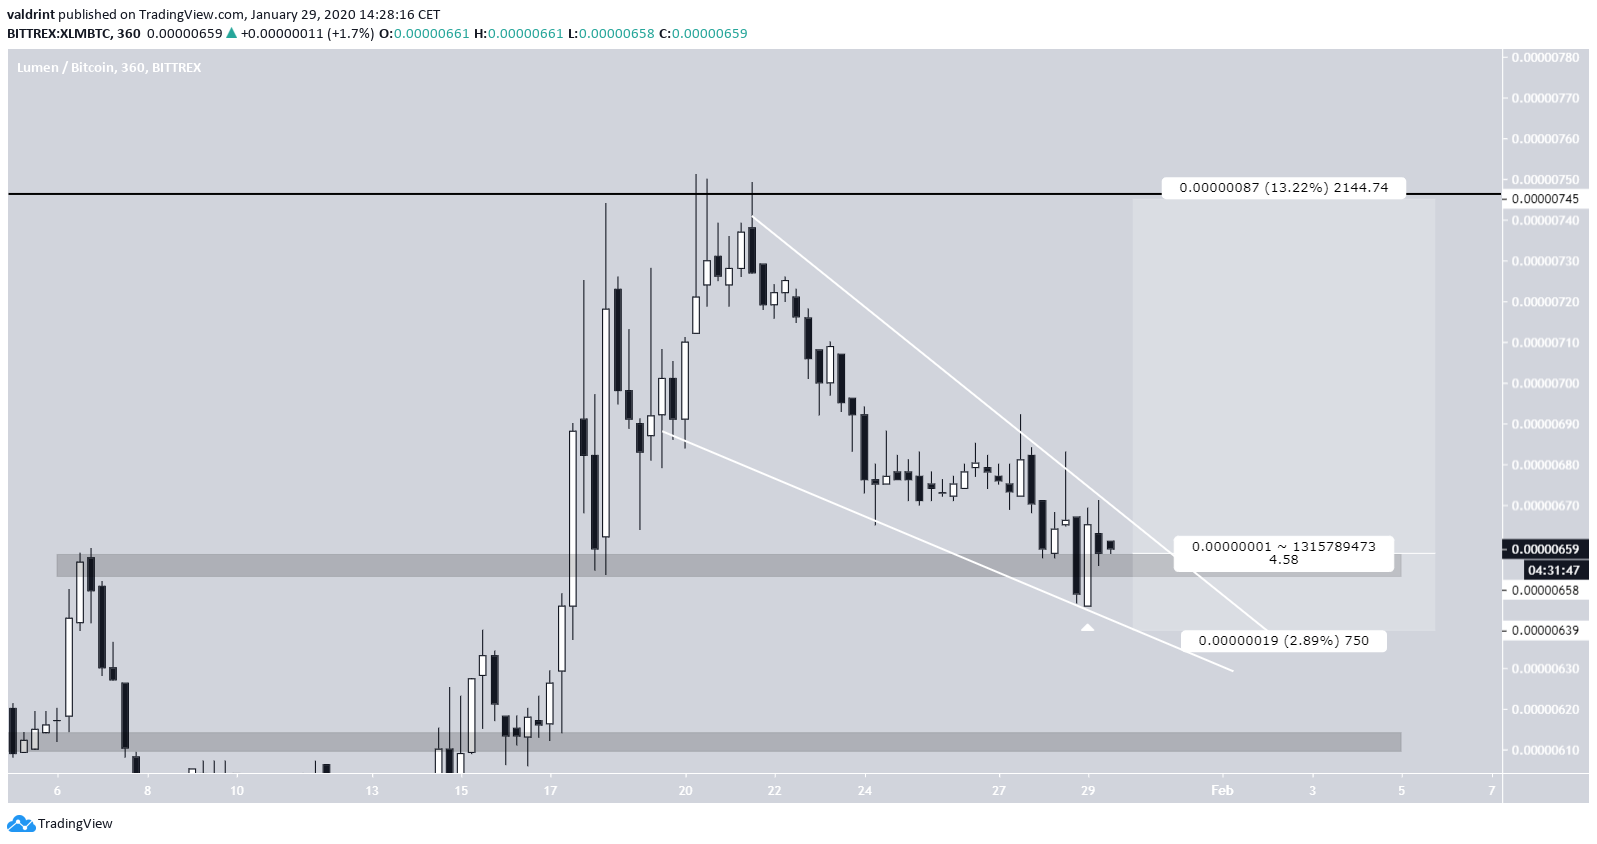
There is a trade set up that would prepare for the ensuing possible breakout and protect from losses in case the price breaks down.
The full setup is presented in the table below:
In addition, it is possible that the price moves above the 745 resistance area. In that case, the trade would present an optimal entry point for the future price increases.
To conclude, the XLM price has been trading inside a descending wedge since January 20. We believe the price will soon break out and make another attempt at moving above the 745 satoshi resistance area.


