


On February 2, the WTC price broke out from a long-term descending resistance line and has been increasing since.
WTC Highlights
- There is significant resistance at 12,000 satoshis.
- The weekly chart indicates that WTC has possibly reversed its trend.
- The price has successfully completed a double bottom pattern.
- WTC has broken out above a long-term descending resistance line.
- There is support at 5800 satoshis.
Cryptocurrency analyst, trader & streamer @imBagsy tweeted a WTC price chart stating that he has re-entered his position and is targeting the range high of 9100 satoshis for an increase of 38%.
$WTC update:
HUGE volume coming in today. I'm re-entering position, targeting the range high for +38%. pic.twitter.com/hYsChdJ5Qs
— Bagsy (@Bagsy) February 9, 2020
Will WTC be successful in reaching its target? Continue reading below if you are interested in finding out.
All-Time Low
The WTC price had traded above 12,000 satoshis for its entire price history. However, in September 2019, the price broke down from this support area and eventually reached an all-time low price of 401 satoshis.
In the future, the 12,000 satoshi area will likely provide strong resistance if the price manages to get there.
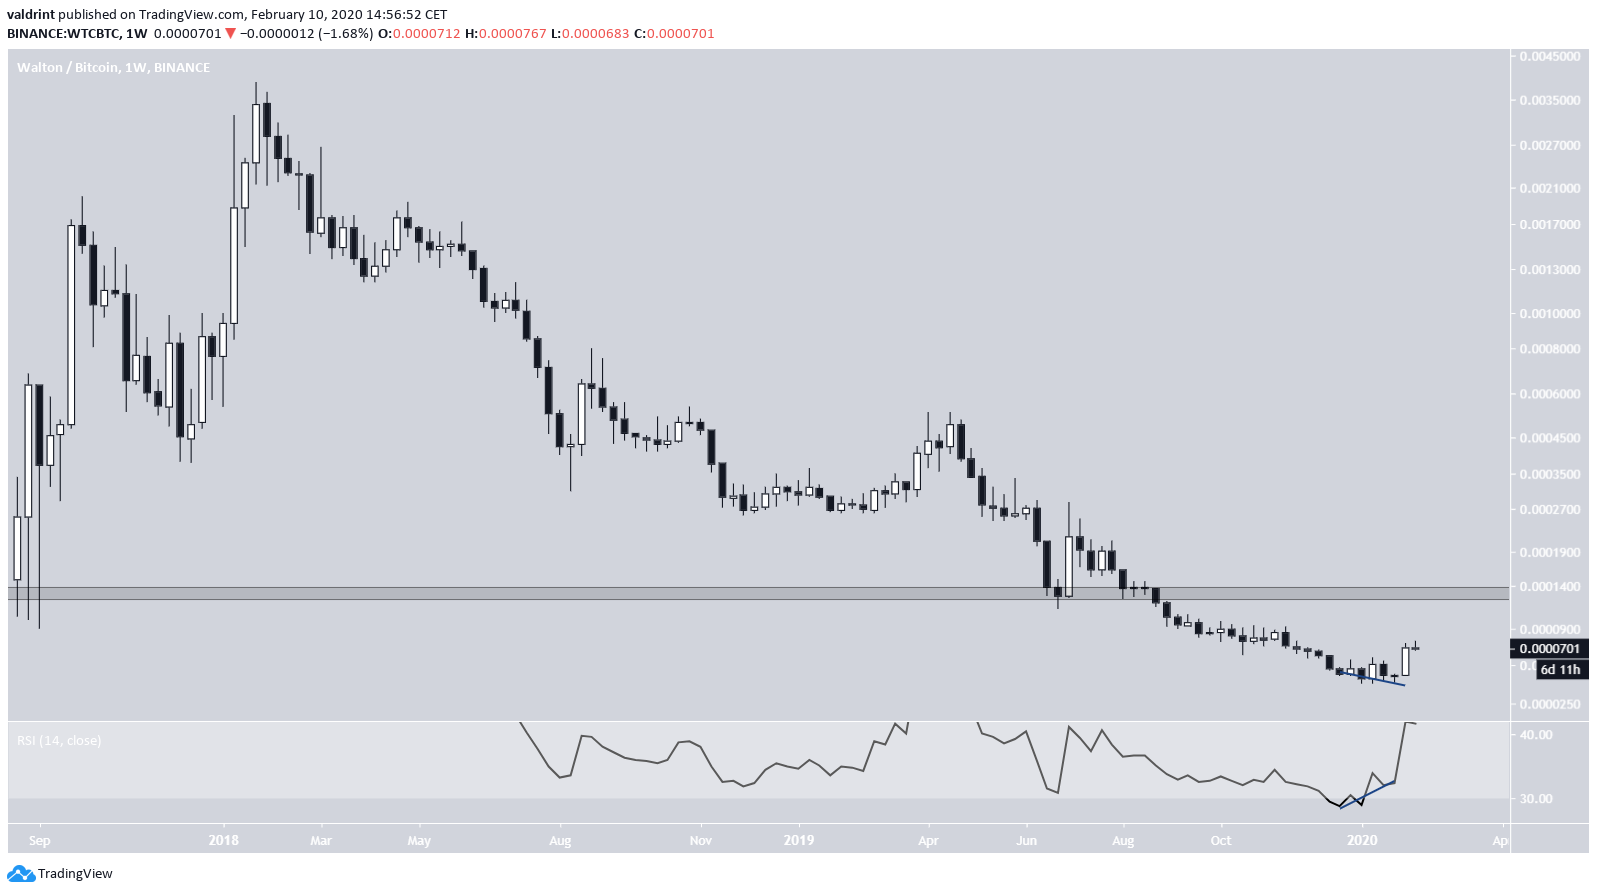
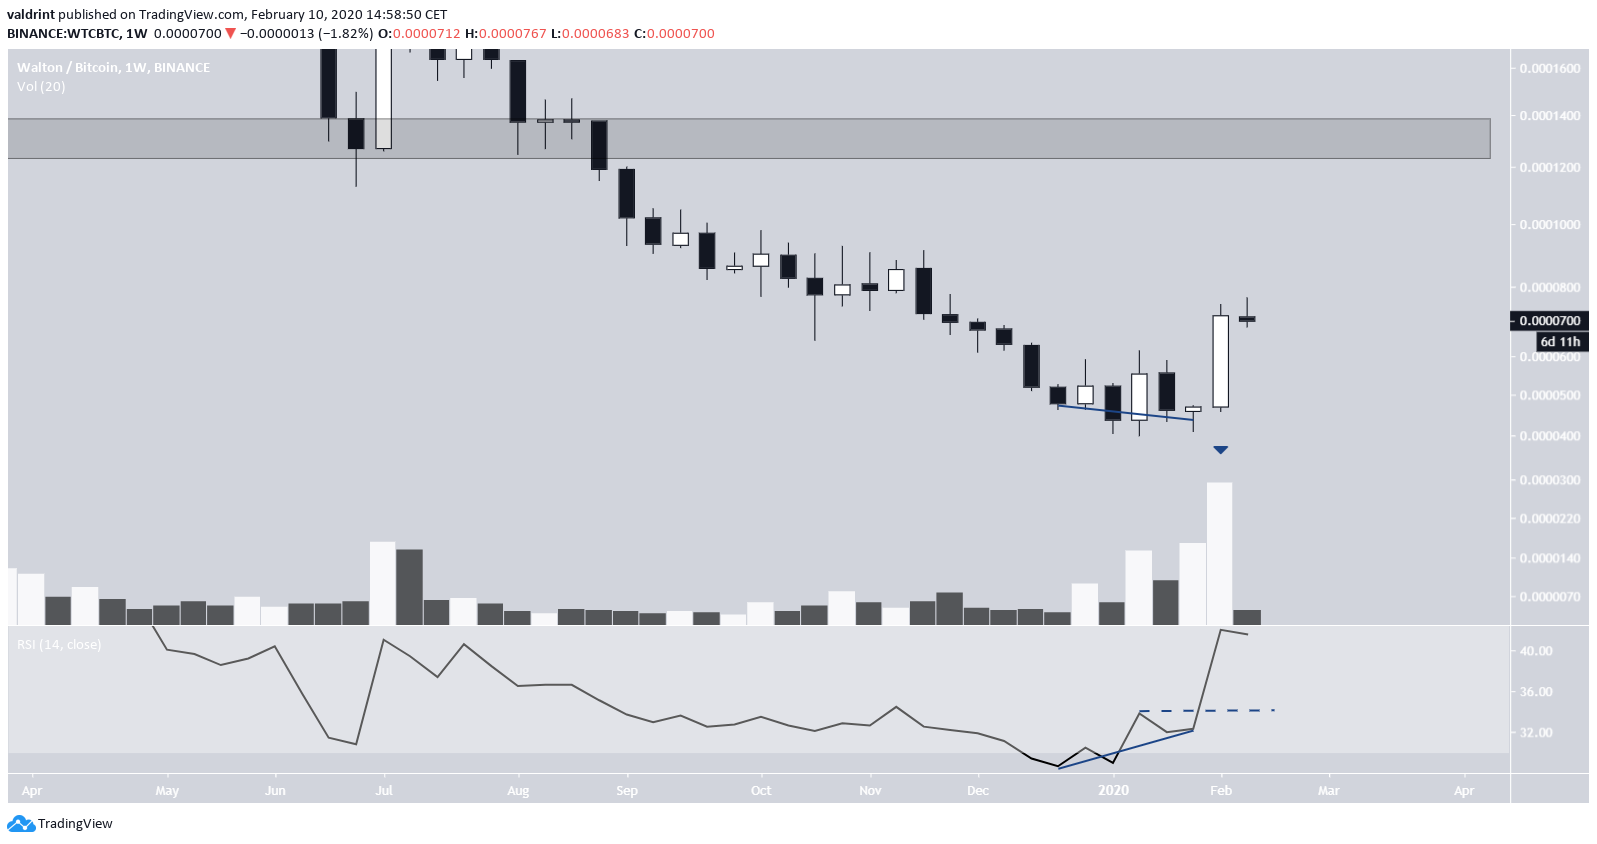
Looking closer at the movement, we can see that the weekly RSI generated bullish divergence inside its oversold territory and afterward completed a failure swing bottom, moving above the high between the divergence lows (dashed line).
What followed afterward was the creation of a bullish engulfing candlestick with very significant volume, suggesting that the price has reversed its trend and will head towards the breakdown level.
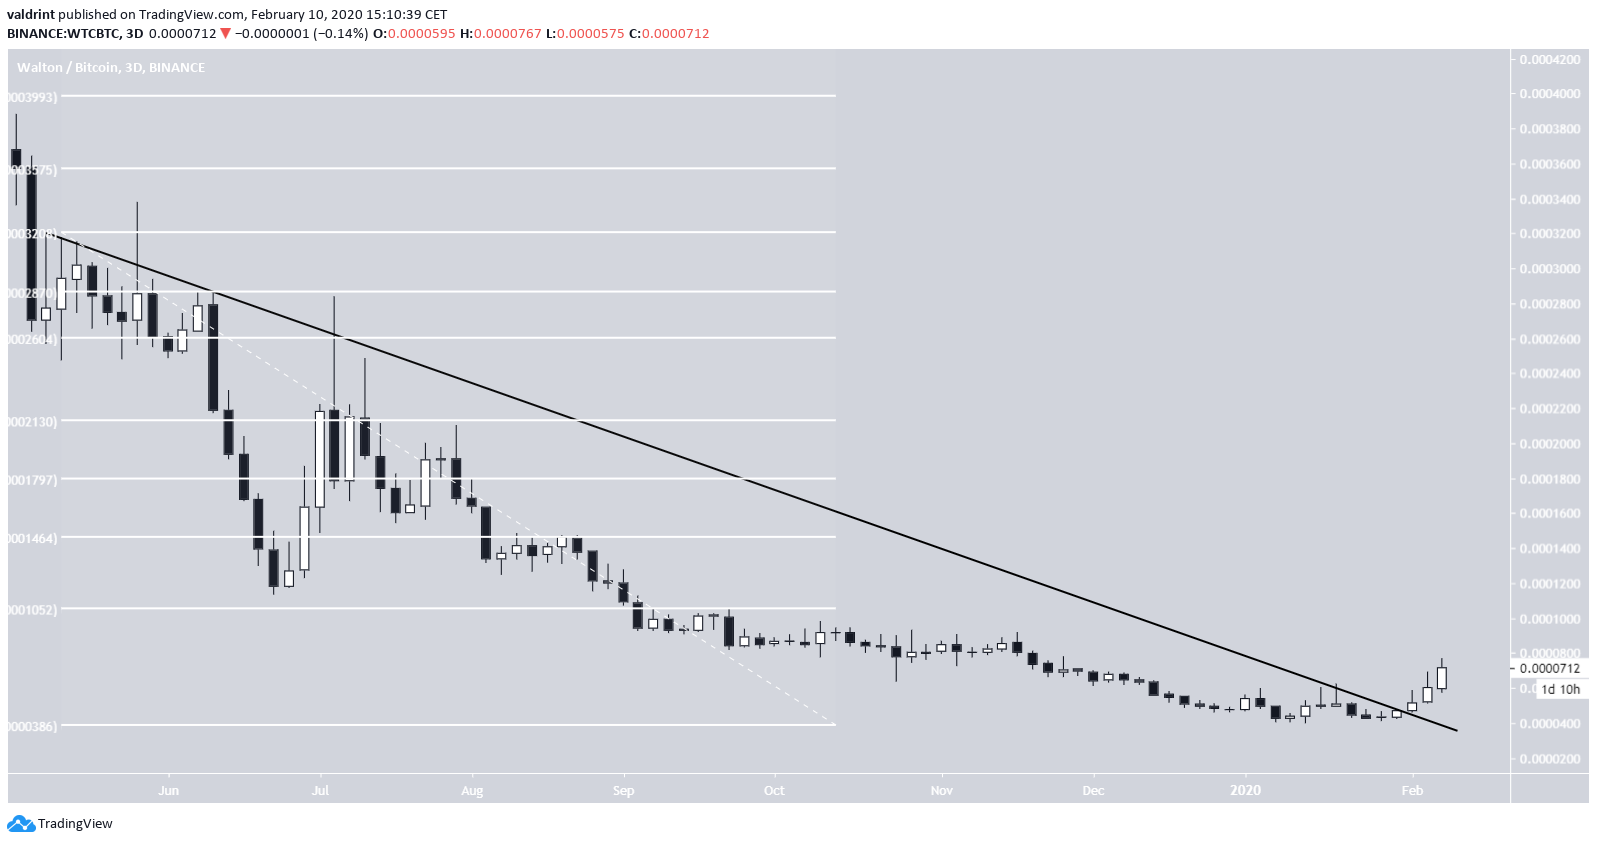
Resistance Line Breakout
On February 2, the WTC price broke out from a descending resistance line that had been in place for 266 days. This confirms our previous finding that the price has likely reversed its trend and will continue to move upwards.
Using a Fibonacci retracement tool we can find the closest resistance areas at 10,500, 14,500 and 18,000 satoshis, respectively.
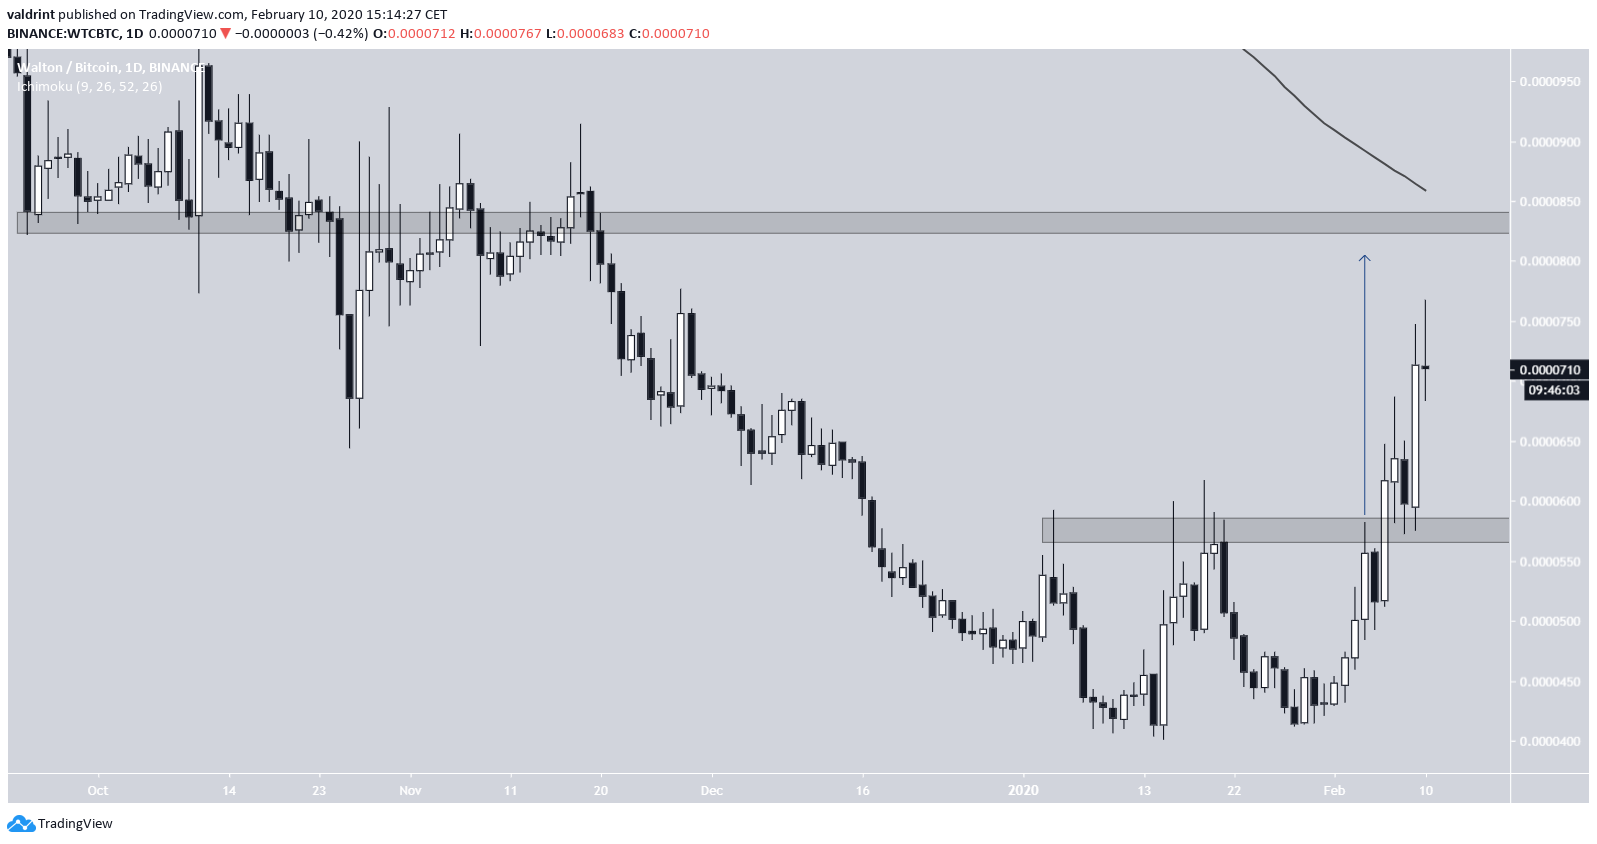
In the daily chart, we can see that the price has successfully completed a double bottom pattern. If the price travels the entire height of the pattern, it is likely to find resistance at 840 satoshis, coinciding with a previously significant support area and the 200-day moving average (MA).
Therefore, our target differs only slightly from the one given in the tweet, but the predicted direction of the future movement remains the same.
To conclude, the WTC price has broken out above a long-term descending resistance line and has been increasing since. We believe this was the beginning of a new bullish market cycle for WTC which will allow the price to head for its breakdown level at 12,000 satoshis.


