
Wormhole (W) surged nearly 12% on Thursday after the project unveiled its official product roadmap. The project’s one-year anniversary has sparked speculative interviews.
However, technical data shows buyers and sellers locked in a fierce battle, as momentum indicators suggest a weakening trend. The DMI, Ichimoku Cloud, and EMA structures all reflect market indecision, with no clear direction confirmed just yet.
Wormhole DMI Chart Shows Market Indecision
Wormhole’s DMI chart shows its ADX (Average Directional Index) has dropped to 21.69 from 27.59 just a day earlier, signaling that the recent trend may be losing strength.
The ADX is a key indicator used to measure the strength—not the direction—of a trend. Generally, values below 20 suggest a weak or non-existent trend, while values above 25 indicate a strong trend.
With ADX now hovering near the threshold, it suggests that the bullish momentum seen in recent days could be fading.
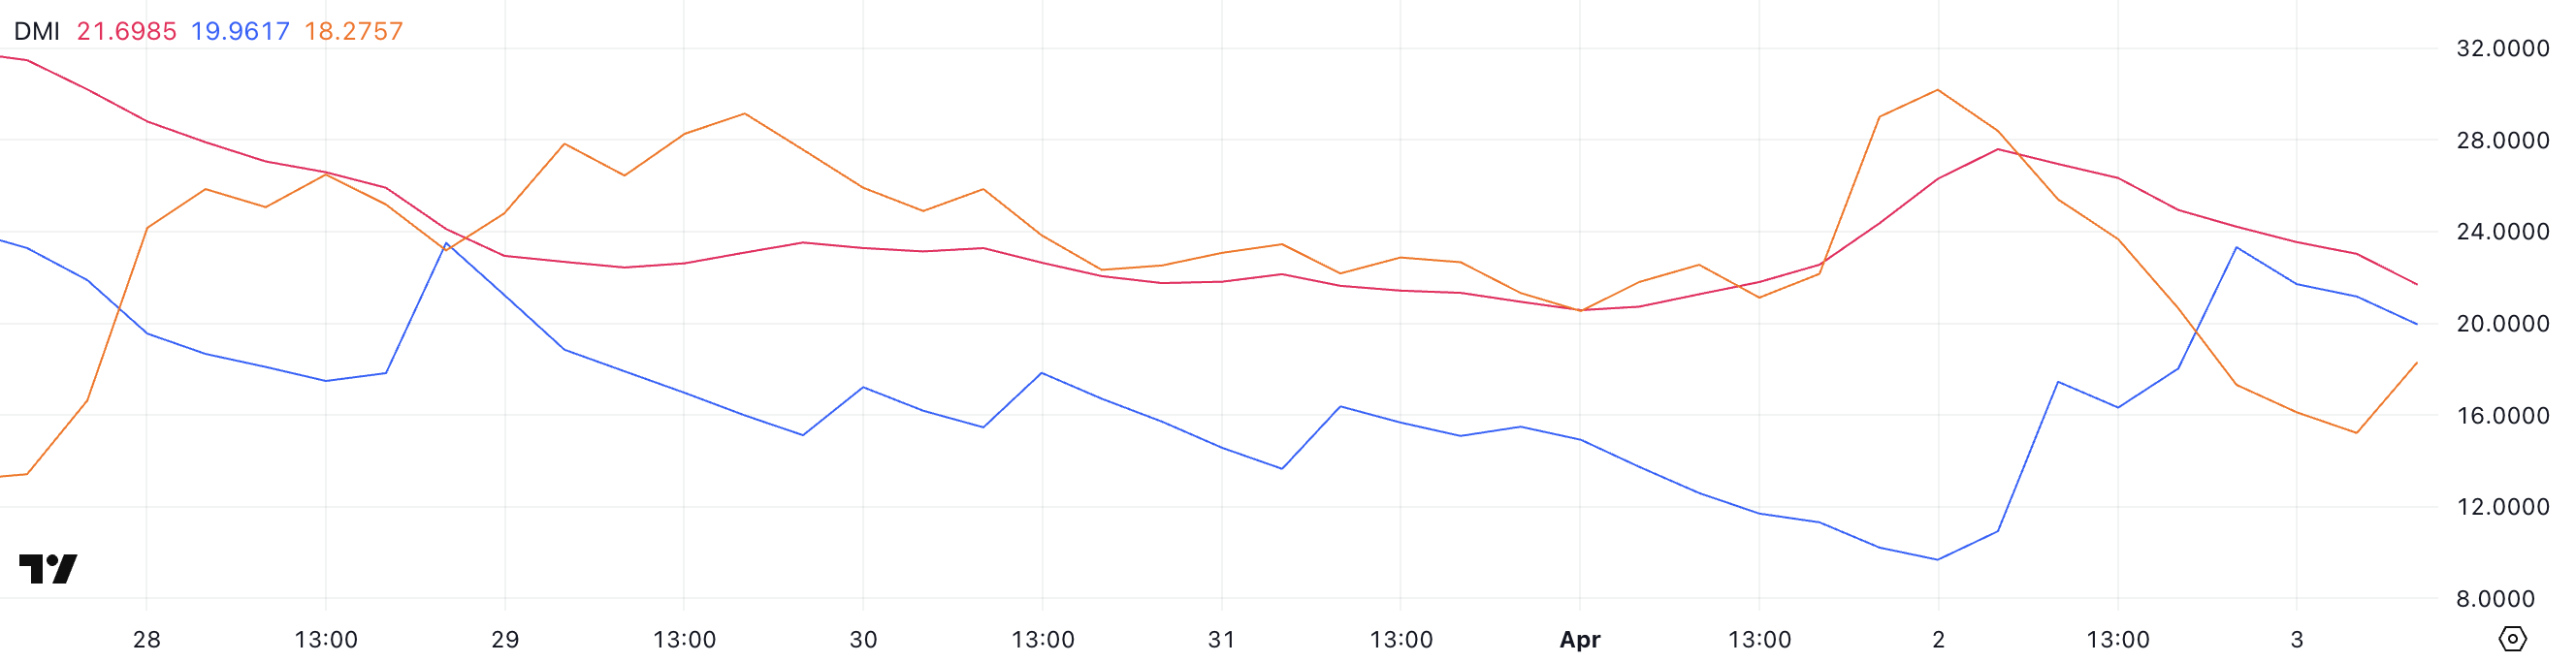
Looking deeper, the +DI (Positive Directional Indicator) has fallen to 19.96 after peaking near 24 earlier, though it had surged from 9.68 the previous day.
Meanwhile, the -DI (Negative Directional Indicator) climbed to 18.27 after dropping to 15.21 earlier, following a sharp decline from 30.18 yesterday. This narrowing gap between +DI and -DI—combined with a weakening ADX—suggests uncertainty and potential indecision in price action.
With a $137.64 million token unlock on the horizon, this shift could hint at a cooling bullish impulse and the risk of renewed selling pressure if supply outweighs demand.
Ichimoku Cloud Shows Mixed Signals
Wormhole’s Ichimoku Cloud chart shows a mixed outlook. Price action is attempting to break through resistance but still faces notable headwinds.
The Tenkan-sen (blue line) has recently flattened and is closely aligned with the Kijun-sen (red line), signaling indecision or a potential pause in momentum.
Typically, when these lines are flat and close together, it indicates consolidation rather than a clear trend continuation or reversal.
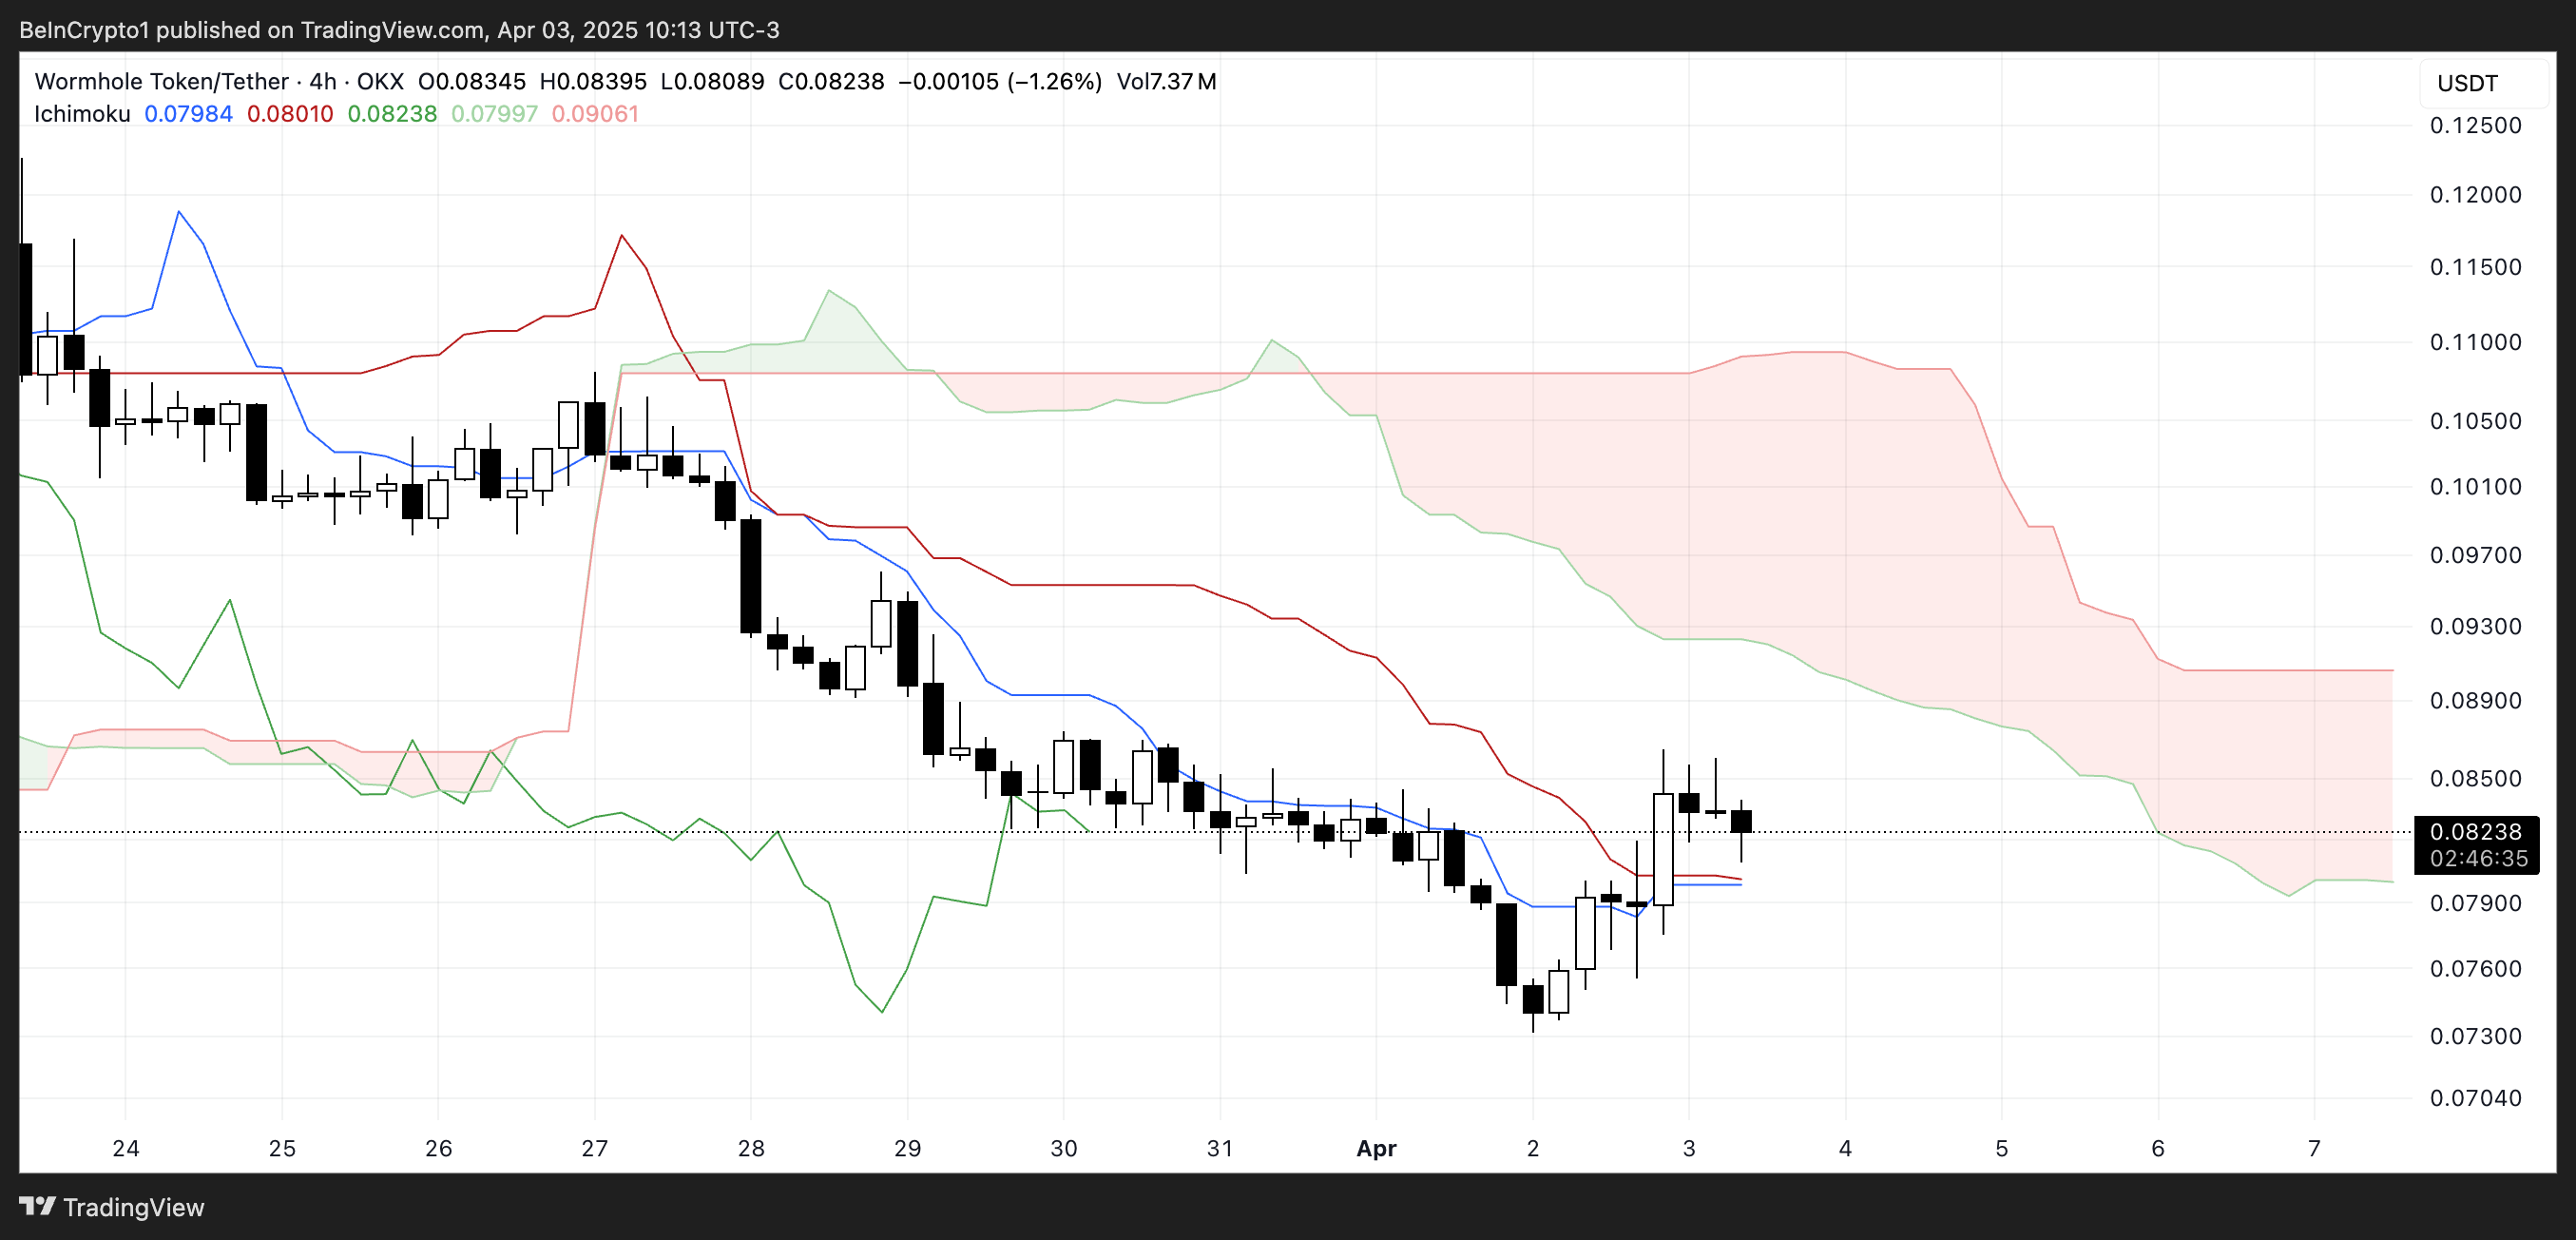
Meanwhile, the Kumo (cloud) remains thick and red ahead, reflecting strong overhead resistance and a bearish long-term bias.
The price is hovering near the lower edge of the cloud but has yet to make a decisive move above it—suggesting that bullish momentum is tentative at best.
For a confirmed trend reversal, a clean break above the cloud with bullish crossovers would be needed. Until then, the chart points to a market still trying to find direction, especially ahead of a major token unlock event that could further impact sentiment and price action.
Will Wormhole Reclaim $0.10 In April?
Wormhole, which builds solutions around interoperable bridges, continues to see its EMA setup reflect a bearish structure. Short-term moving averages are still positioned below the longer-term ones, an indication that downward pressure remains dominant.
However, one of the short-term EMAs has started to curve upward, hinting at a possible shift in momentum as buyers begin to step in. This early uptick could signal the beginning of a trend reversal, though confirmation is still pending.
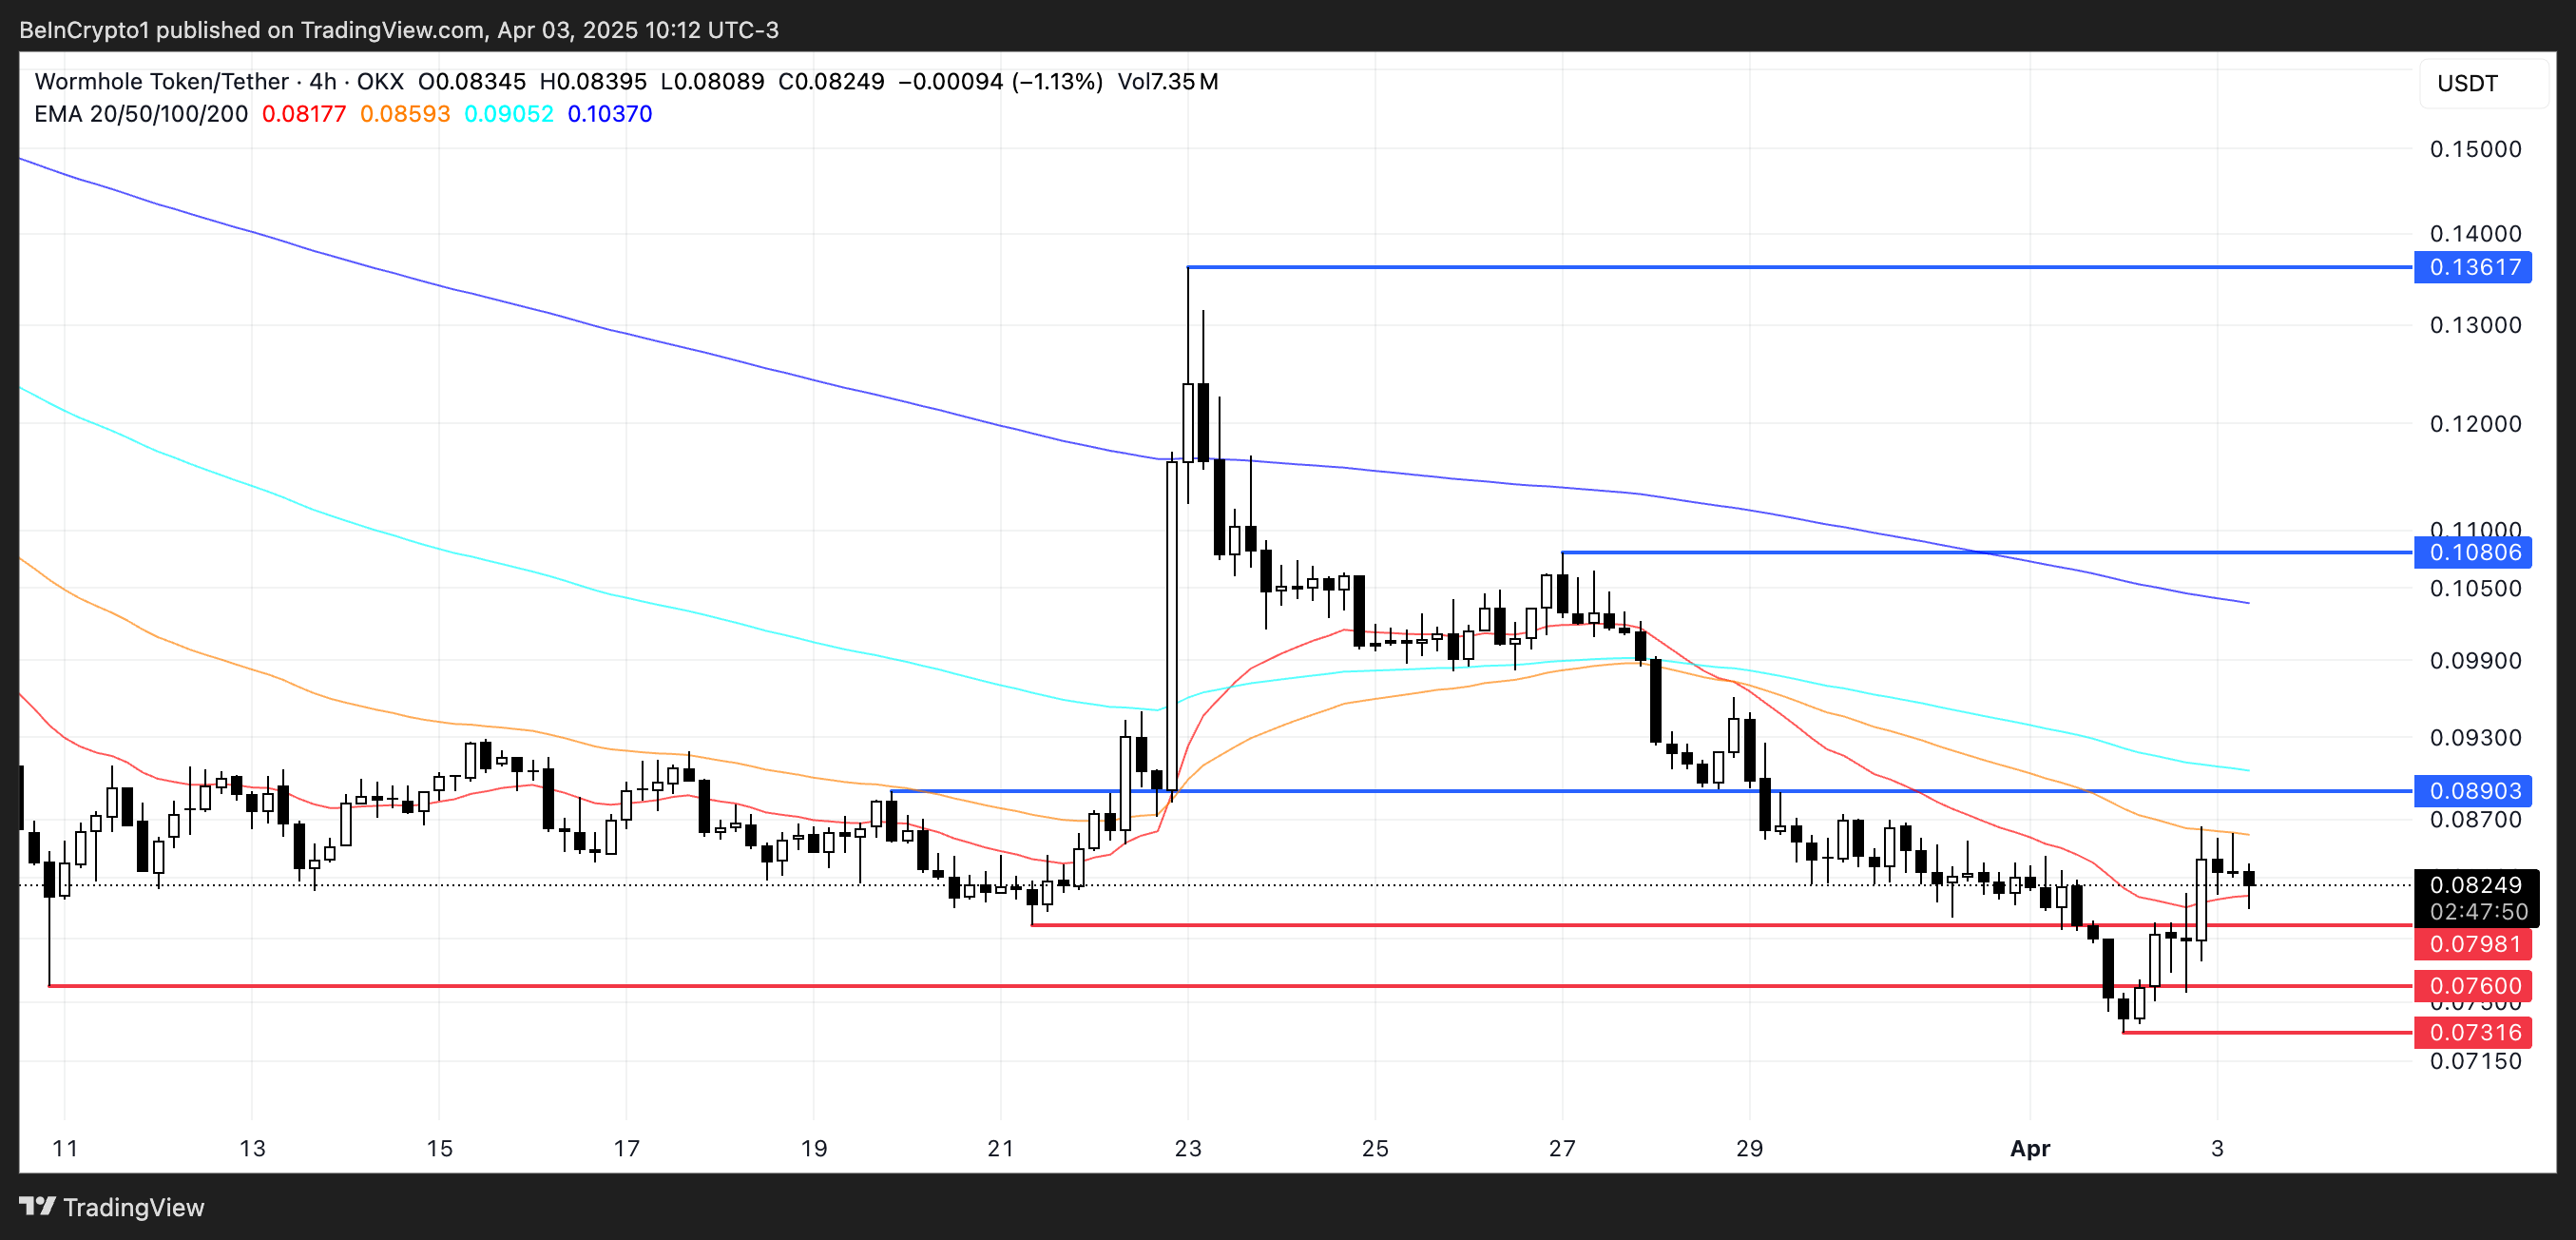
If bullish momentum gains traction, Wormhole may attempt to break the nearby resistance at $0.089. A successful breakout could open the door for a move toward higher resistance levels at $0.108 and even $0.136.
Conversely, failure to clear $0.089 could reinforce bearish control, pushing the price back to test support at $0.079.
A break below that level could expose W to further downside toward $0.076, $0.073, and potentially below $0.07—marking uncharted territory for the token.
