


The value of WLD, the token that powers Worldcoin, the crypto project co-founded by OpenAI CEO Sam Altman, has spiked by almost 30% in the past seven days.
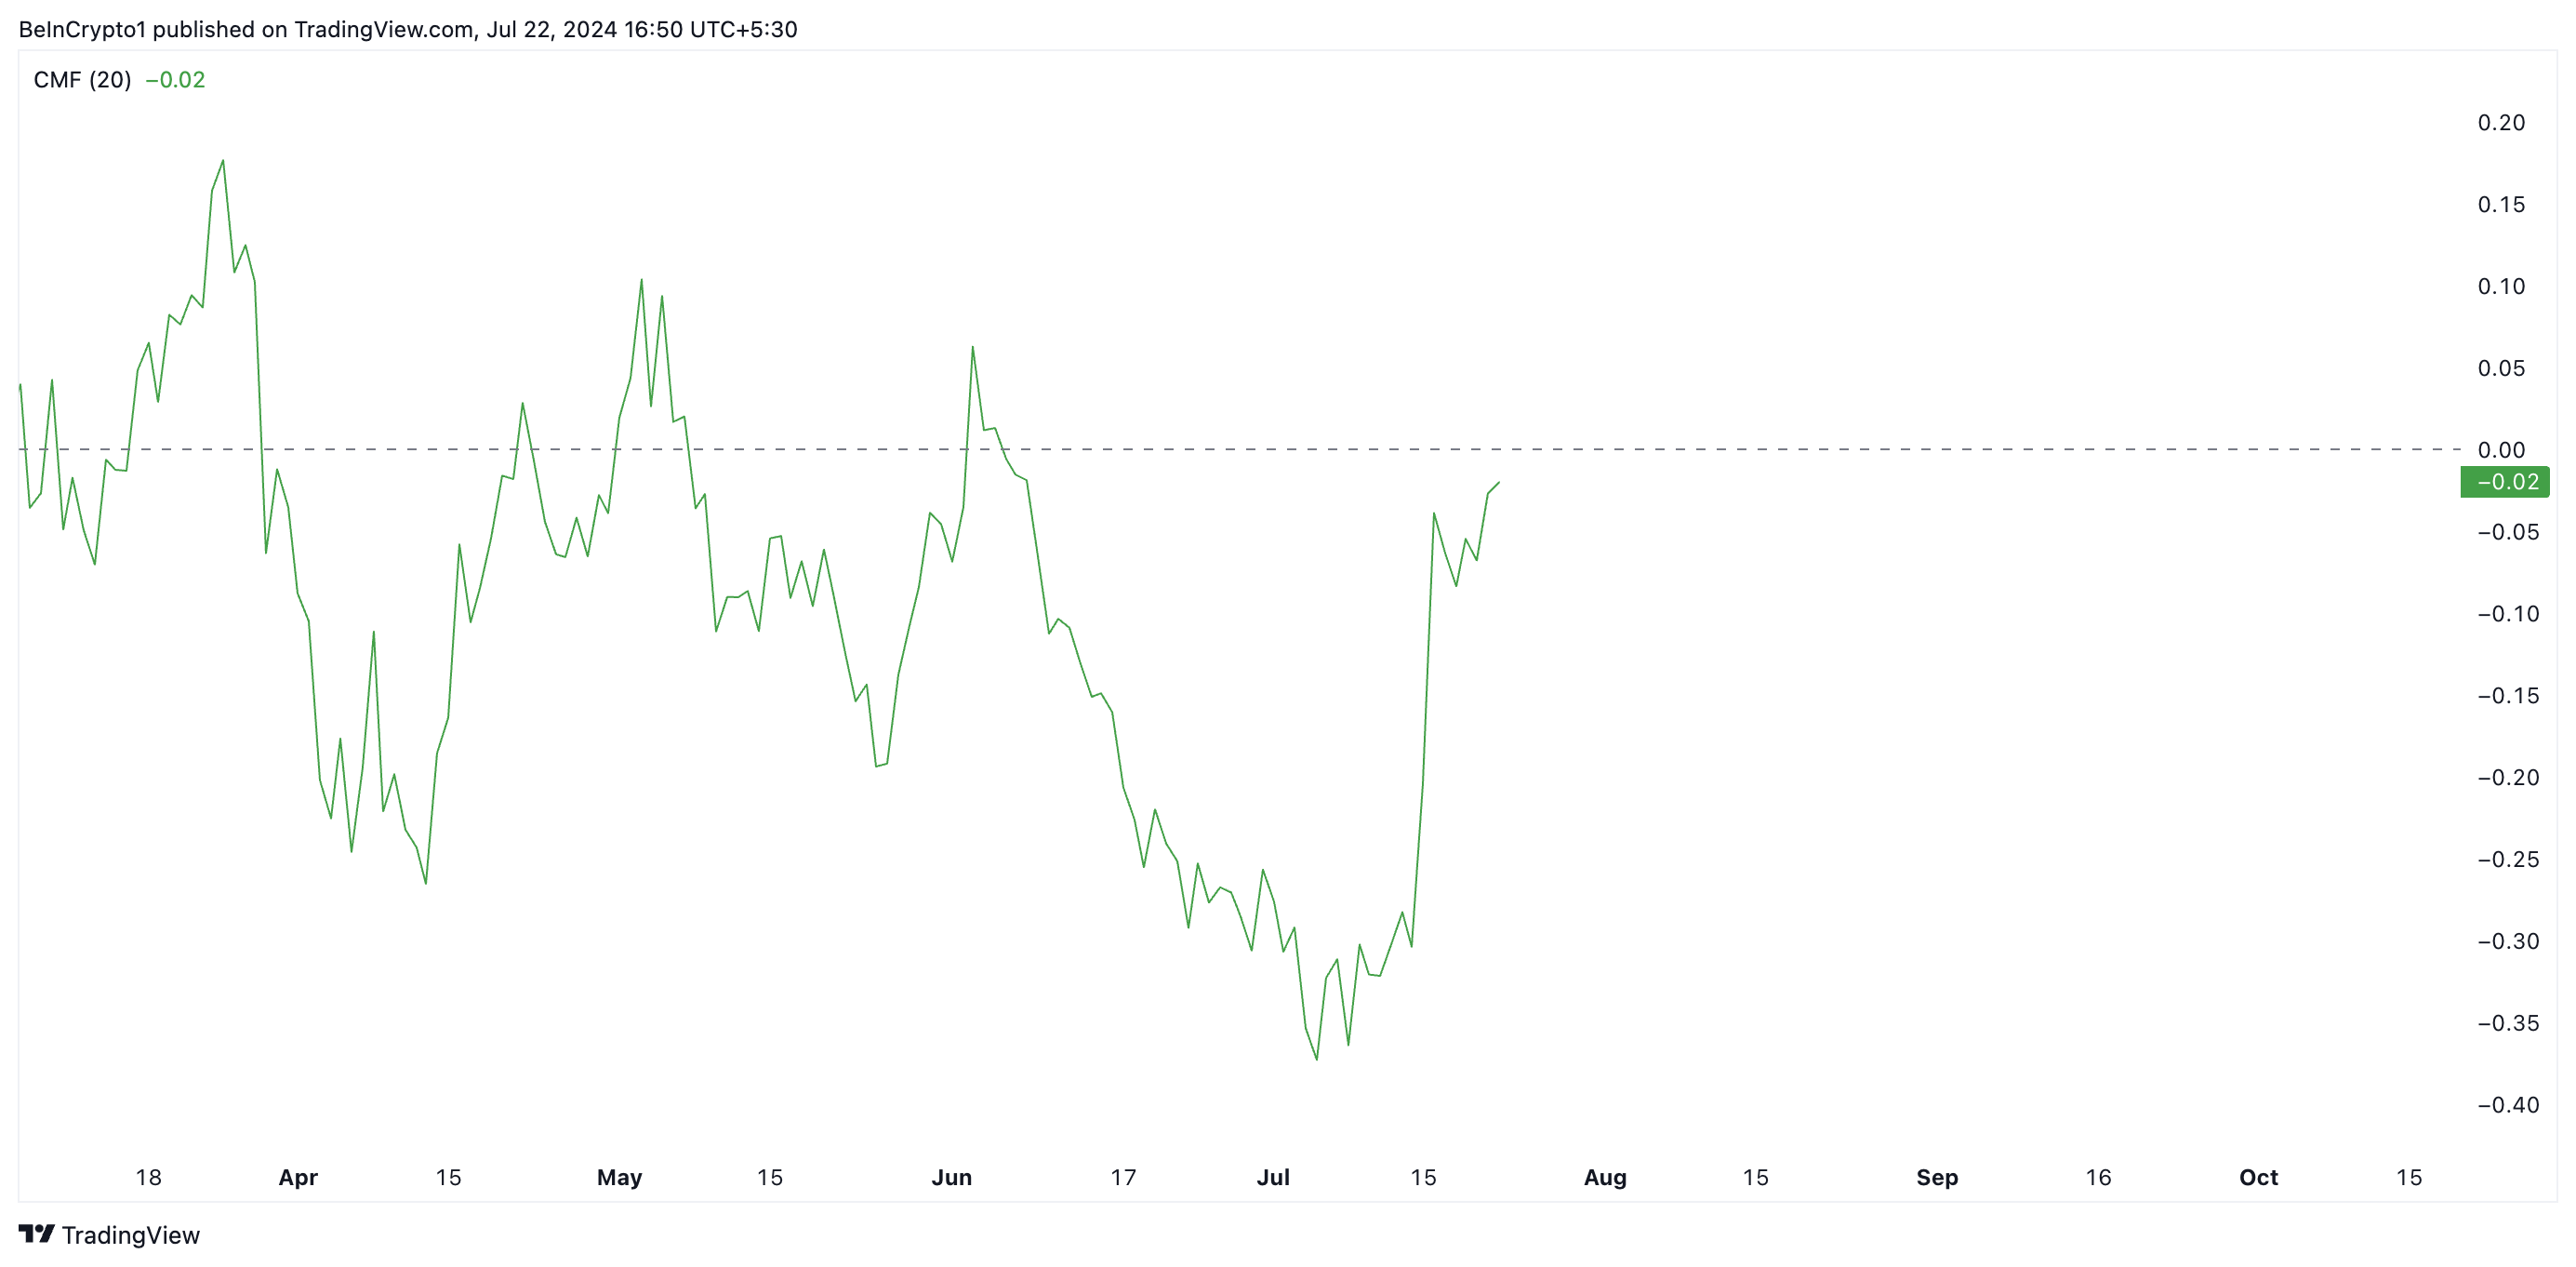
However, a closer look at the token’s technical indicators reveals a potential roadblock. A bearish divergence has been identified in its Chaikin Money Flow (CMF), suggesting a possible decline in its value in the near term.
Worldcoin is Poised To Reverse Gains
Even though Worldcoin’s price has surged in the past week, its Chaikin Money Flow (CMF) remains below zero. The indicator measures the flow of money into and out of an asset.
When an asset’s price climbs while its CMF is below zero, it suggests a net outflow of money from the asset. This signals a weak buying pressure despite the price increase.
This divergence between the asset’s price and its CMF is a bearish signal, suggesting that the price rally may not be supported by strong buying interest and could potentially reverse or face a correction.
Read More: How to Buy Worldcoin (WLD) and Everything You Need to Know
WLD’s declining Relative Strength Index (RSI) confirms the decline in bullish bias toward the altcoin. As of this writing, the token’s RSI is in a downtrend at 48.10.
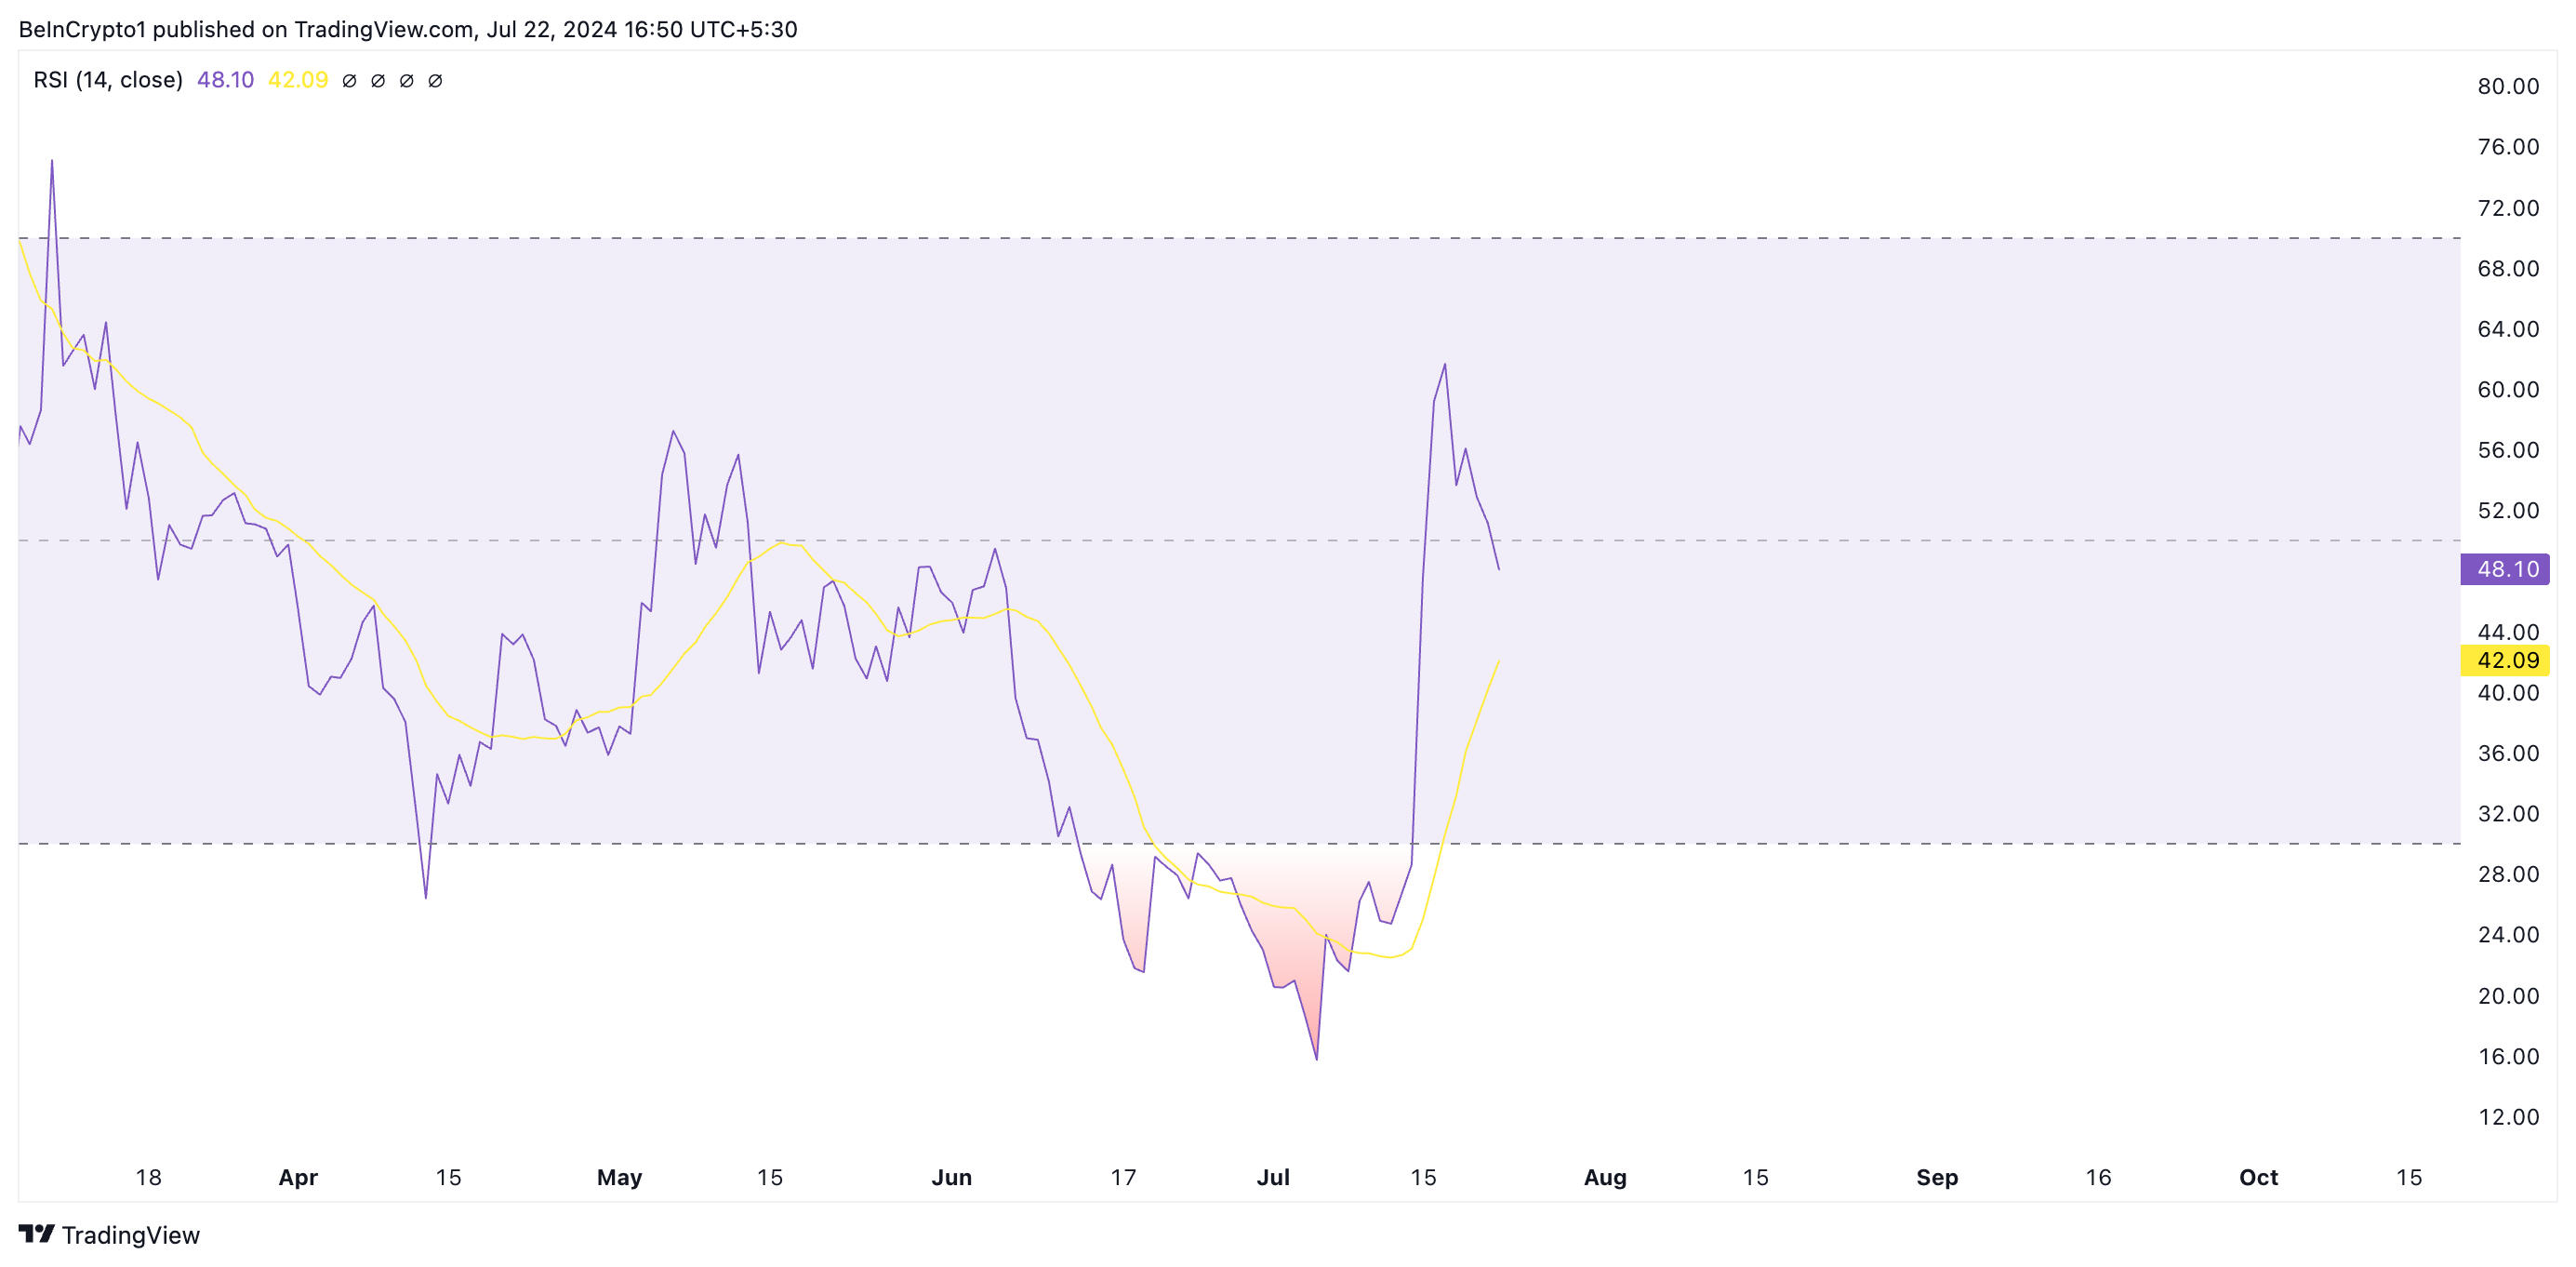
An asset’s RSI measures its overbought and oversold market conditions. It ranges between 0 and 100, with values above 70 indicating that the asset might be overbought and a price correction or reversal might occur. On the other hand, RSI values below 30 suggest that the asset might be oversold, and a rebound could happen.
At 48.10, WLD’s RSI suggests that selling pressure outweighs buying momentum despite the token’s price rally. This puts it at risk of a potential decline.
WLD Price Prediction: Futures Traders Are Not Convinced
While its price climbed this past week, WLD futures traders opened short positions. This can be gleaned from its significantly negative funding rate across cryptocurrency exchanges. At press time, according to Coinglass’ data, WLD’s funding rate is -0.022%.
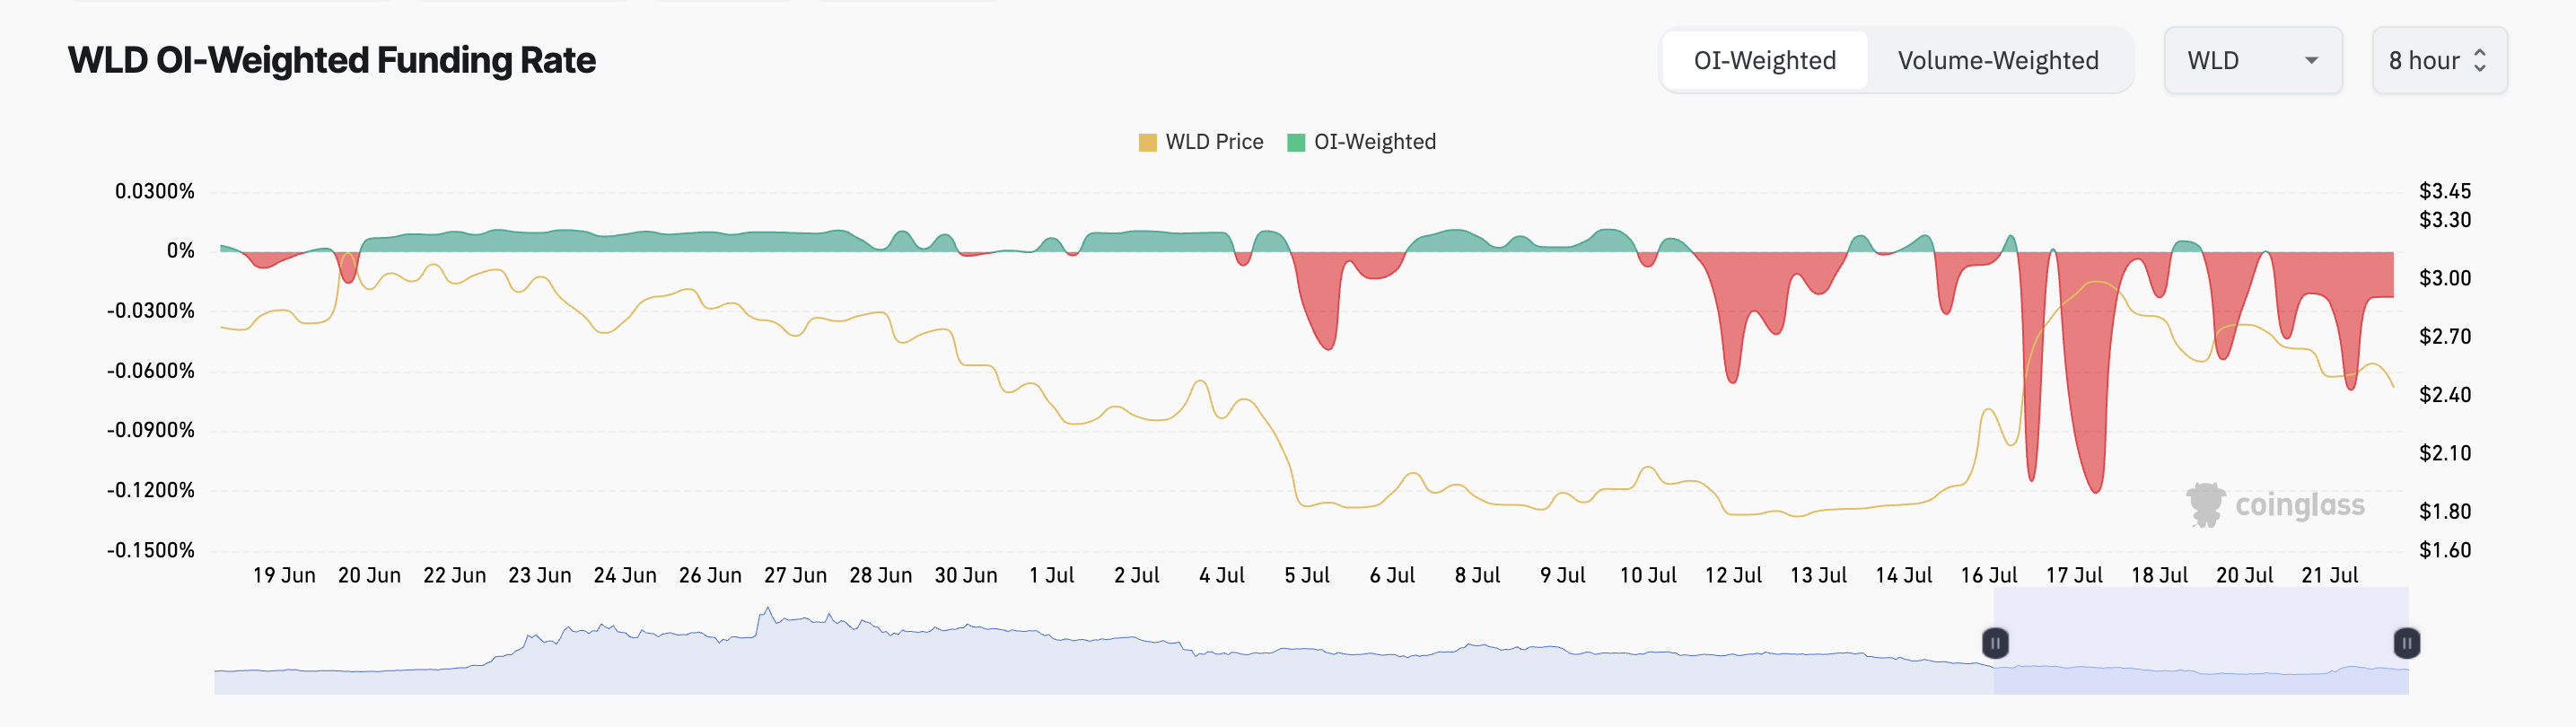
When an asset’s funding rate is negative, it indicates more traders are taking short positions. This suggests that more traders anticipate a decline in the asset’s price compared to those buying it, hoping to sell at a higher price.
If this holds, WLD’s price will fall to $1.80.
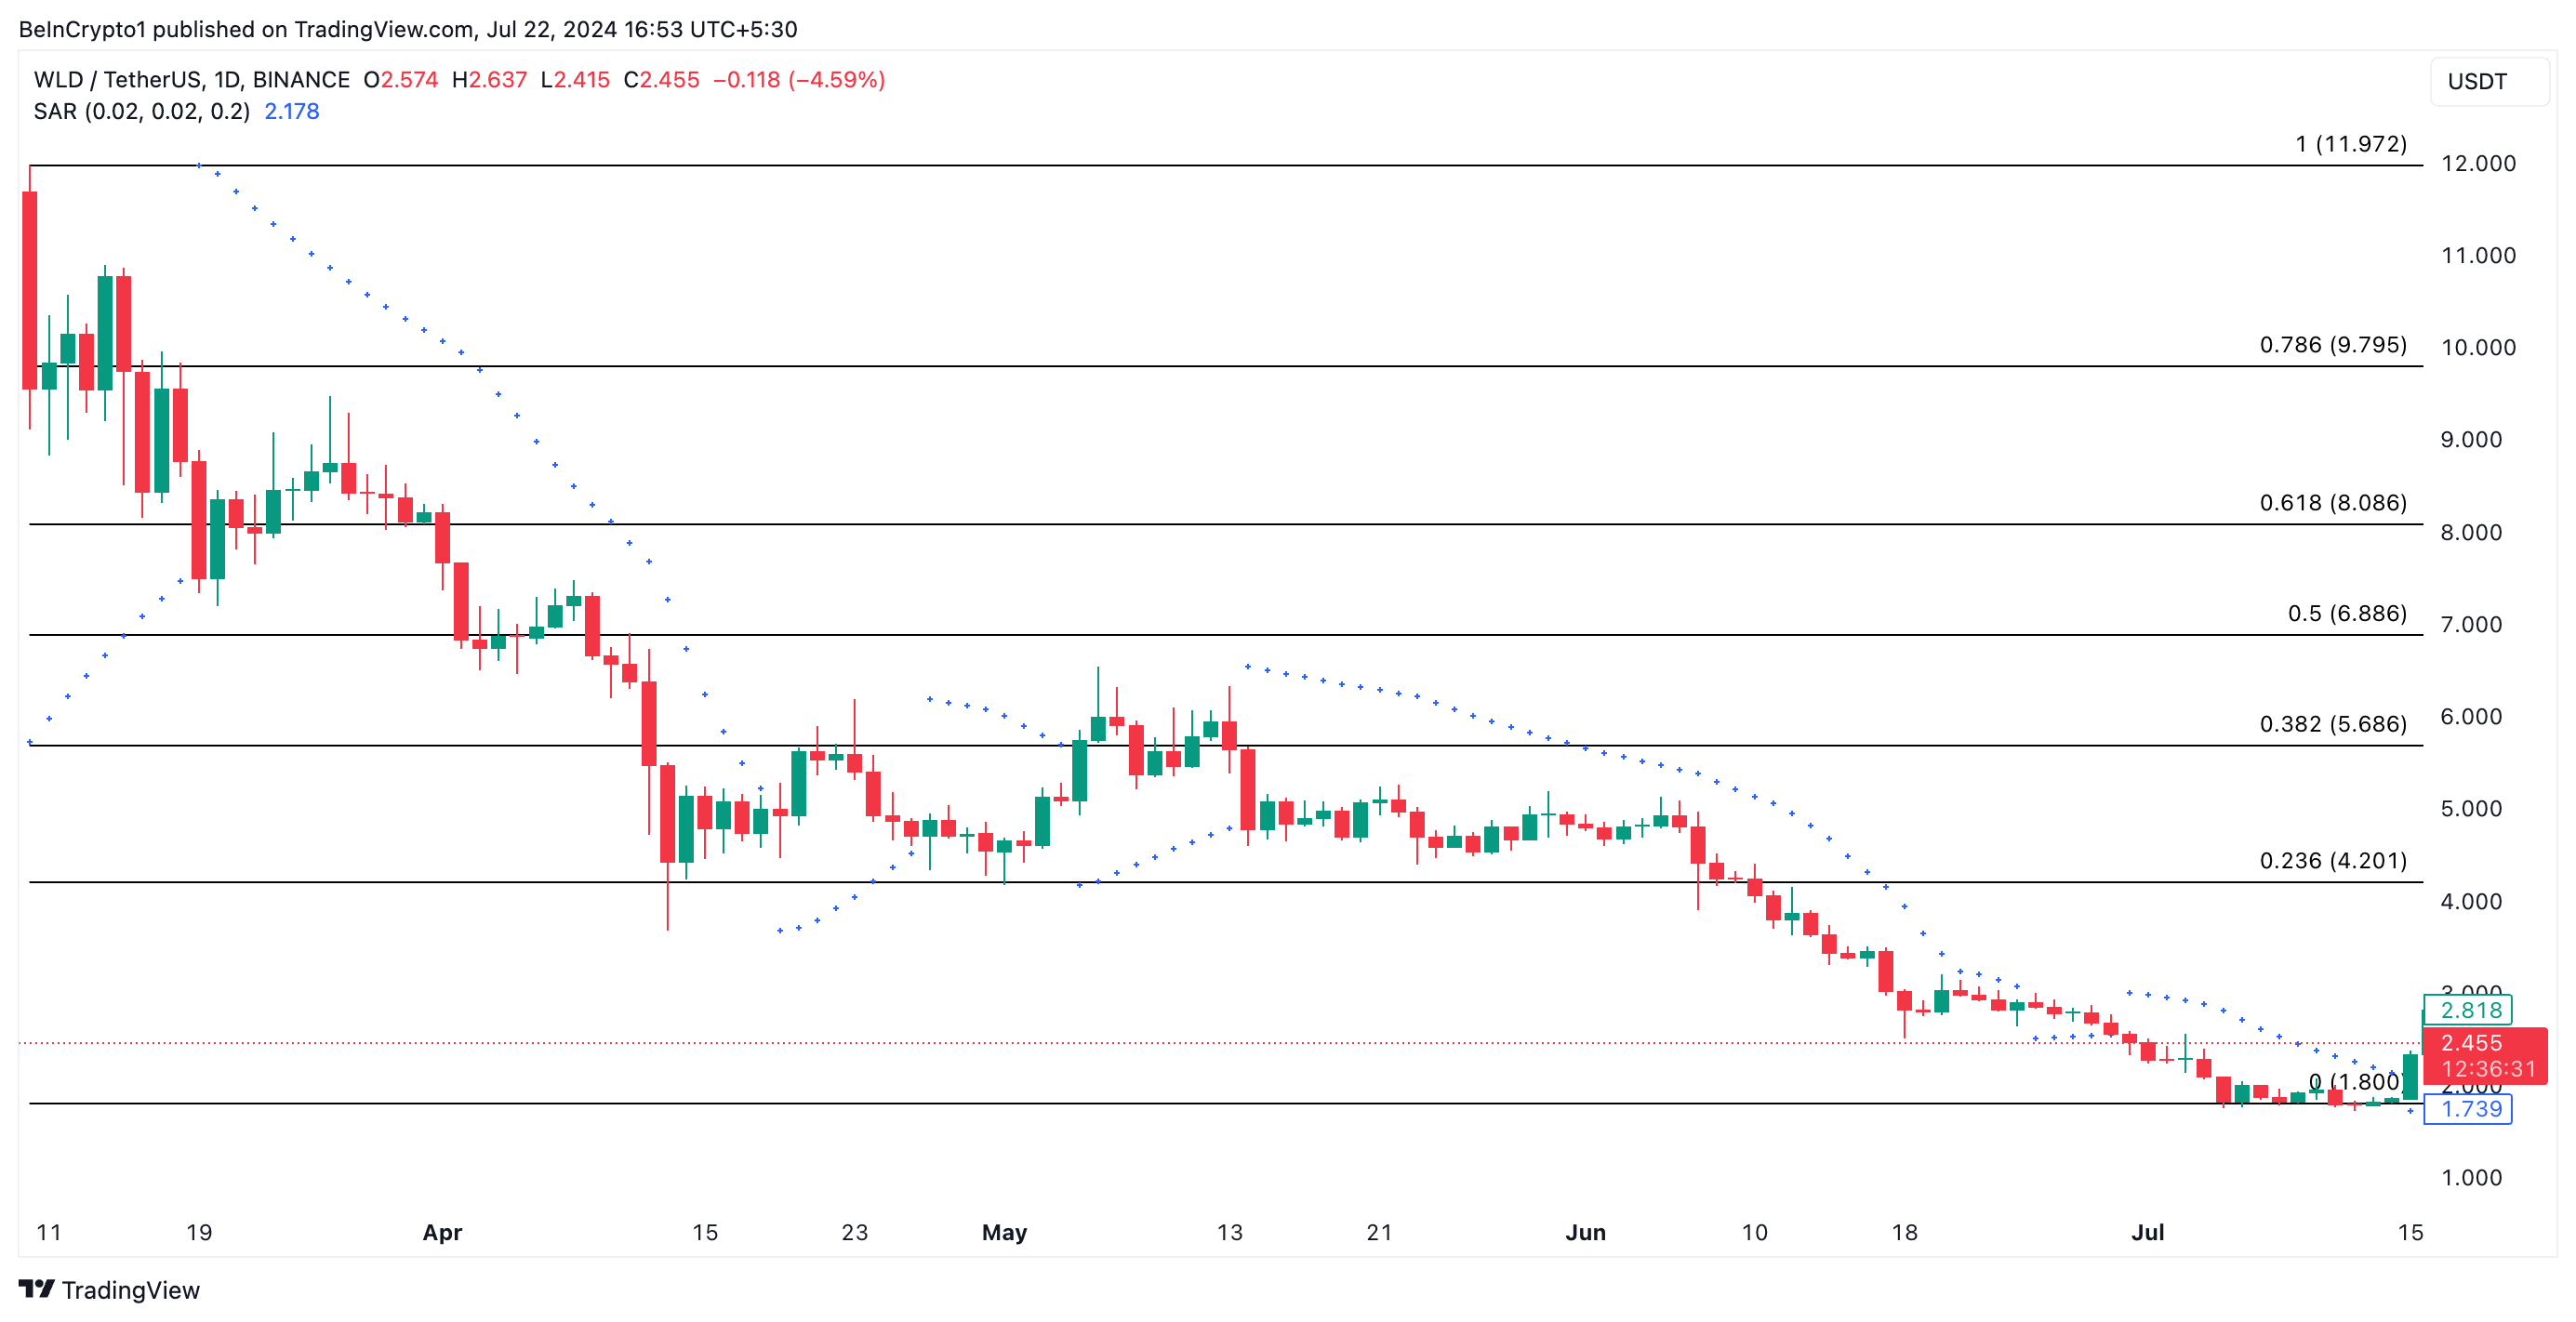
However, if the uptrend continues, these short positions would face liquidations as the token’s price rallies toward $4.20.


