The XRP (XRP) price has been declining since April 30 but has reached an important support level which is likely to initiate a bounce.
Current Support
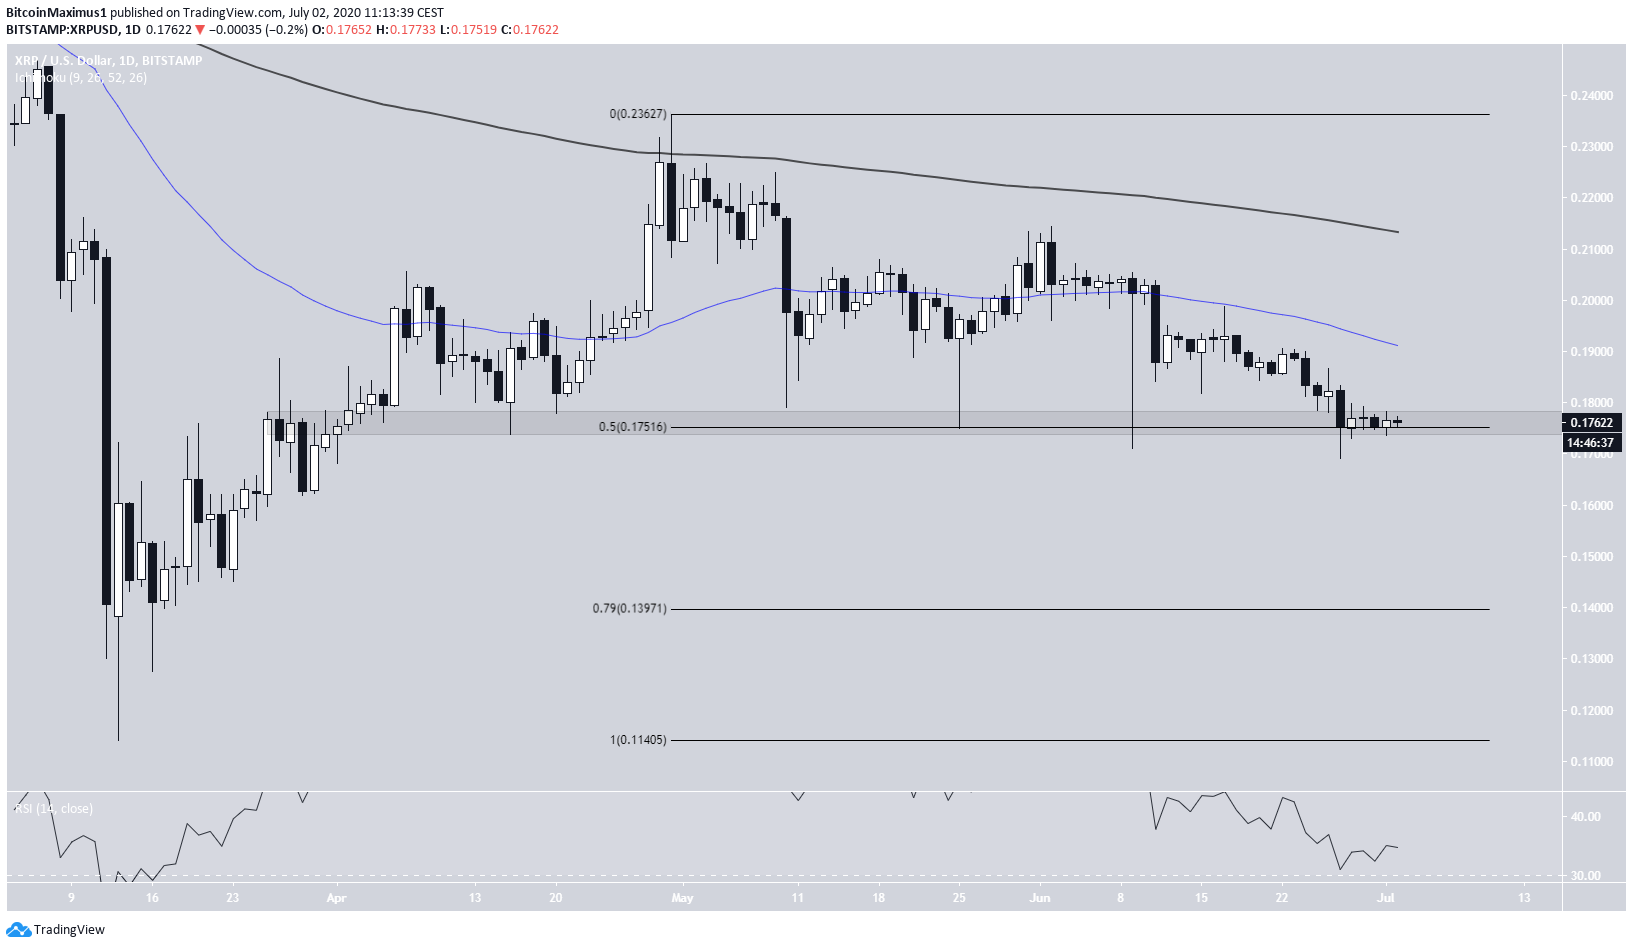
The XRP price has been decreasing since it reached a high of $0.236 on April 30, which coincided with the 200-day moving average (MA). The decline has been gradual, and during this time, the $0.175 support area has been validated numerous times.
This area is also the 0.5 Fib level of the entire upward move which, began on March 13. While this is a possible reversal area, the trend appears bearish since the price is also trading below the 50-day MA, and the RSI is well below 50.
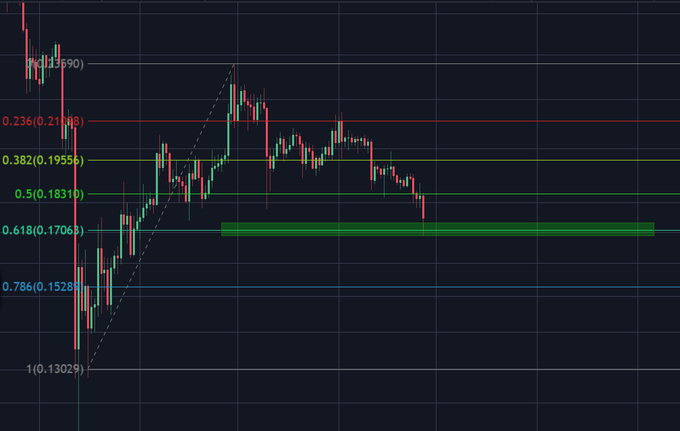
Cryptocurrency analyst @Crypto_Anon_ believes there is no reason to worry about XRP since the price has only retraced to an important support level, as we outlined previously.
Short-Term Movement
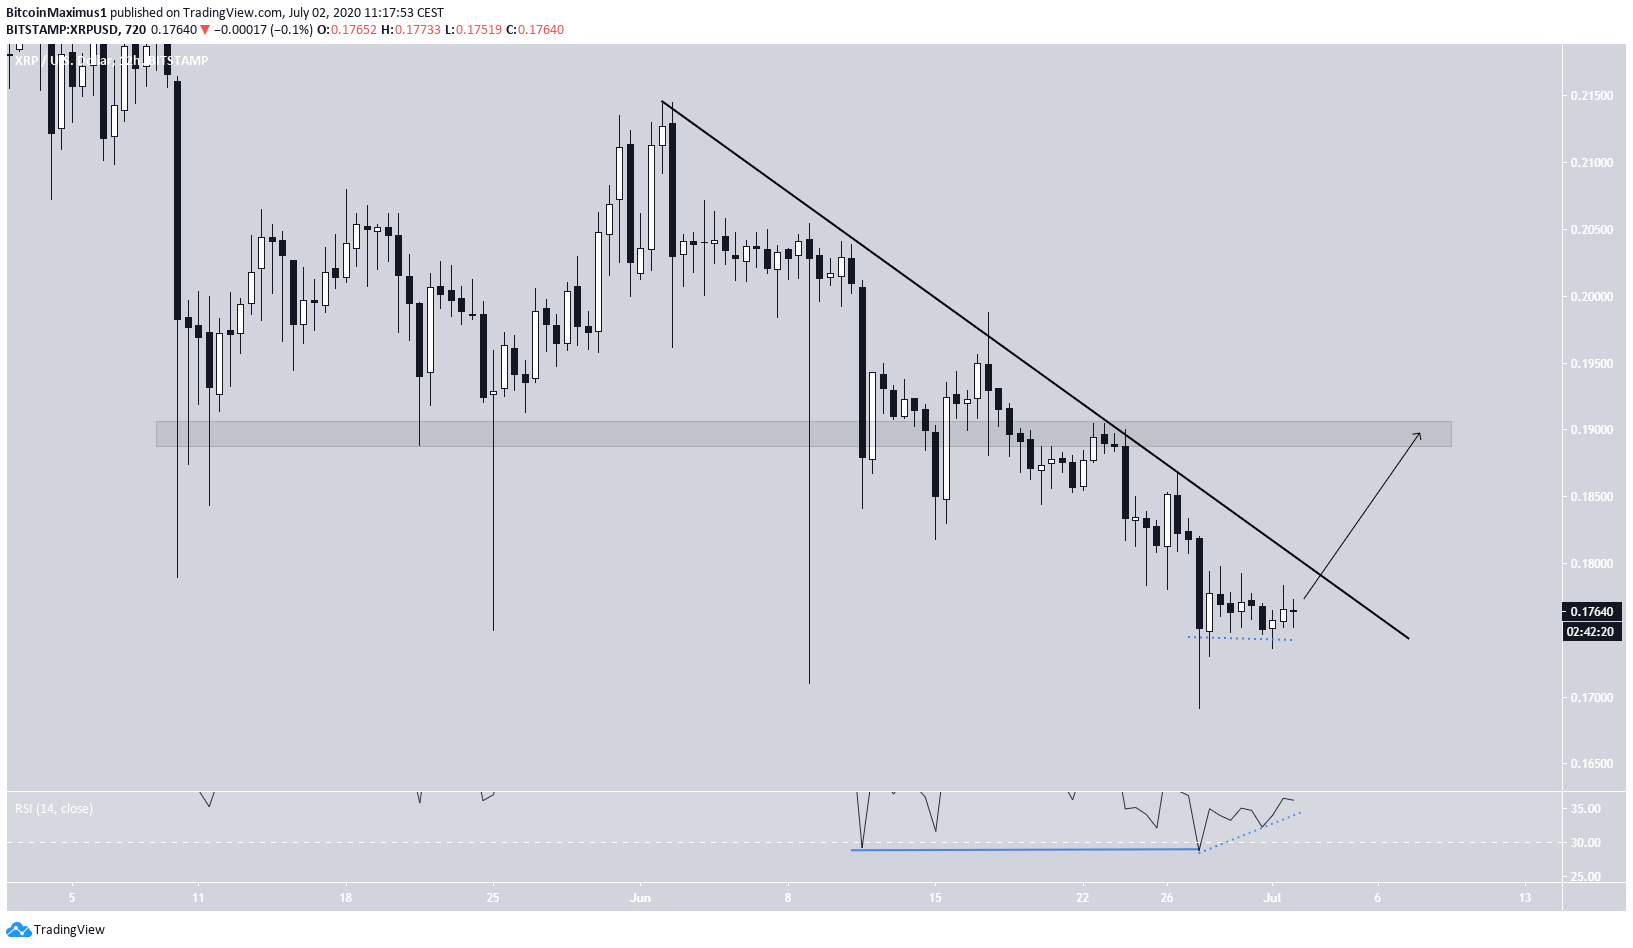
In the short-term, we can see that XRP has created a double bottom, which is a bullish reversal pattern. Furthermore, the bullish divergence on the RSI also confirms this pattern, both in the short and the long-term.
The price has also been following a descending resistance line since the beginning of June. While the double bottom suggests that a breakout is likely, there is strong resistance at $0.19. The trend cannot be considered bullish unless the price breaks out above this level and validates it as support.
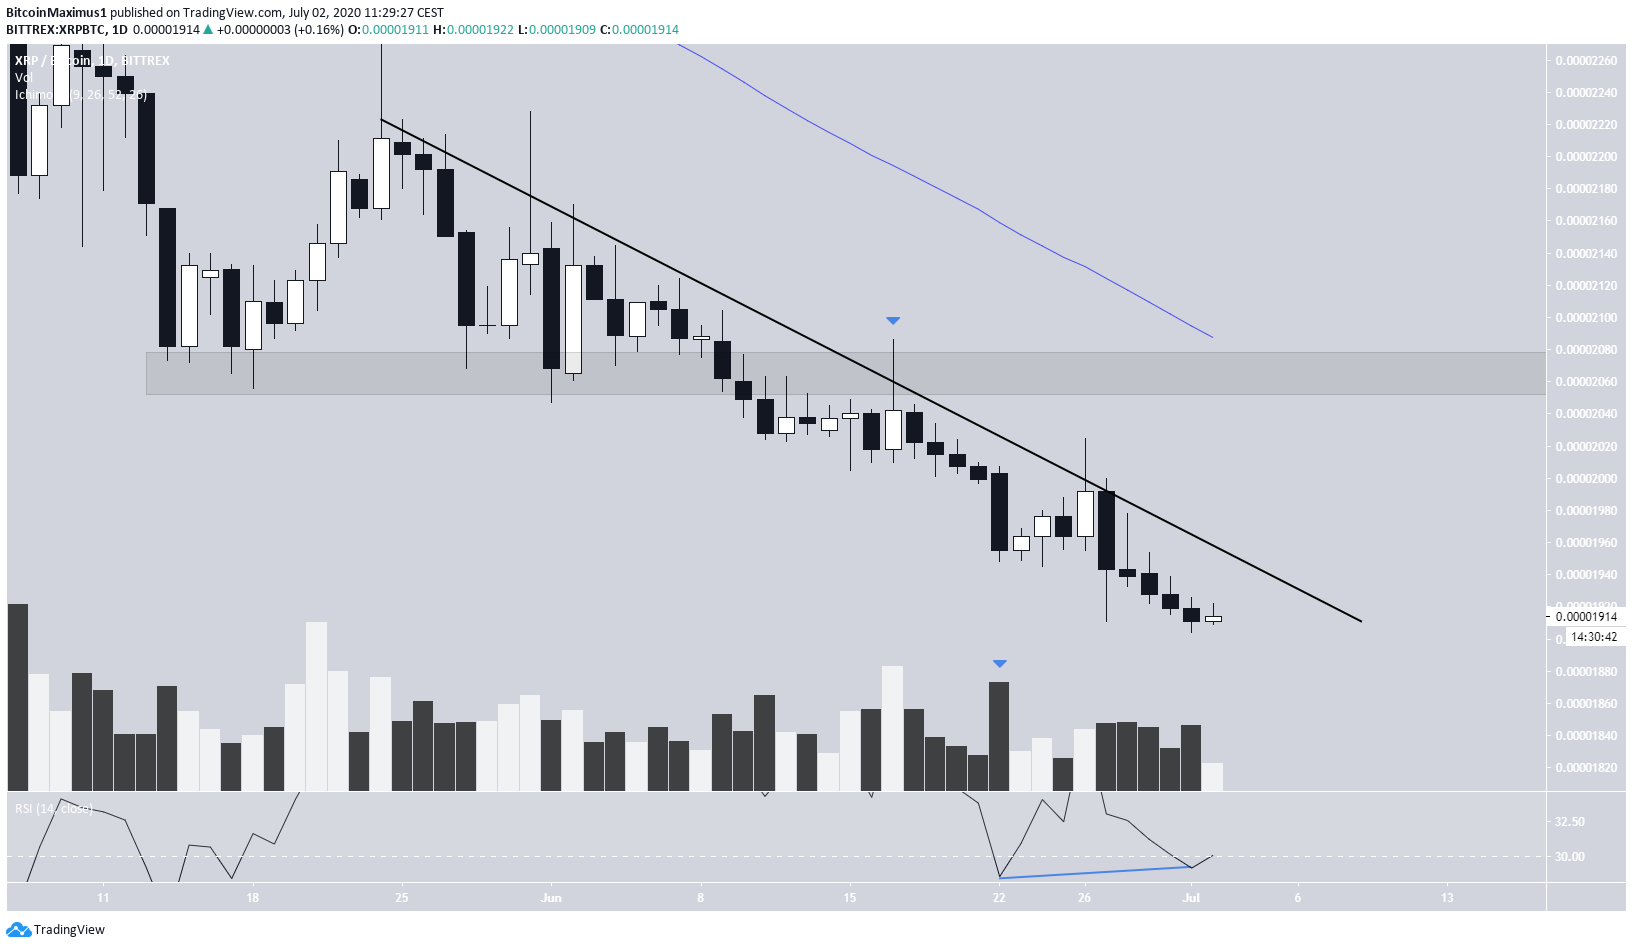
XRP/BTC
The XRP/BTC pair is following a similar descending resistance line, which has been in place for a longer period of time and has a steeper slope.
The outlook is even more bearish. Volume has been much higher during bearish candlesticks and a long upper wick on June 17 which served to validate the 2070 satoshi area as resistance. This area also coincides with the 50-day MA, which is moving downwards rapidly.
While there is some bullish divergence developing on the RSI, there are no other reversal signs. Even if the price were to break out, it would face considerable resistance at 2070 satoshis, making a sustained upward move difficult.