
On Apr 24, 2019, XRP reached a high close to $0.329 and €0.288. A sharp drop ensued. The price made lows of $0.276 and €0.252 on Apr 26.
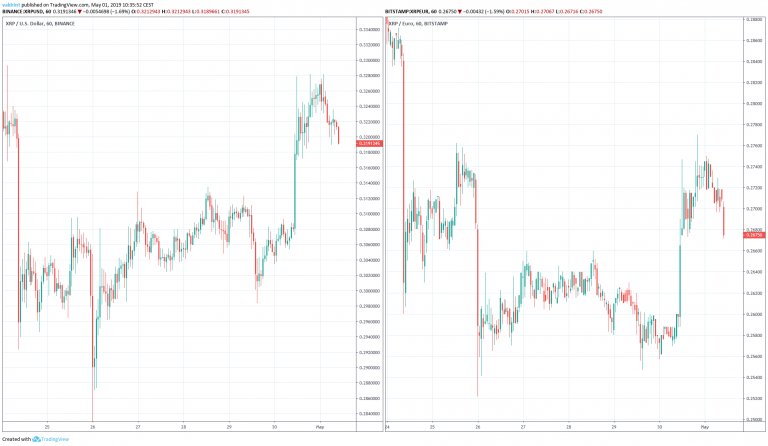
The price has been increasing since, reaching highs close to $0.33 and €0.28 on Apr 30.
Will a rebound lead to a successful recovery or will XRP drop further?
Let’s find out!
XRP (XRP): Highlights and Trends For May 1, 2019
- The price of XRP has been on an uptrend since Apr 26.
- It is following an ascending support line.
- XRP broke out from a descending wedge on Apr 30.
- The breakout occurred on significant but not extreme value.
- There is support near $0.310 and €0.263.
Ascending Support
On Apr 24, the price reached a high of $0.306. Several market cycles were subsequently completed. The price has created higher highs each time.
Tracing these highs gives us an ascending resistance line.
The price broke out from the resistance on Apr 30. It subsequently validated it as support the same day.
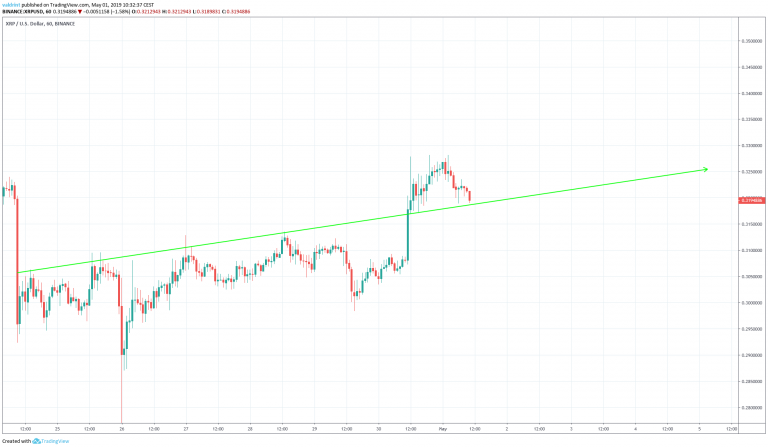
It is likely that the price will continue increasing at the rate predicted by the line until a decisive move occurs.
In order to predict the direction of the move, a look at technical indicators in a longer time-frame is required.
Technical Indicators
In this section, the price of XRP/USD is analyzed at four-hour intervals from Apr 1 to Apr 29 alongside RSI and the MACD to predict possible future price movements for XRP.
It is shown in the chart below:
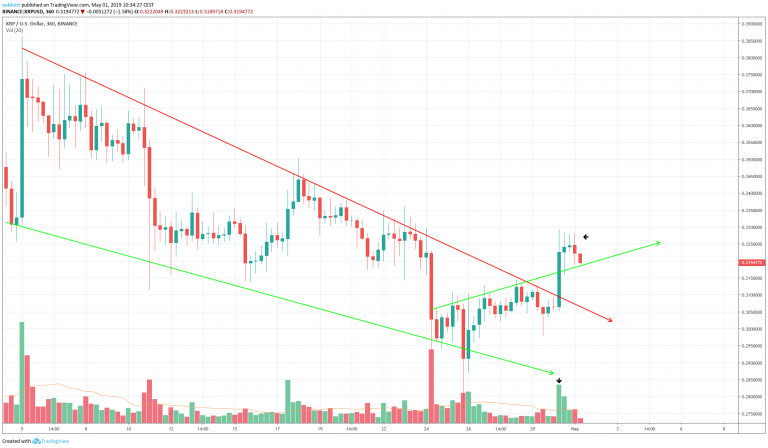
We can see that the price has been trading inside a descending wedge sin Apr 5. The price broke out from the wedge on Apr 30.
The breakout occurred on significant but not extreme volume.
Furthermore, we can see that the past four candles have had long upper wicks. This might indicate that there is strong selling pressure.
Based on this indicator and candlestick characteristics, we believe that the price of XRP will break down from the support line.
Reversal Areas
We now incorporate support areas into our analysis to better determine future price fluctuations.
One support area is traced below for Ripple in both dollars and euros in the graphs below:
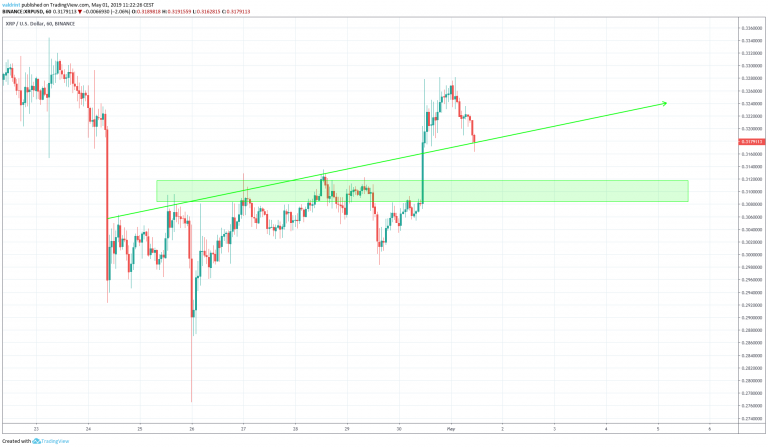
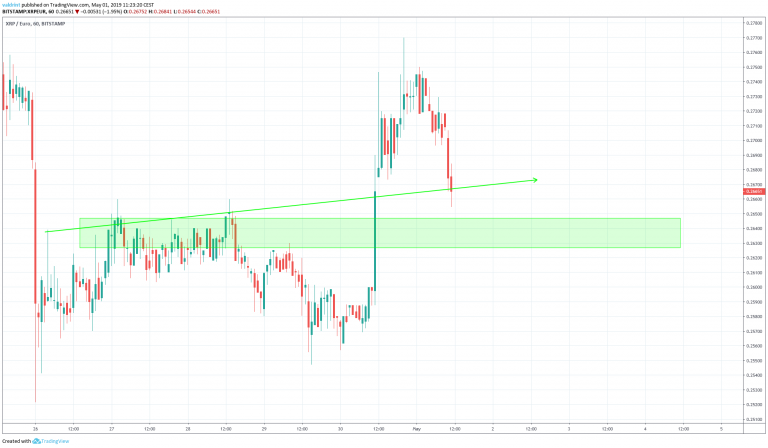
The closest support area is found near $0.310 and €0.263. If the price breaks down from the support line, it is likely to provide reversal. We believe that the price will eventually reach these levels.
Summary of Analysis
Based on this analysis, XRP is likely to decrease towards the support area we have outlined above. While the price may drop, it should still hang above the psychological thresholds of $0.30 and €0.25.
For price 2019, 2020, and five-year Ripple price predictions click on the blue button below:
Disclaimer: This article is not trading advice and should not be construed as such. Always consult a trained financial professional before investing in cryptocurrencies, as the market is particularly volatile.
