
The TRUMP meme coin has experienced an extremely volatile month, down nearly 28% over the last 30 days. With the US president’s new rhetoric, ‘Liberation Day,’ set for April 2, anticipation is building across political and financial circles.
Some traders are betting that Trump’s Liberation Day could reignite interest in politically themed tokens. The big question now is whether this momentum can push TRUMP past key resistance levels—or if uncertainty will continue to weigh it down.
TRUMP BBTrend Is Negative And Struggling To Go Up
The market is growing increasingly anxious ahead of the so-called “Liberation Day” on April 2. Reports suggest Trump may postpone or scale back some of the more aggressive sector-wide tariffs.
Still, no final decision has been made, and Trump has a history of last-minute shifts, keeping investors on edge. A delay or reduction in tariff scope could ease market tension, potentially boosting risk-on sentiment—something that may especially benefit meme coins, including the politically themed TRUMP token.
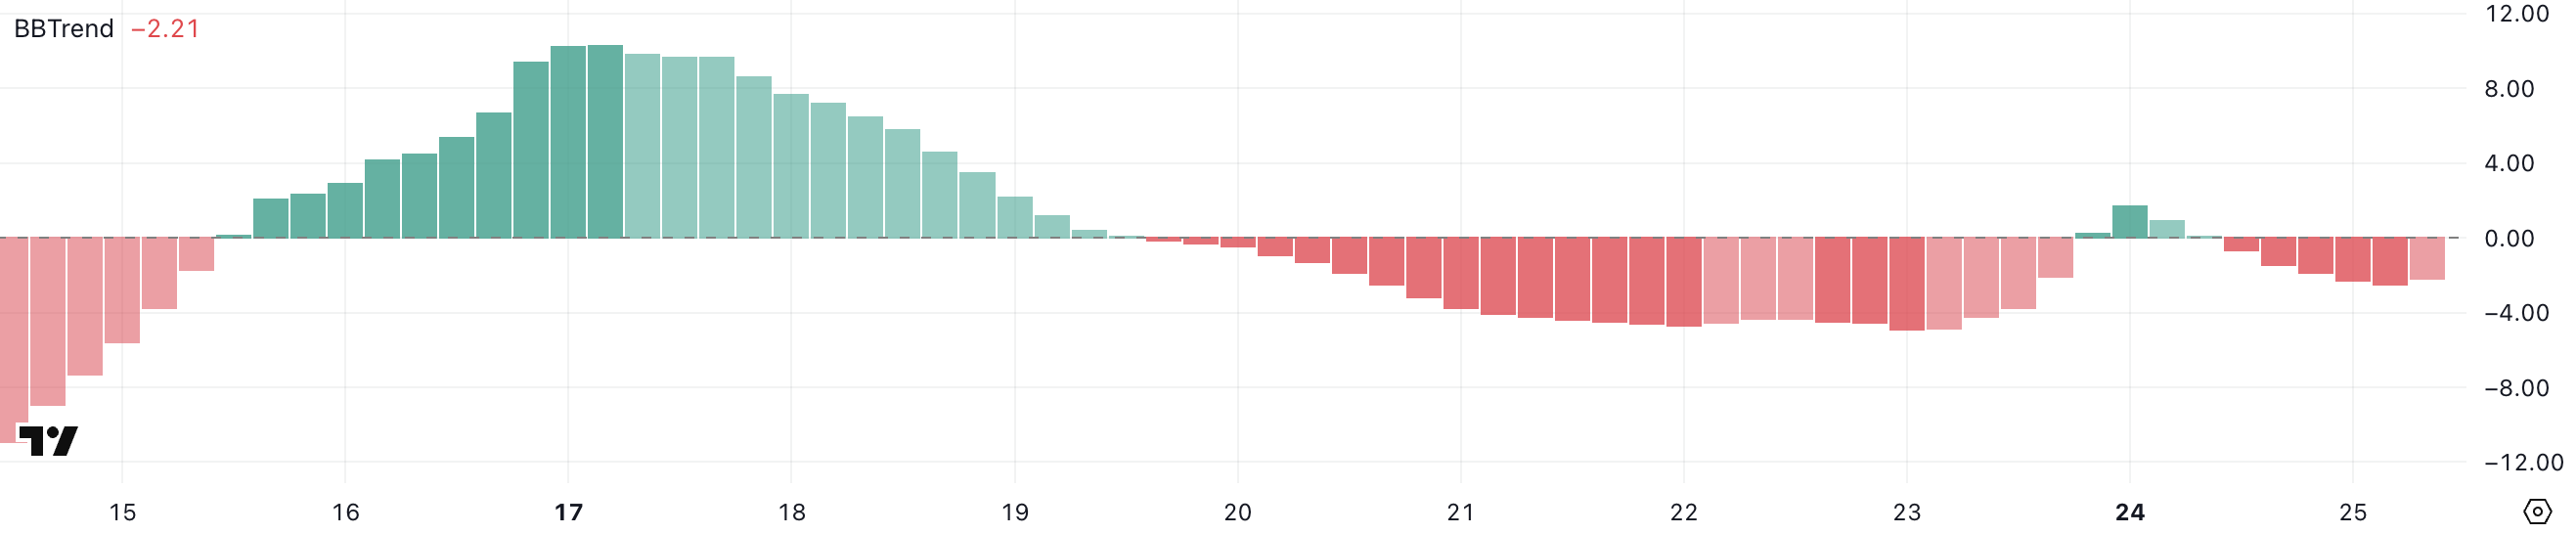
TRUMP’s BBTrend is currently at -2.21 after briefly flipping positive yesterday, only to drop back down and reach a recent negative low of -2.50 just a few hours ago. BBTrend, or Bollinger Band Trend, is a technical indicator used to assess the strength and direction of a trend.
Readings above 3 suggest strong bullish momentum, while values below -3 indicate strong bearish conditions; anything between -1 and 1 typically signals a weak or sideways trend.
With TRUMP’s BBTrend hovering in the negative zone but not at an extreme level, it suggests the token is currently under light bearish pressure.
The brief positive reading followed by a quick reversal could signal uncertainty in market direction, and whether TRUMP can regain traction may depend on how traders interpret Trump’s upcoming trade policy decisions.
Ichimoku Cloud Shows TRUMP Doesn’t Have A Clear Direction
TRUMP’s Ichimoku Cloud chart reveals a market in hesitation. After a brief rally, the price is currently hovering around the cloud’s lower boundary.
The Tenkan-sen (blue) and Kijun-sen (red) lines are flat and tightly compressed, indicating a lack of short-term trend strength and reflecting an indecisive market.
The price is also sitting right on top of the cloud, suggesting it is in a transition zone where it could either rebound or break down depending on upcoming momentum.
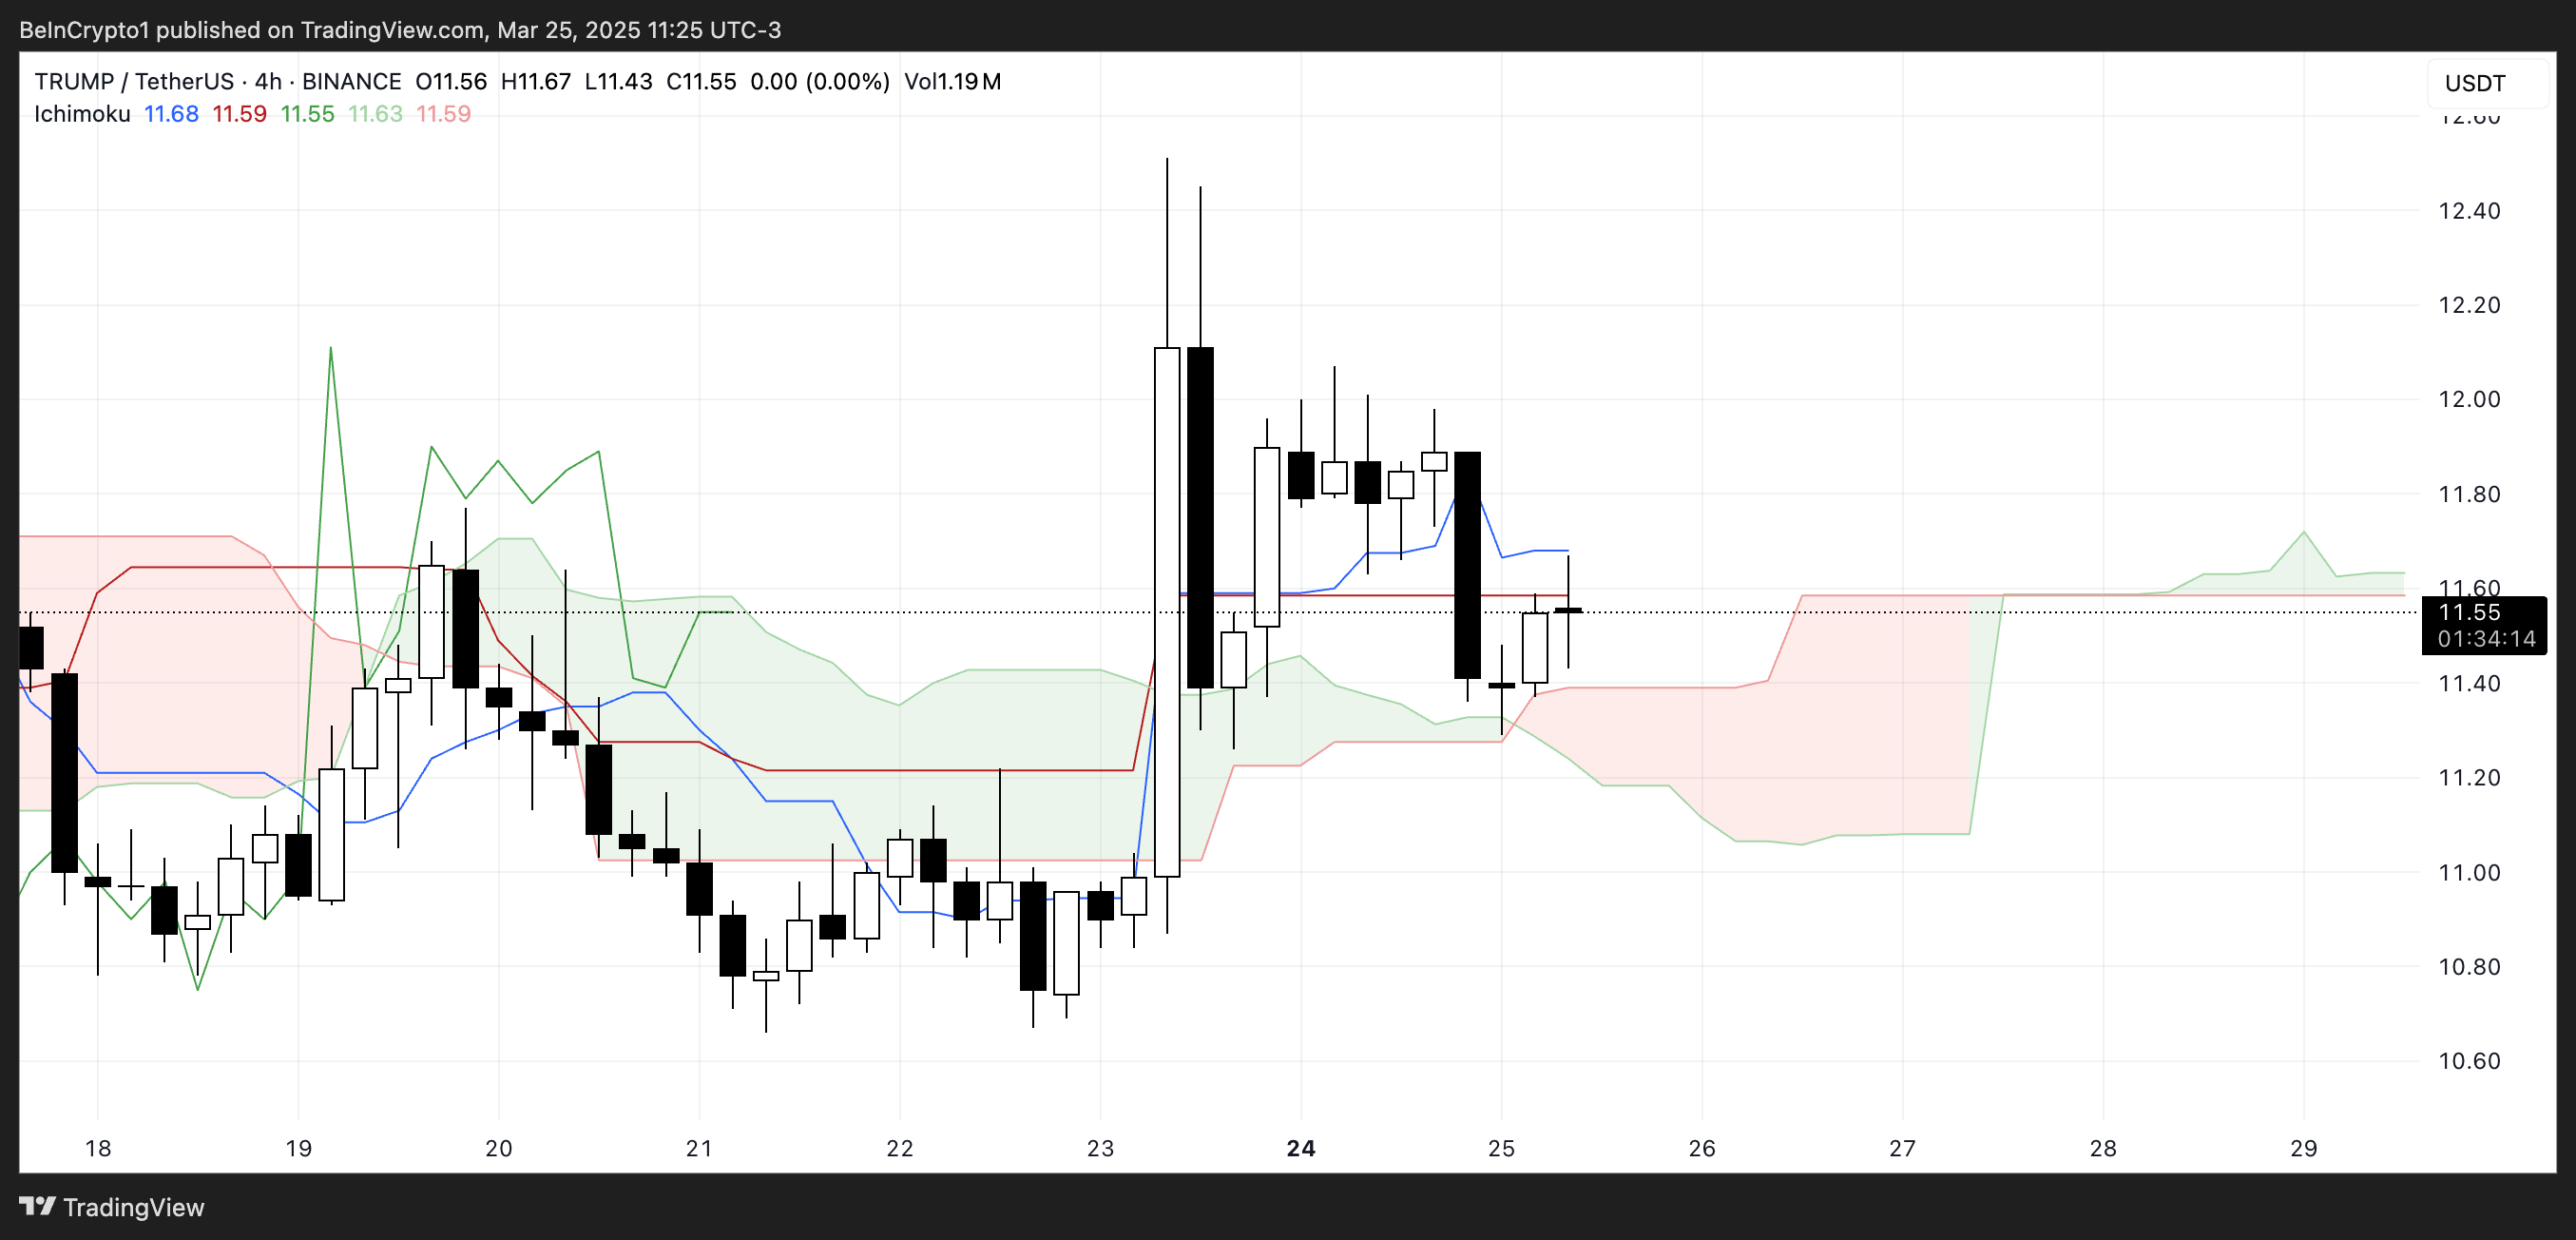
The future cloud (Kumo) is flat and thin, which signals weak support and limited conviction in either direction. A thin cloud can often be pierced easily, meaning price movements in either direction may not face strong resistance or support.
Additionally, the Chikou Span is closely trailing past price action, reinforcing the idea that momentum has stalled.
Overall, the Ichimoku setup paints a picture of uncertainty for TRUMP, with no clear trend dominance until a breakout above or below the cloud confirms the next move.
Can TRUMP Hit $20 Before Liberation Day?
Despite the anticipation surrounding the upcoming Liberation Day on April 2, the TRUMP meme coin continues to struggle around or below the $12 mark.
Both the BBTrend and Ichimoku Cloud indicators suggest a lack of strong momentum, reinforcing the idea that TRUMP is currently in a consolidation phase with limited bullish pressure.
However, if optimism builds as the event approaches—or if news tied to it proves favorable for the broader crypto market—TRUMP could break out of its current range.
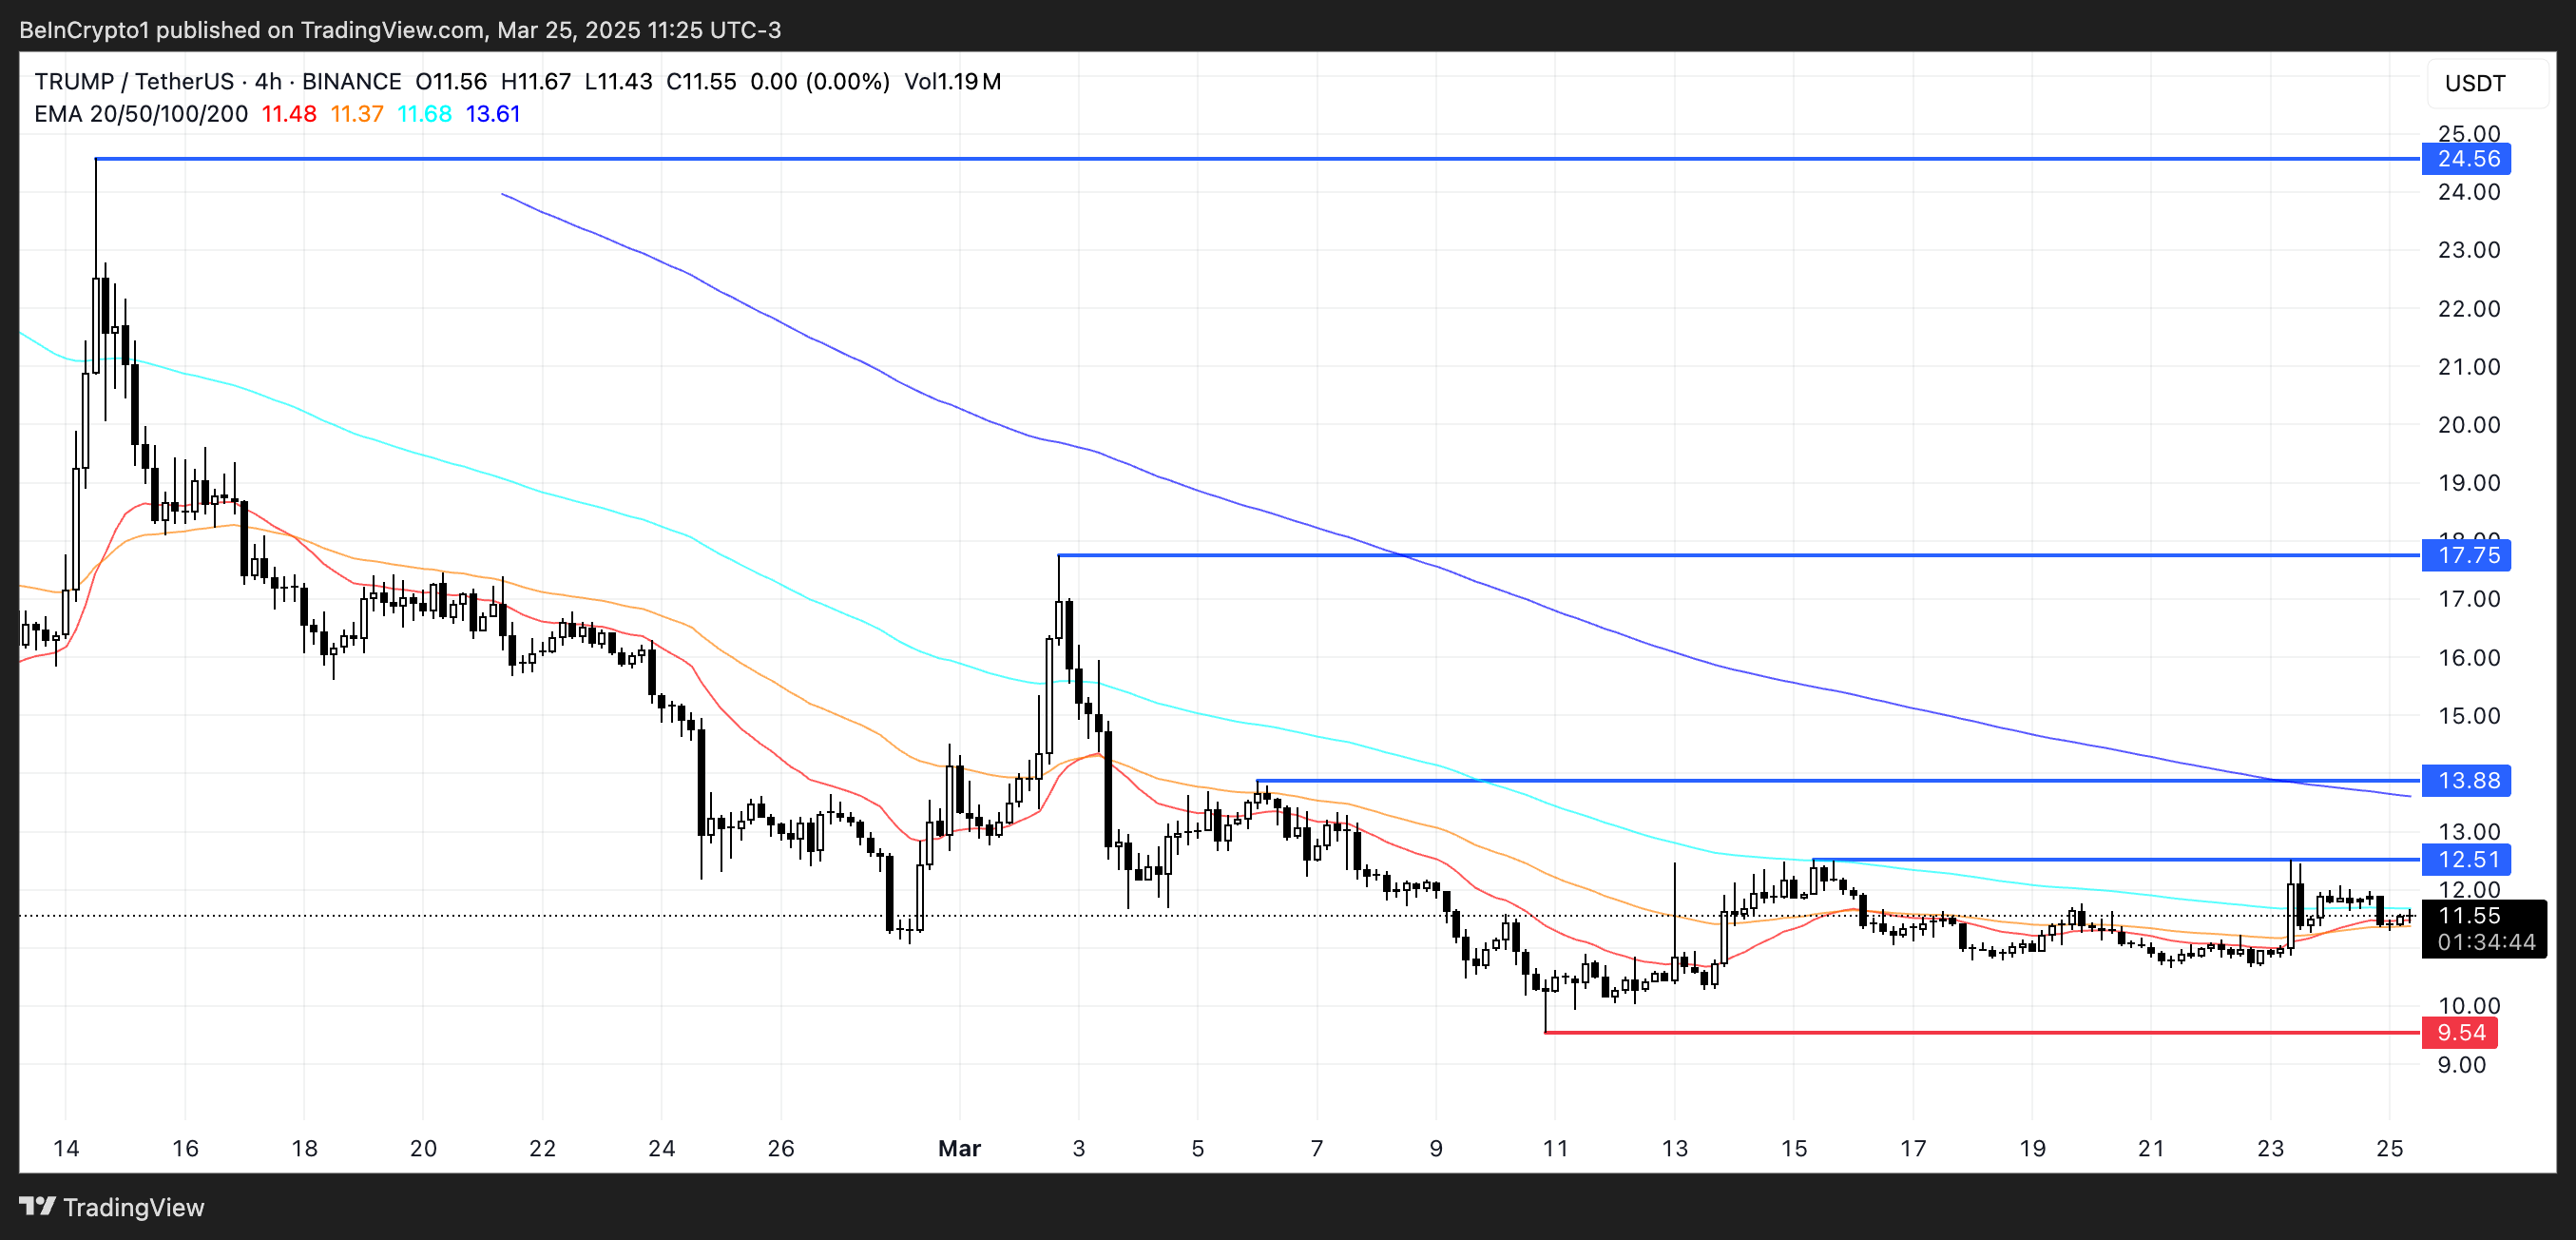
A successful move above the $12.51 and $13.88 resistance levels could open the door for a rally toward $17.75, and if momentum accelerates, possibly even $24.56—marking its first return above $20 since February 15.
On the flip side, a failure to generate buying interest or a shift in sentiment could lead to increased selling pressure. If that happens, TRUMP may revisit the key support at $9.54.
A breakdown below that level would be particularly significant, as it would mark the first time the token trades under $9 since its initial launch.
