

XRP (XRP) Price Highlights
- There is resistance at 2,890 and 3,350 satoshis.
- There is support at 2,500 satoshis.
- The price is possibly trading inside a descending wedge.
- XRP has reached a long-term support area.
$XRP #RIPPLE $XRPBTC: Ok guys, time to pay attention IMO. Stops just got ran for XRP w. high sell volume (depends on exchange). I've been waiting for this scenario for a months. Quite possible 2.3k gets tapped as well, but XRP is going to be very strong in the coming weeks IMO pic.twitter.com/iSRuiYqG0k
— Altcoin Sherpa (@AltcoinSherpa) March 8, 2020
Trading Range
The XRP price has been trading in a range between 2,500 and 3,350 satoshis since July 2019, with a few exceptions of price movement above and below this range. On March 8, the price created a long lower-wick below this range only to reclaim it shortly afterward. This is a bullish sign that is indicative of an upward price movement. If the price does start to surge, the closest resistance area is found at 2,890 satoshis, which is also strengthened by the 200-day moving average (MA). However, the XRP price movement cannot yet be confirmed as bullish, since it is trading below the 200-day MA and the daily RSI is 50. So, if an increase were to occur, it would more likely be a short-term increase rather than the beginning of a new upward trend.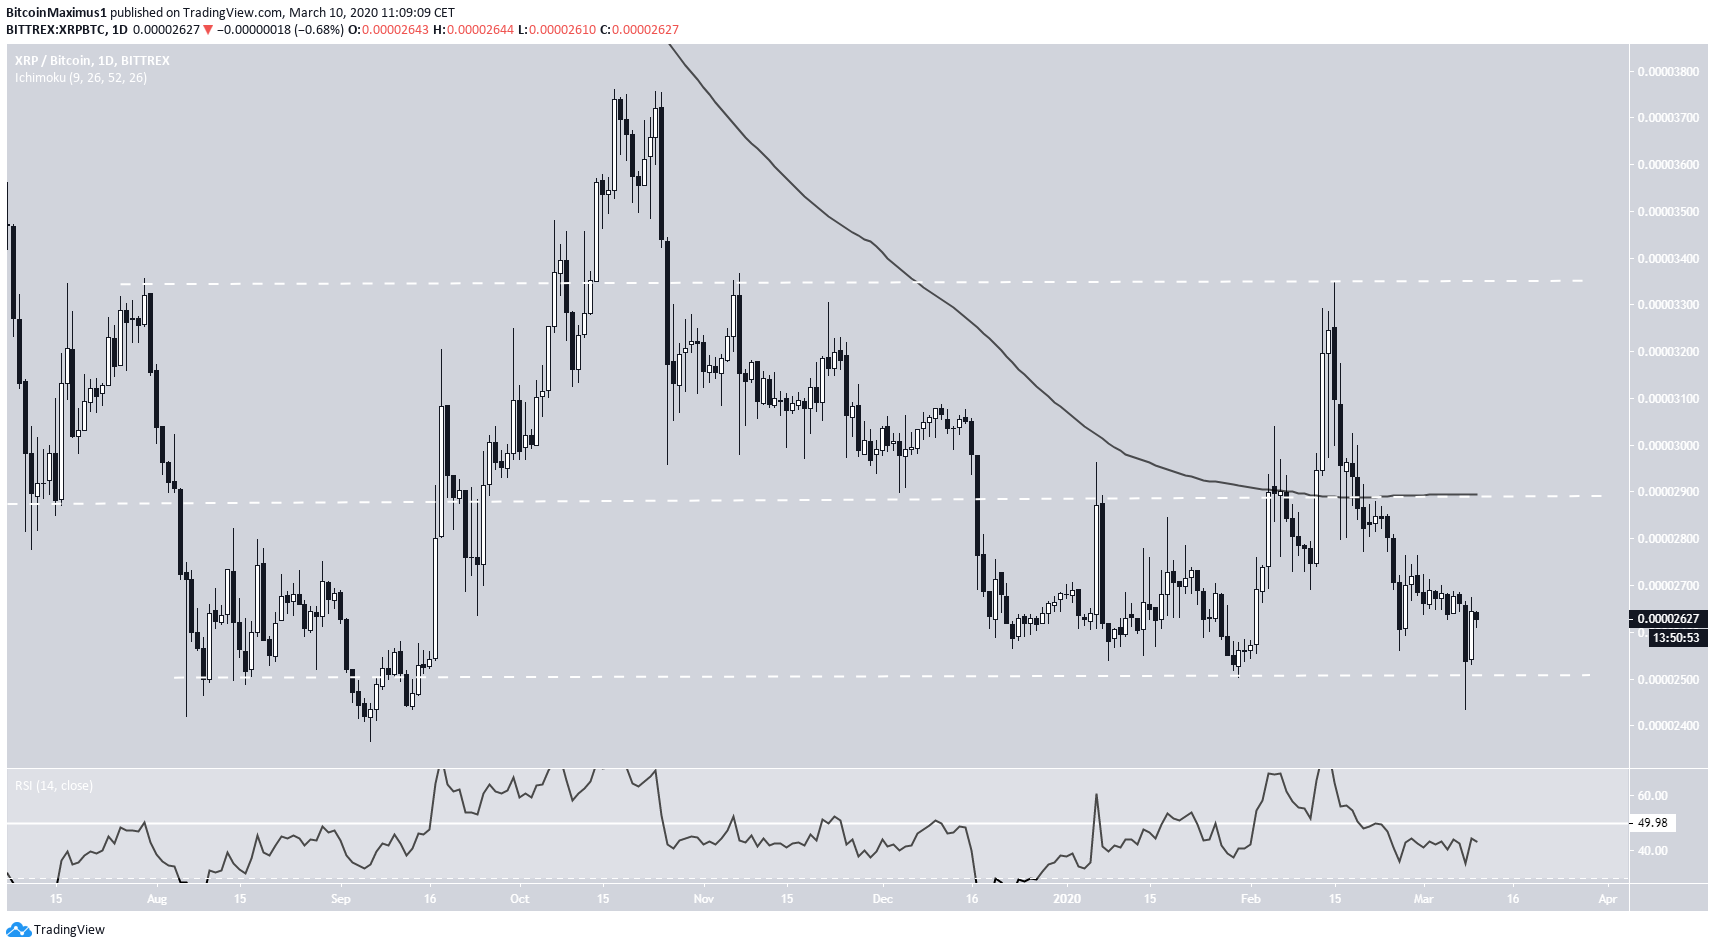
Descending Wedge
In the shorter-term, we can see that the XRP price is possibly trading inside a descending wedge. This increases the possibility of the proposed upward move happening since it is a bullish reversal pattern and is combined with a bullish divergence in the RSI. The resistance area remains the same, being found very near 2,890 satoshis.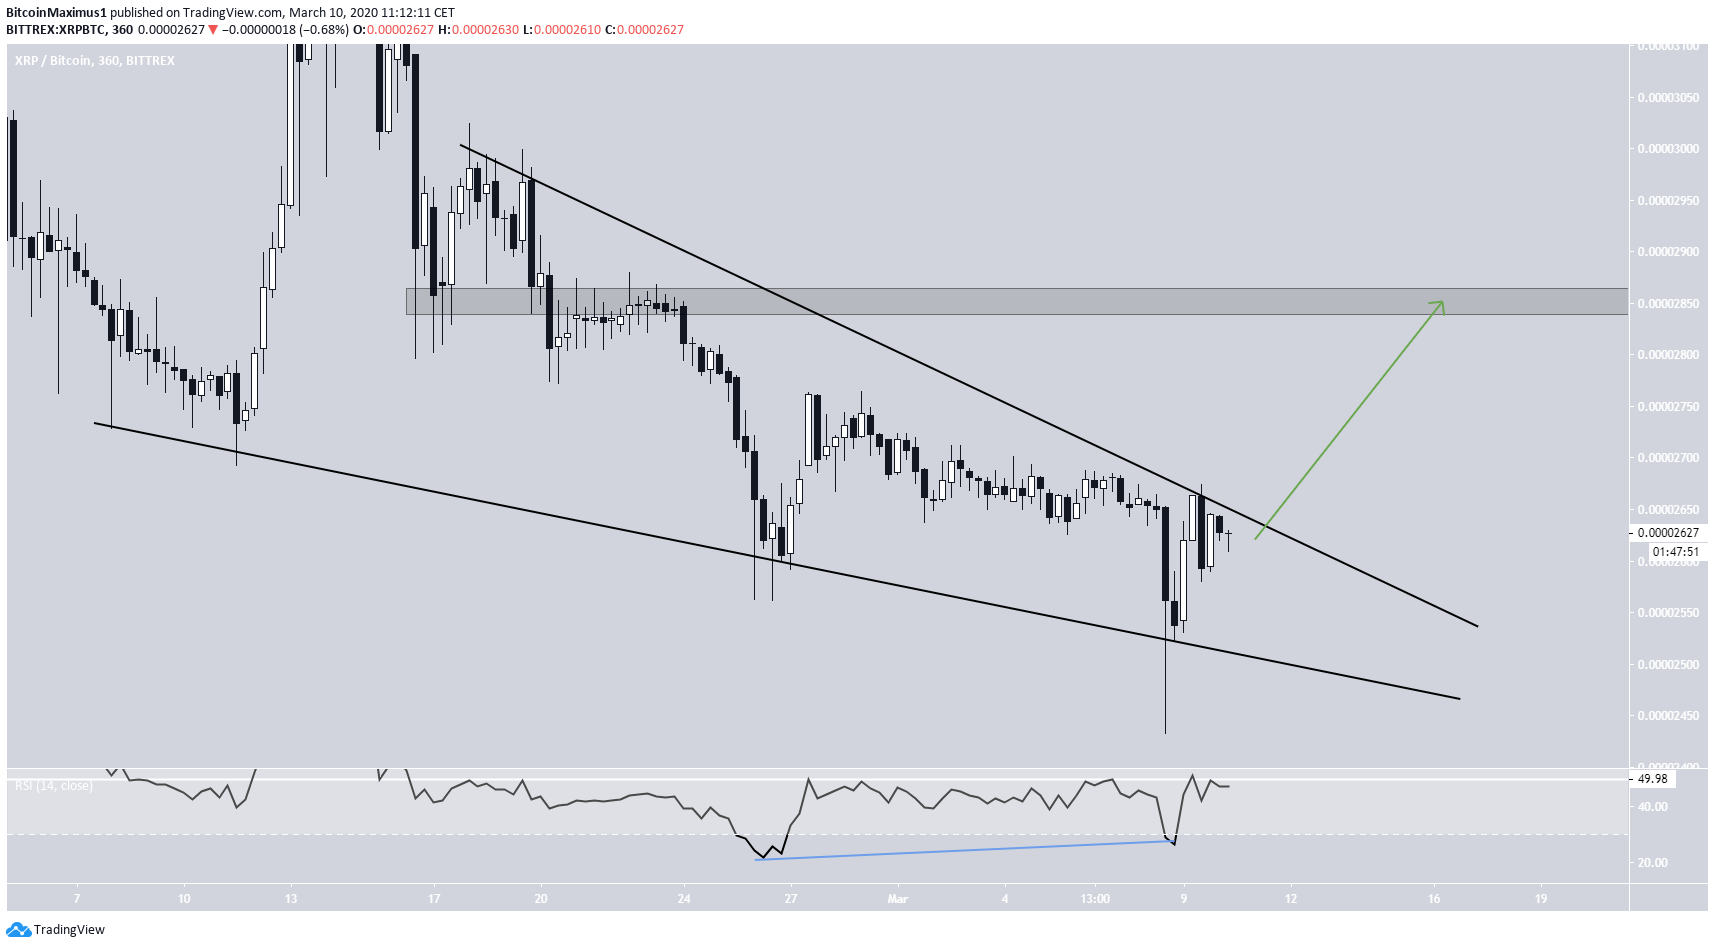
Long-Term Movement
As for the possibility of the price seeing very good weeks ahead, the weekly chart shows that the price is trading inside a significant support area. At first glance, we can make the assumption that as long as the price is trading above this MA, its trend is considered bullish. However, the price has bounced twice from this support area, the second time being much smaller than the first, leading to a weekly candlestick with a long upper wick. This is indicative of weakness on the side of the bulls. A breakout above the long-term resistance area of 3,600 satoshis would confirm that the price has begun a new bullish trend.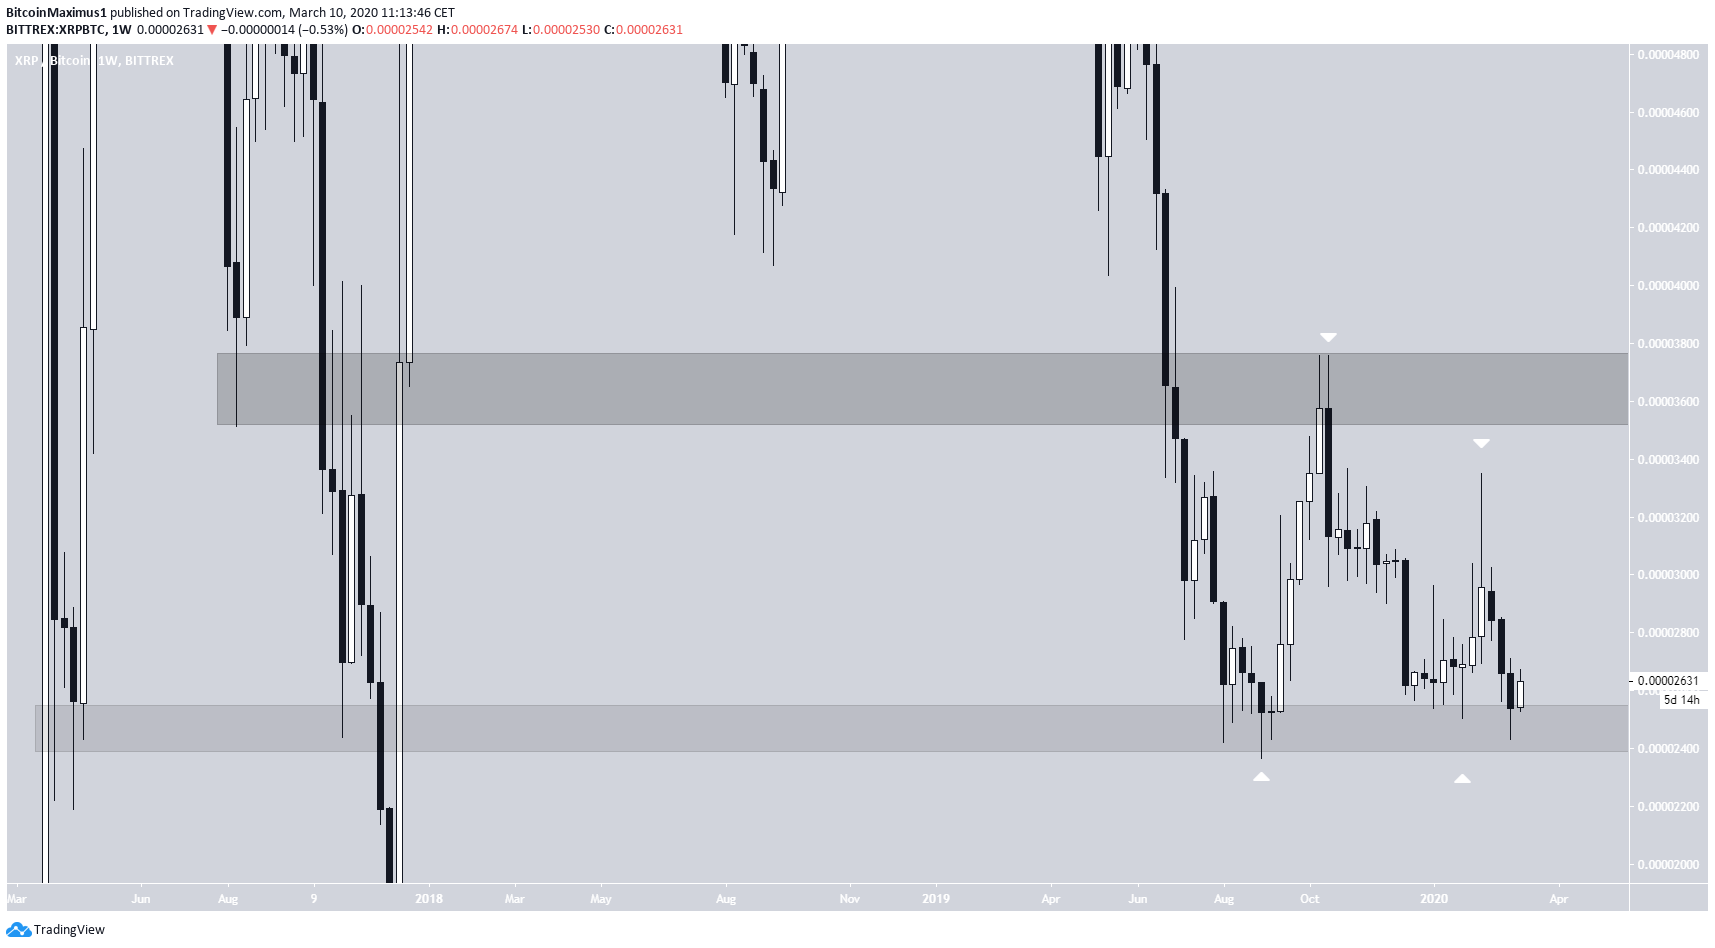 To conclude, the XRP price has reclaimed the bottom of its range and looks primed to begin an upward move in the short/medium-term. At the current time, it cannot be said with certainty that this will be a long-term trend reversal.
Disclaimer
In line with the Trust Project guidelines, this price analysis article is for informational purposes only and should not be considered financial or investment advice. BeInCrypto is committed to accurate, unbiased reporting, but market conditions are subject to change without notice. Always conduct your own research and consult with a professional before making any financial decisions. Please note that our Terms and Conditions, Privacy Policy, and Disclaimers have been updated.
