


![Will the MATIC Price Make a Comeback? [Premium Analysis]](/_mfes/post/_next/image/?url=https%3A%2F%2Fassets.beincrypto.com%2Fimg%2FP6Kecnte3YT16UNk89HfHu02mdE%3D%2Fsmart%2F39696746b92d4045826c37b8249fa892&w=1920&q=75)
After the massive December 10 price decrease, MATIC has struggled to approach its previous highs. We believe it will gradually increase but will be devoid of significant volatility.
Even though MATIC decreased by more than 50 percent since its early December highs, it is still following a gradual upward trend since August — which is still intact.
Cryptocurrency trader @cryptomitchNL discussed the recent MATIC price movement while suggesting that the current support area will determine the direction of future movement. If MATIC hold above 220 satoshis, it is likely to retest the 300 satoshi highs. If not, it will fall to 180 satoshis.
Another, similar, heavy dropdown here after hitting resistance.
If we hold the green area around 220, I won't be surprised by another push towards 300ish.
Losing ground on the green one and I'm aiming 180-185 back again. pic.twitter.com/5jnH0bjpjQ
— Michaël van de Poppe (@CryptoMichNL) December 22, 2019
Will MATIC hold support or will it break down? Keep reading below if you are interested in finding out.
Ascending MATIC Support Line
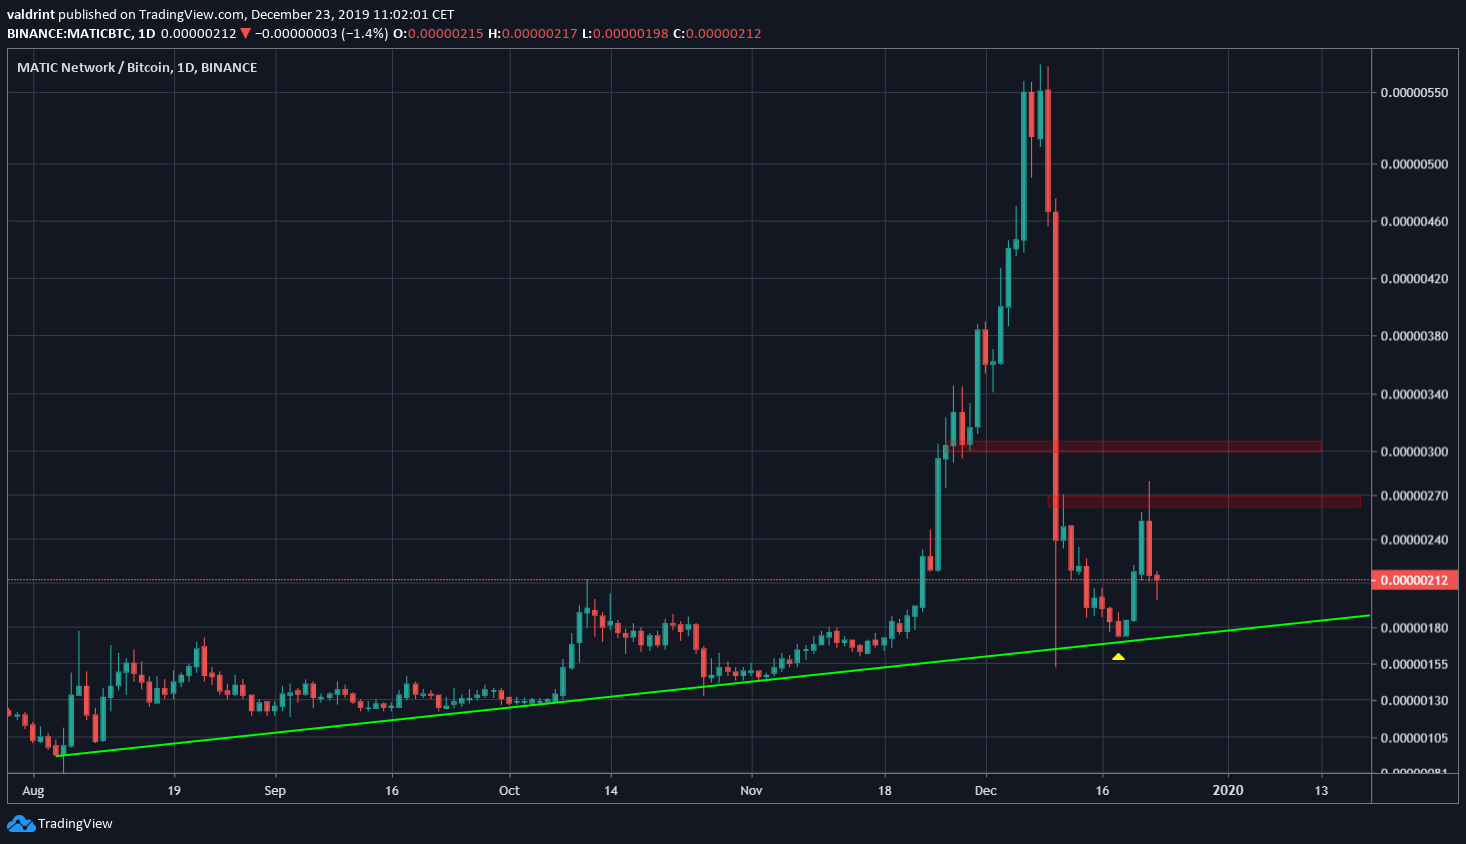
Looking at the MATIC price, we can se that it has been following an ascending support line since August. The support line is currently at 180 satoshis.
After the massive price decrease of December 9-10 — which, at one point, was 73 percent — the price bounced on the ascending support line on December 18 and moved upward. The wick reached a high of 272 satoshis, creating a minor resistance area at 270 satoshis. The next resistance area is found at 300 satoshis, which previously acted as support.
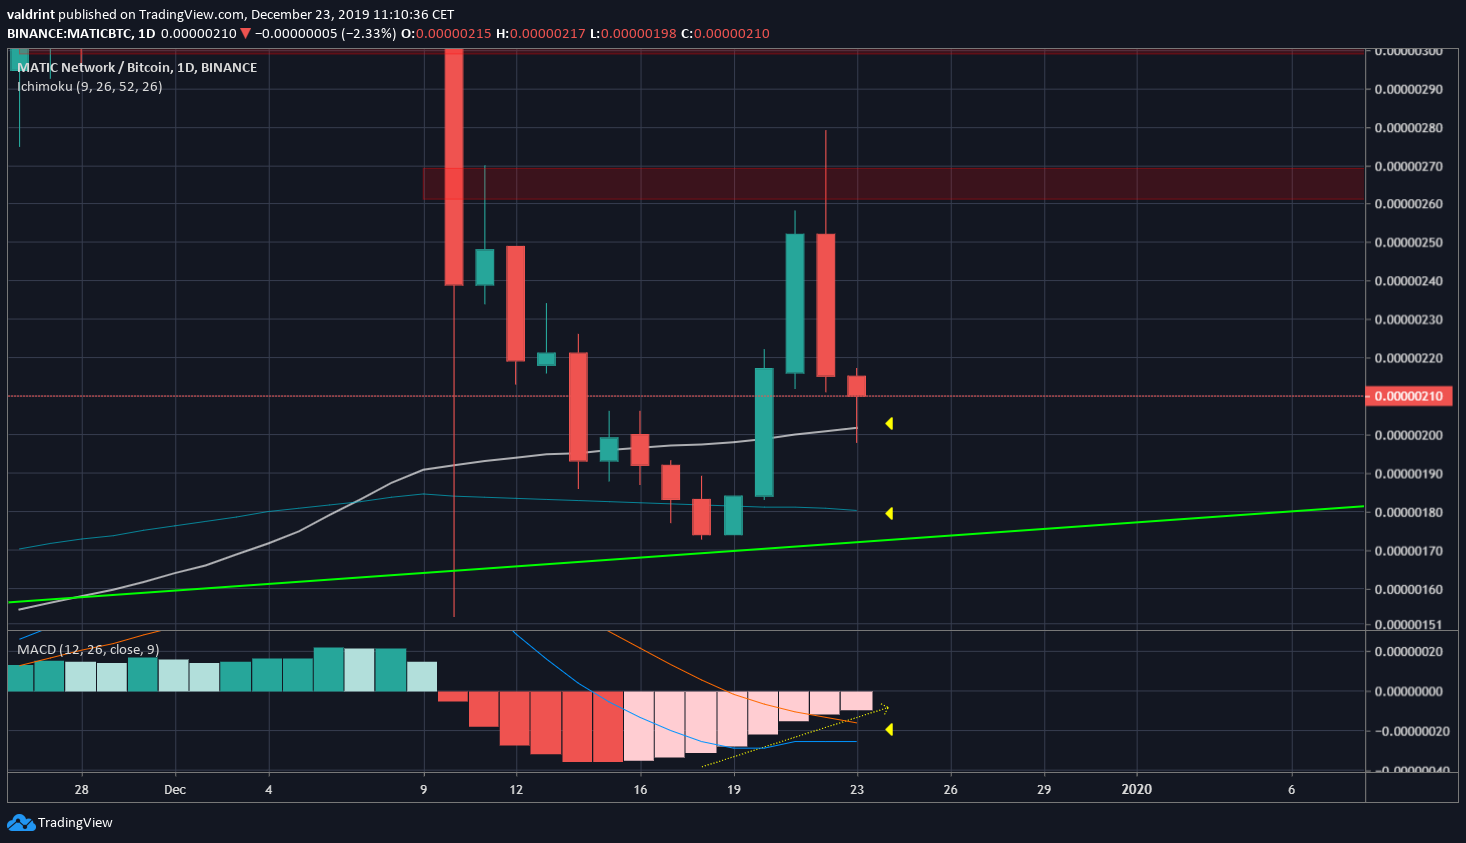
Technical indicators suggest that the MATIC price will stay above the ascending support line. It has also found support above the 100- and 200-day moving averages (MA), which have made a bullish cross. Both MAs are above the ascending support line.
Furthermore, the MACD is close to making a bullish cross and has registered a lower rate of losses on its histogram.
Future Movement
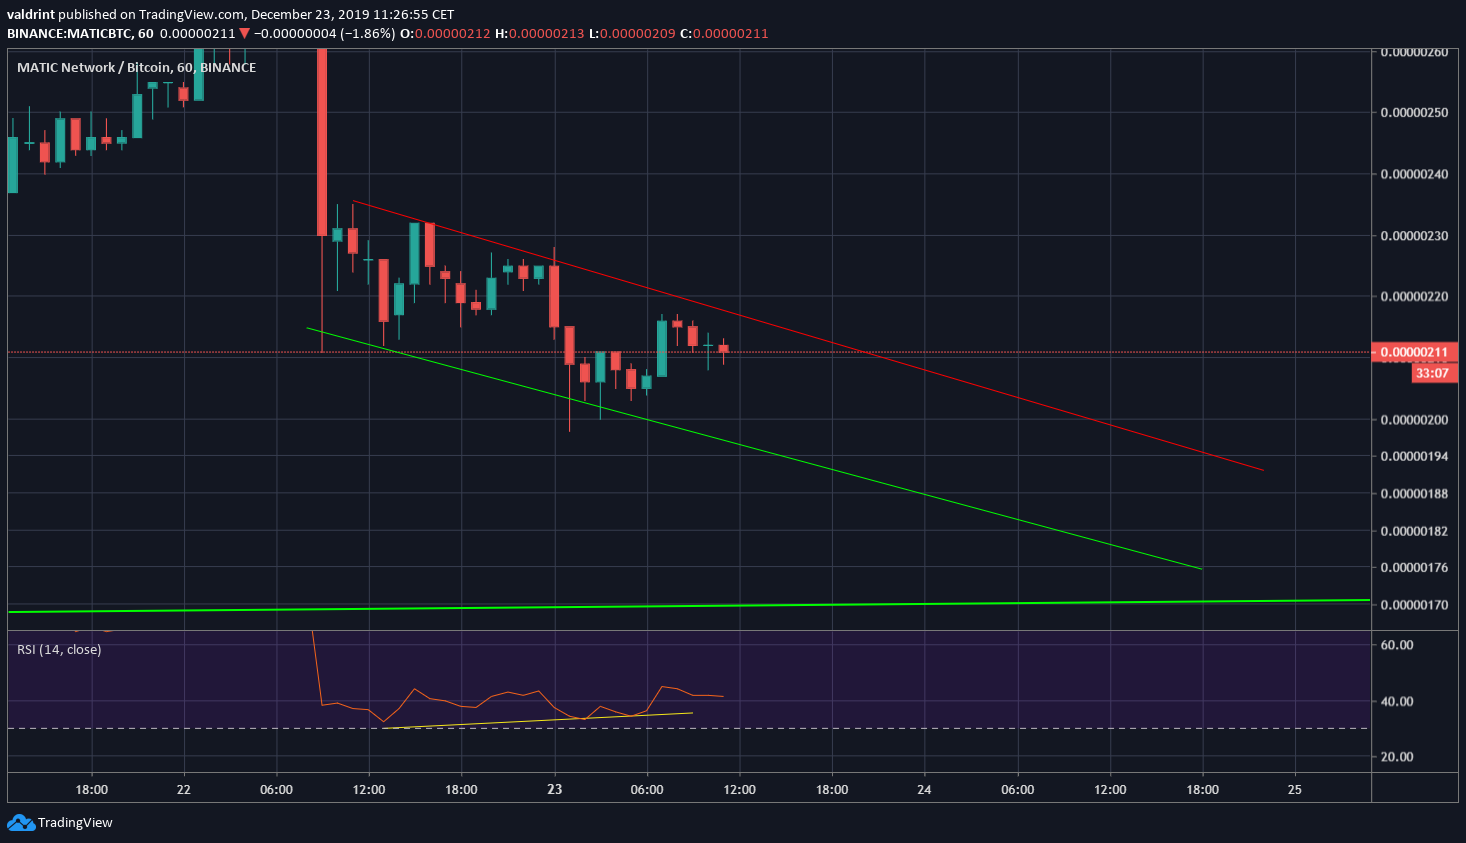
In the short-term, MATIC is trading inside a descending channel and has generated some bullish divergence in lower time-frames.
The price seems likely to decrease at the rate of the channel, until it finds support and eventually breaks out.
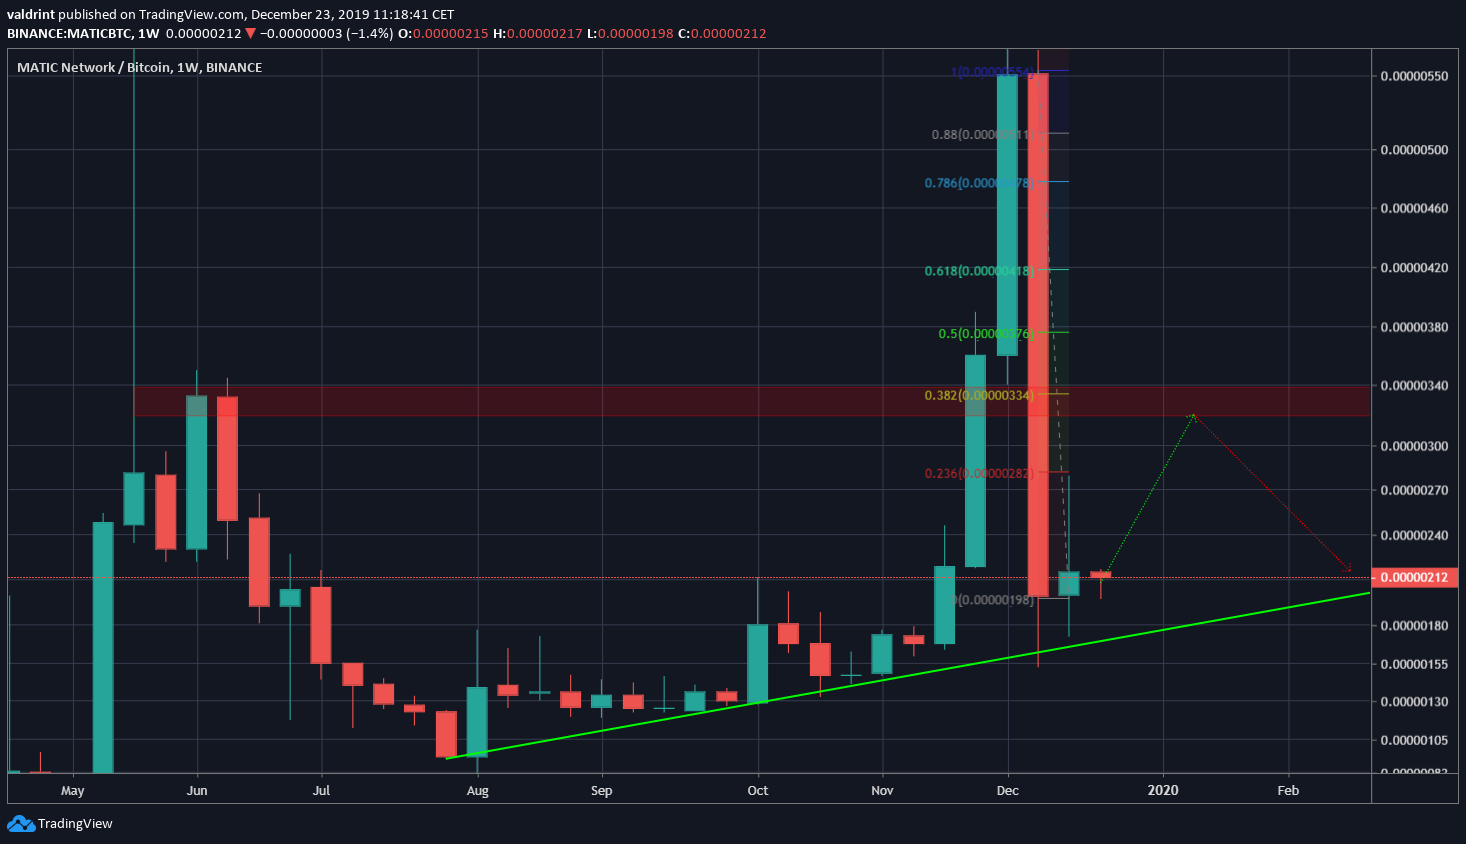
Looking at the weekly chart, we find it very difficult to believe that the MATIC price can initiate a strong rally. There should be very strong resistance at 340 satoshis, created by previous resistance and significant Fib levels.
After the possible descending channel breakout, the most common movement would be for the MATIC price to fall again to the ascending support line and gradually increase at the rate predicted by the ascending support line.
To conclude, the MATIC price has found support above an ascending support line. In the future, it is likely to increase at its rate, with an upper limit of 340 satoshis. We do not think a rapid movement in either direction is likely.


