


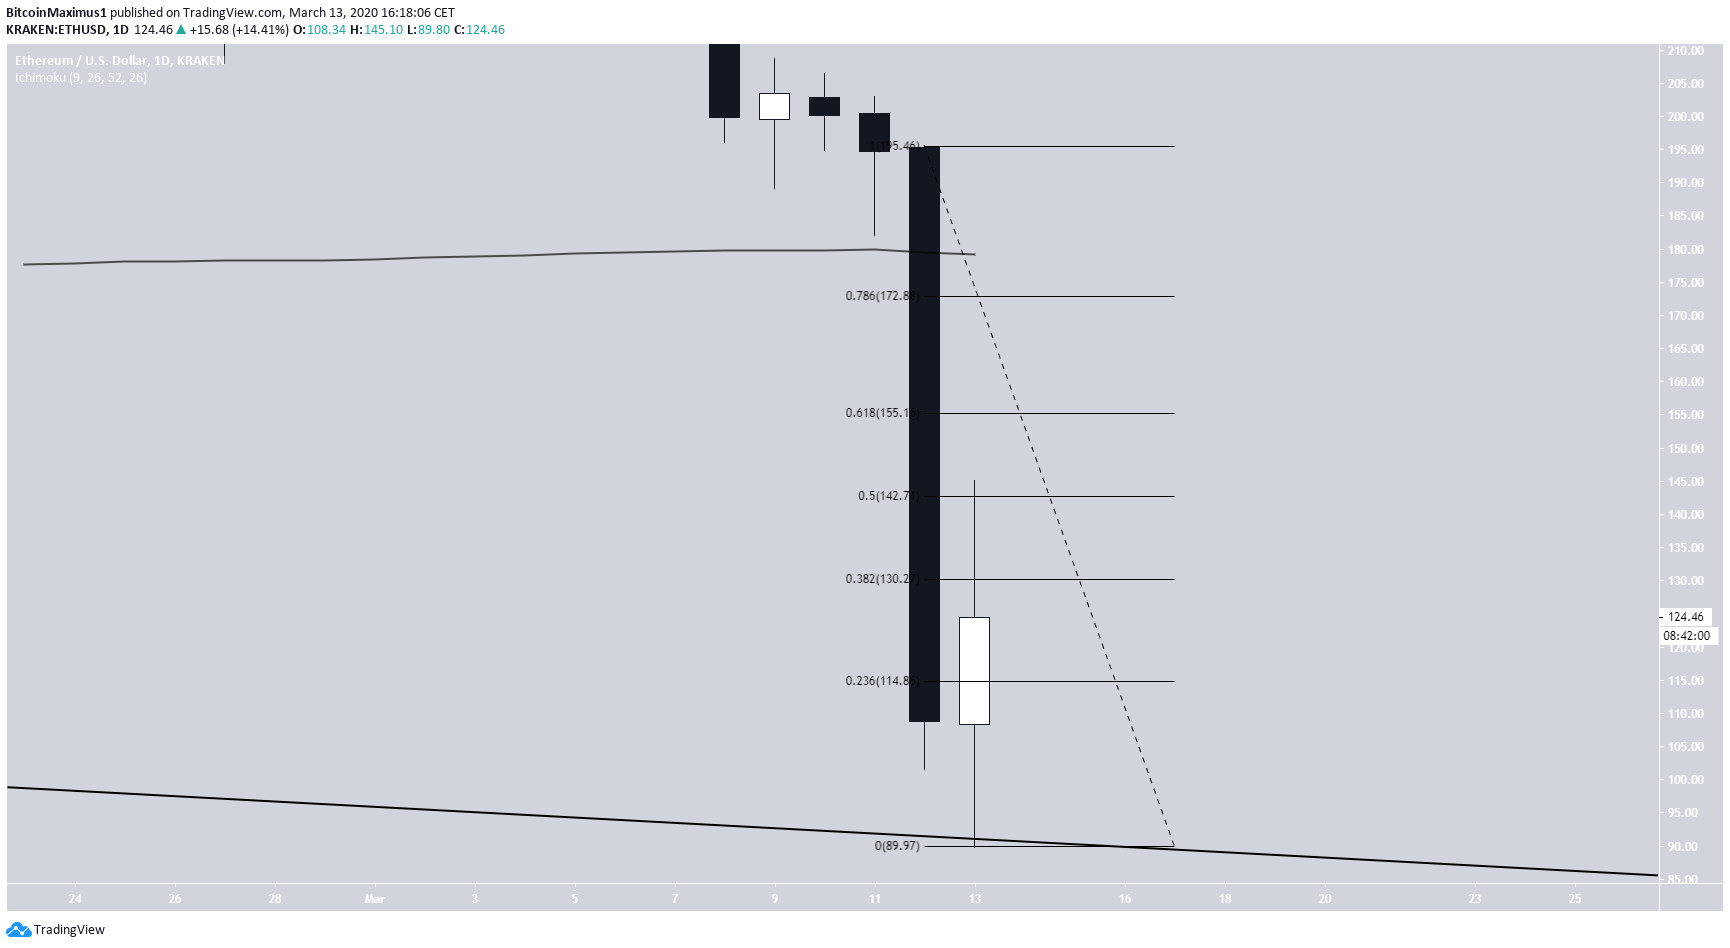
On March 12, the Ethereum price underwent a rapid decrease and reached a low of $89 the next day. ETH had not been trading below $100 since Dec. 8, 2018. However, it immediately bounced and is trading at $116 at the time of writing.
Ethereum (ETH) Price Highlights
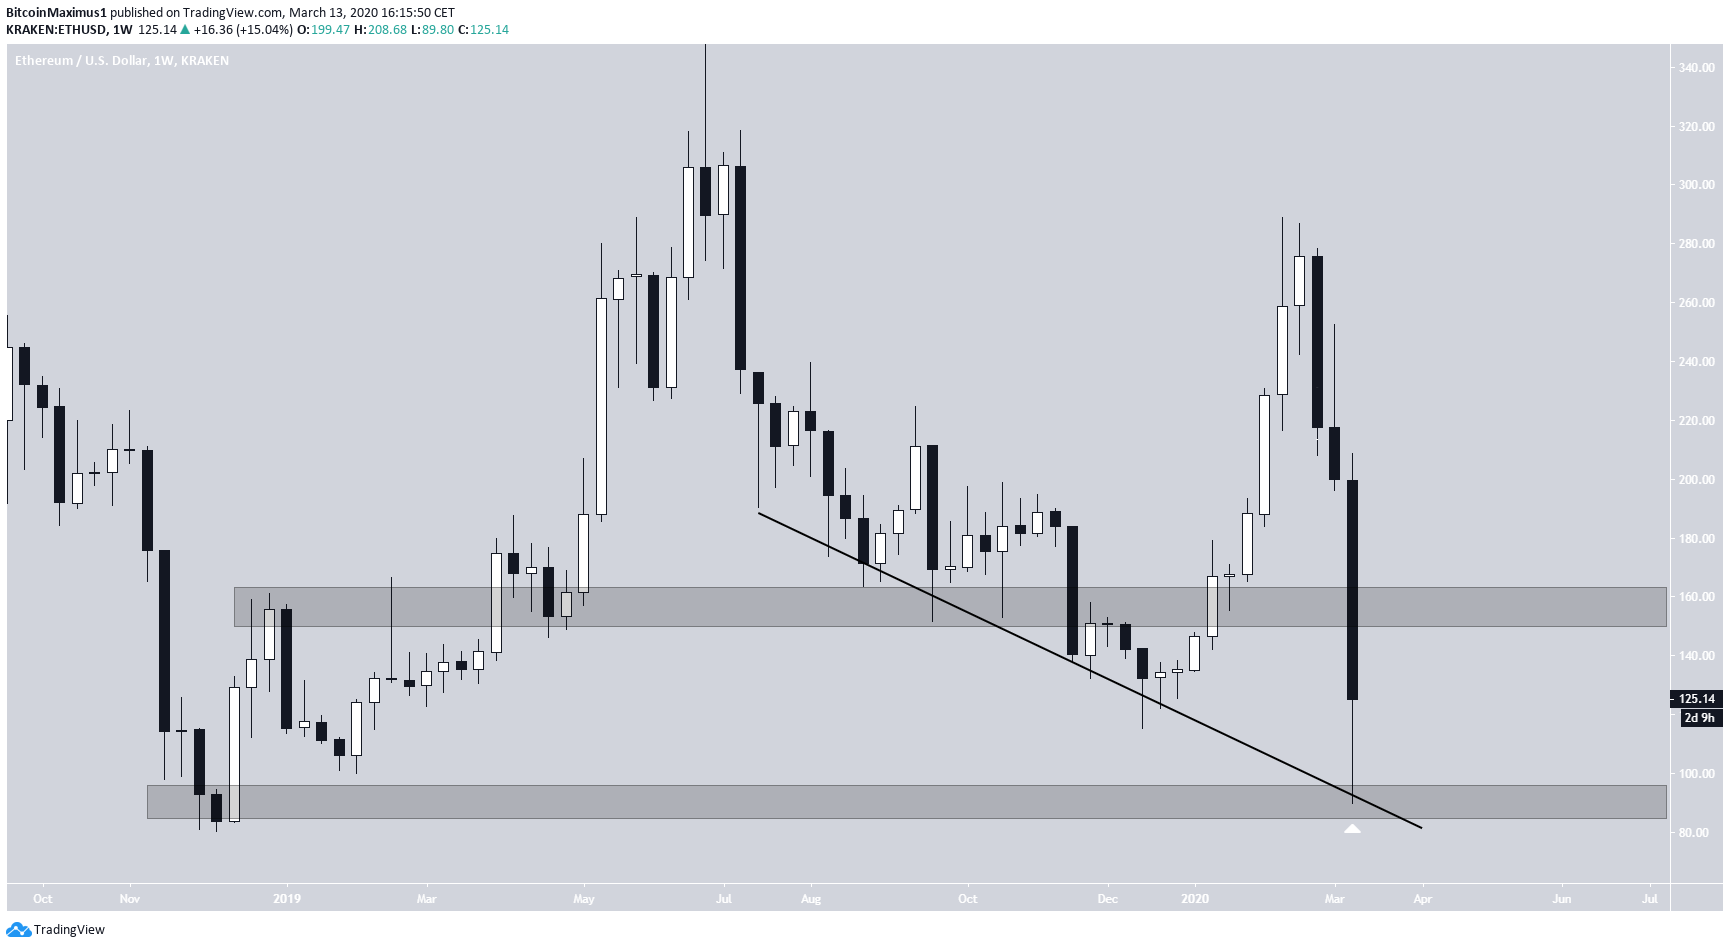
- Ethereum is following a descending support line.
- There is support at $90.
- There is resistance at $160.
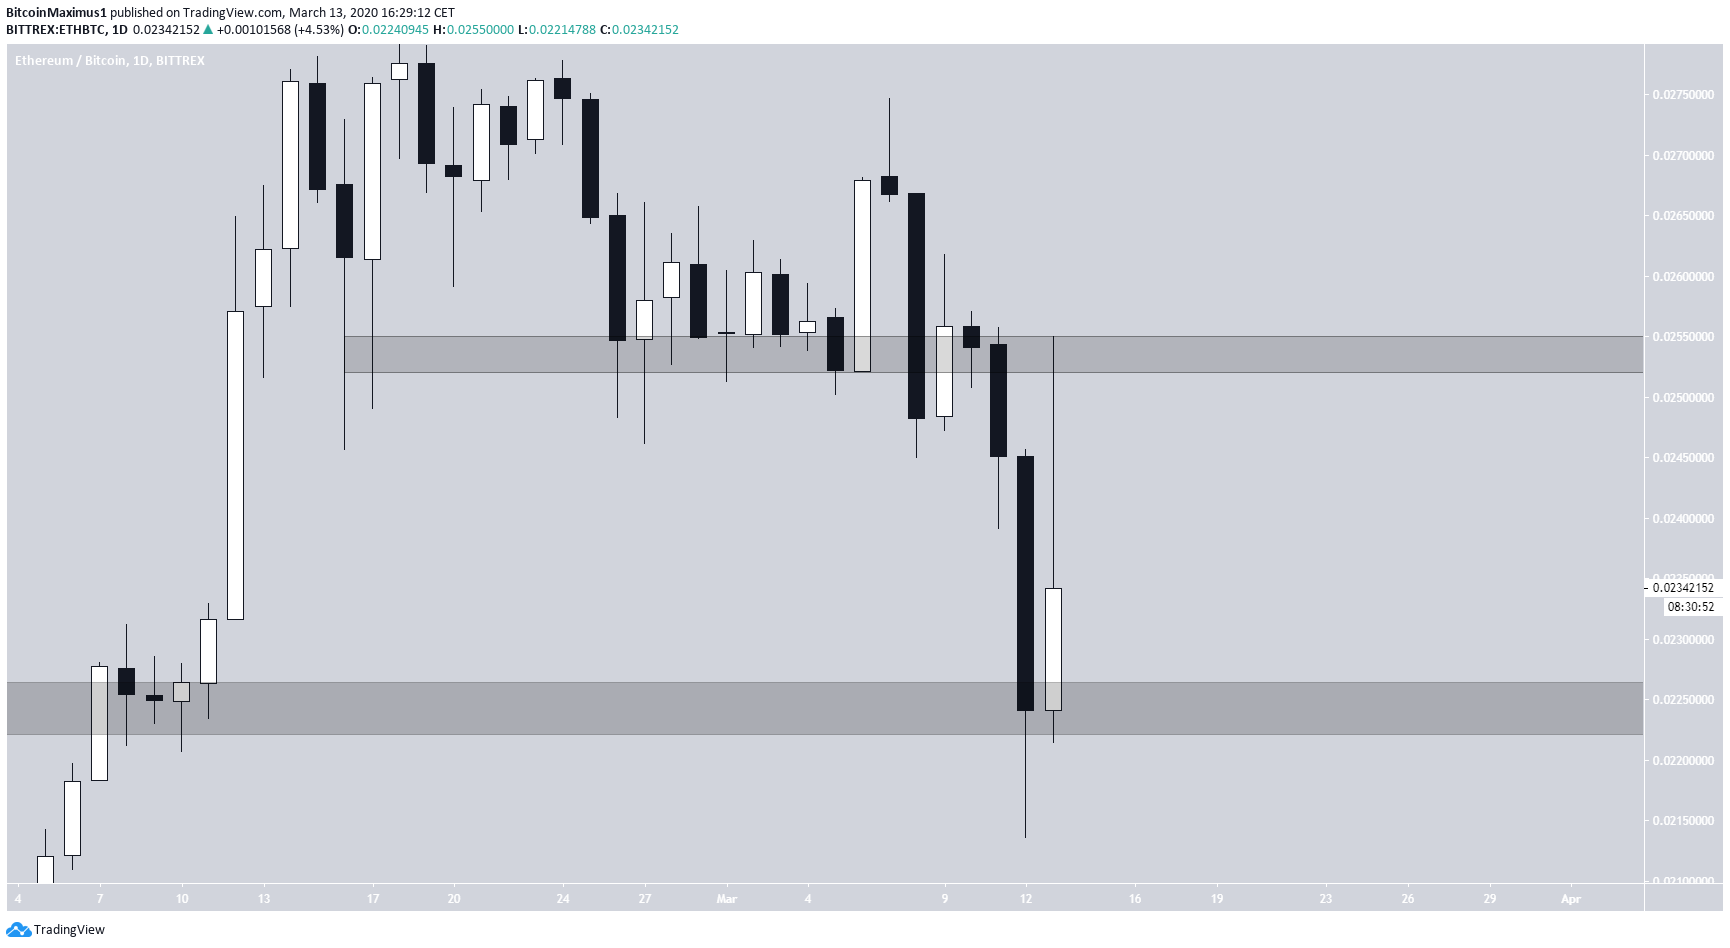
- ETH/BTC is trading in a range between ₿0.225-₿0.255
Cryptocurrency trader @CryptoNTez tweeted an Ethereum chart that shows a 100% increase in the previous two hour candlestick. In addition, he warned that the current market conditions are a double edged sword, with potential for significant movement in either direction.
100% on the last 2H candle…
Trading in this volatility could be as profitable as killer for your account..
Stay safe 😉#ETH pic.twitter.com/tuPfKZWasI
— Nico (@CryptoNTez) March 13, 2020
Has the Ethereum price reached a bottom, or do more decreases await? Continue reading below if you are interested in finding out.
Support Areas
Looking at the weekly chart for Ethereum, there are two main areas of interest, the support at $100 and the resistance at $160.
The price has reached the support area in the form of a long lower wick and bounced upwards. However, it has yet to reach the resistance area.
In addition, the price has been possibly following a descending support line since July 10, which coincides with the $100 support area.
A closer look at the movement reveals that the current bounce is more likely to be a retracement than the beginning of a new upward move. The price has reached the 0.5 Fib retracement level of the entire decrease and has immediately dropped below.
In addition, even if it were to break out above the $160 area, the upside potential is limited since the 200-day moving average (MA) is at $175, likely to provide additional resistance.
Therefore, while it is possible that the price trades between $100-$160, we do not think that it will break out above this area.
Ethereum/Bitcoin
On the other hand, the ETH/BTC pair reached the support area at ₿0.225 and bounced strongly upwards, validating the ₿0.255 area as resistance and leaving a long upper wick in its wake.
Similar to the ETH/USD pair, the price is expected to trade in a range of between ₿0.225-₿0.255.
To conclude, the Ethereum price has reached a significant support area and bounced upwards. We believe it is likely to continue trading in a range between $100-$160. ETH/BTC is expected to do the same in a range between ₿0.225-₿0.255.


