

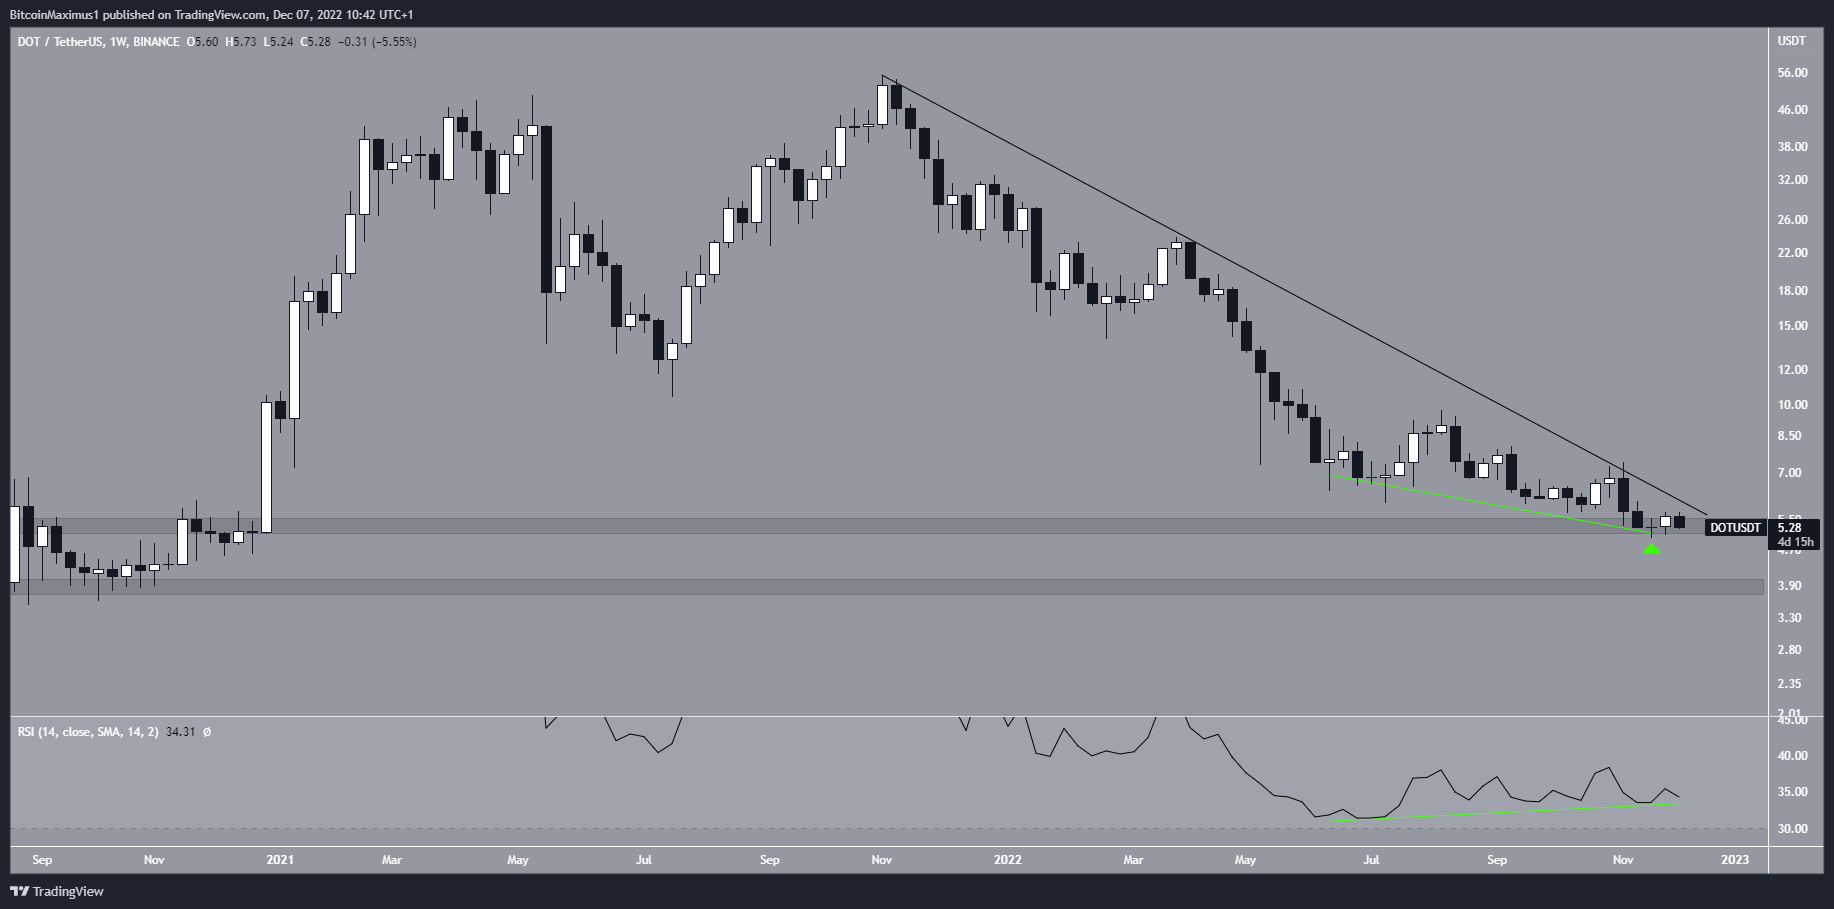
The Polkadot (DOT) price is trading inside a short-term bullish pattern but has yet to show any bullish reversal signs.
The Polkadot price decreased below a descending resistance line since reaching an all-time high of $55.09 in Nov. 2021. The downward movement led to a low of $5 last month. While the DOT price bounced afterward, validating the $5.40 area as support, it failed to initiate a significant upward movement.
The weekly RSI is bullish, since it has generated a significant amount of bullish divergence (green line). However, the price action has yet to confirm the reversal.
If the DOT price reaches a weekly close below the $5.40 area, it would likely cause a fall towards the next support at $3.90.
Conversely, a breakout from the long-term resistance line would confirm the bullish trend reversal.
Polkadot Price Approaches End of Bullish Pattern
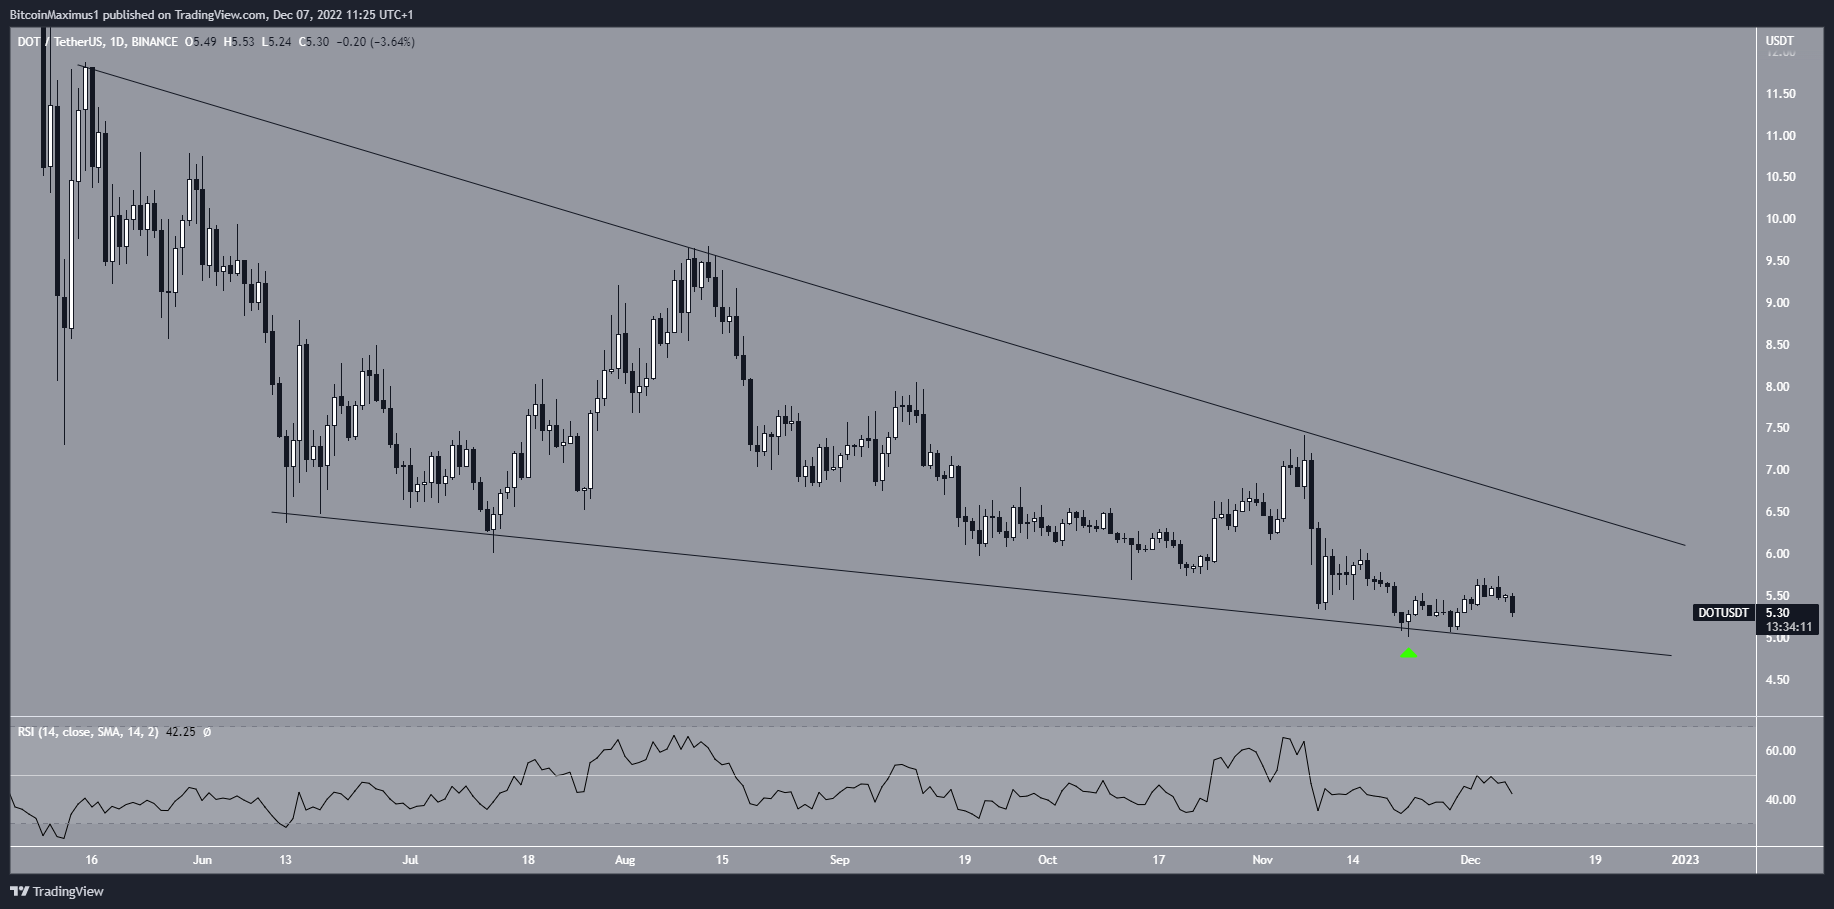
A look at the daily time frame shows that the DOT price has been trading inside an ascending wedge since May 13. The descending wedge is considered a bullish pattern, meaning that a breakout from it is expected.
On Nov. 22, DOT bounced at the support line of the wedge (green icon) but has yet to initiate an upward movement.
Unlike the weekly RSI, the daily one is bearish, since it has not generated any bullish divergence and is below 50.
As a result, the daily time frame outlook is the opposite of the weekly. While the price action is bullish, the RSI reading is bearish.
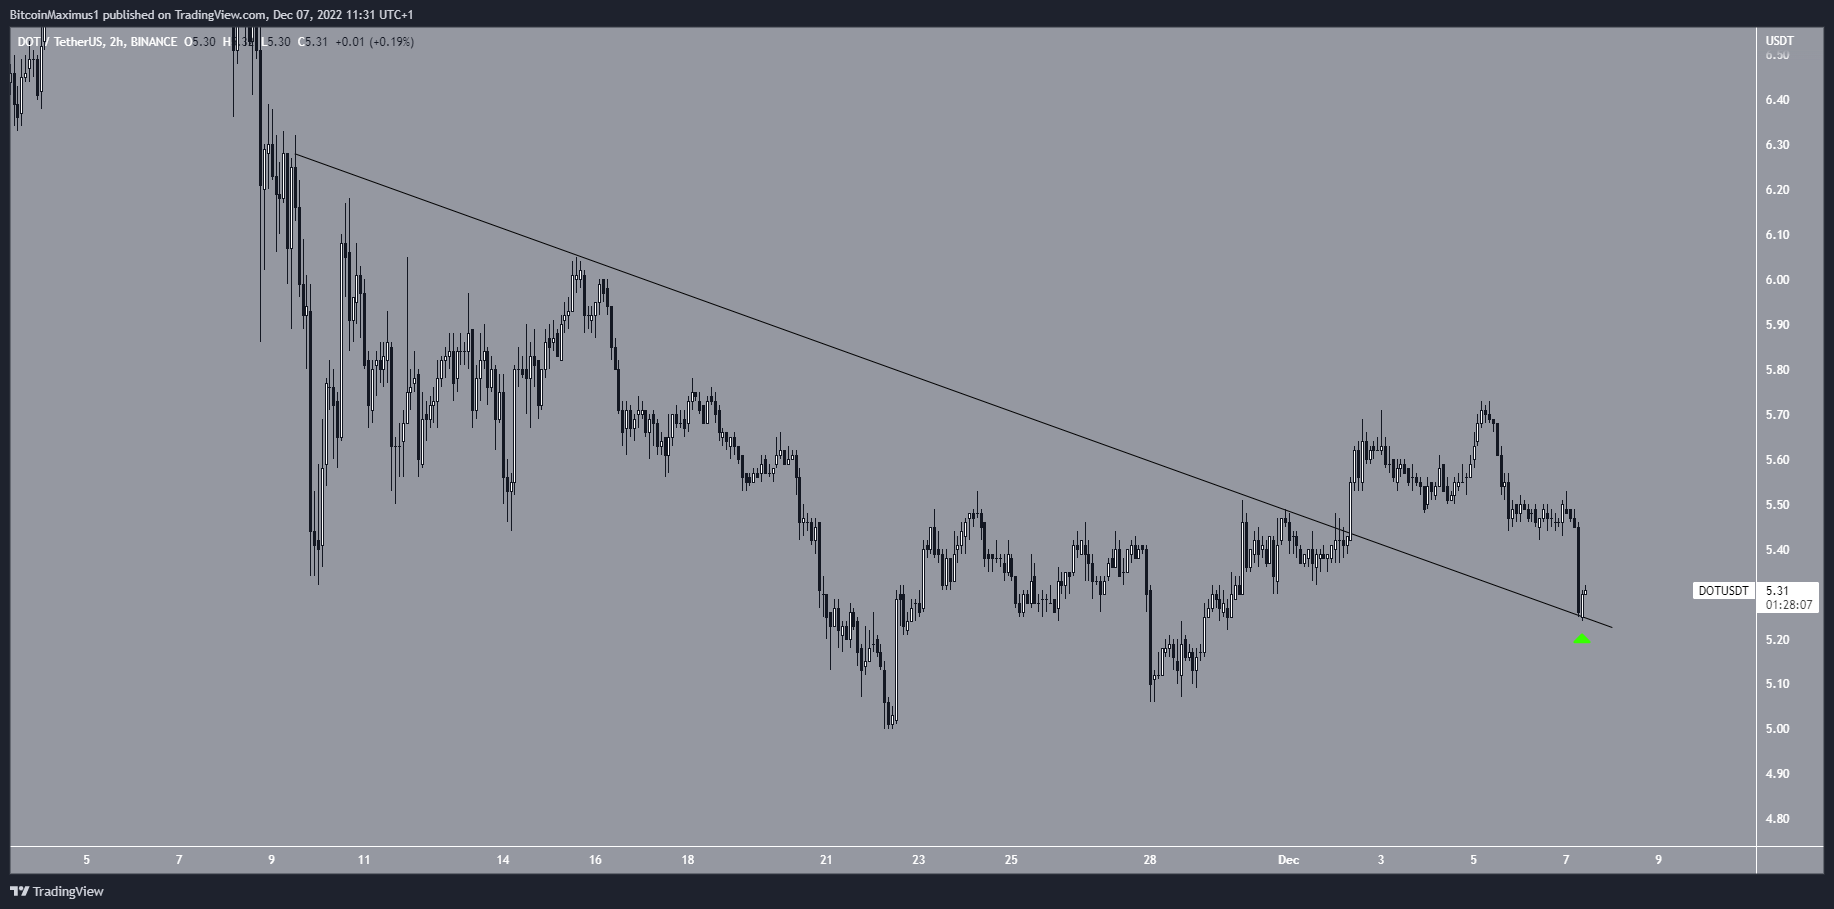
Can DOT Price Sustain Breakout?
Finally, the two-hour chart shows that the DOT price broke out from a short-term descending resistance line. It is now in the process of validating it as support (green icon).
As a result, if the breakout is sustained and the Polkadot price resumes its upward movement, it could increase towards the resistance line of the long-term wedge at $6.
Conversely, failure to do so would likely lead to a fall towards the support line of the same wedge.
Afterward, the direction of the long-term trend will be determined by whether the DOT price breaks out from the long-term resistance line or closes below $5.40.
For BeInCrypto’s latest crypto market analysis, click here.
Disclaimer: BeInCrypto strives to provide accurate and up-to-date news and information, but it will not be responsible for any missing facts or inaccurate information. You comply and understand that you should use any of this information at your own risk. Cryptocurrencies are highly volatile financial assets, so research and make your own financial decisions.
Disclaimer
In line with the Trust Project guidelines, this price analysis article is for informational purposes only and should not be considered financial or investment advice. BeInCrypto is committed to accurate, unbiased reporting, but market conditions are subject to change without notice. Always conduct your own research and consult with a professional before making any financial decisions. Please note that our Terms and Conditions, Privacy Policy, and Disclaimers have been updated.
